©The Author(s) 2025.
World J Gastrointest Oncol. Jan 15, 2025; 17(1): 96439
Published online Jan 15, 2025. doi: 10.4251/wjgo.v17.i1.96439
Published online Jan 15, 2025. doi: 10.4251/wjgo.v17.i1.96439
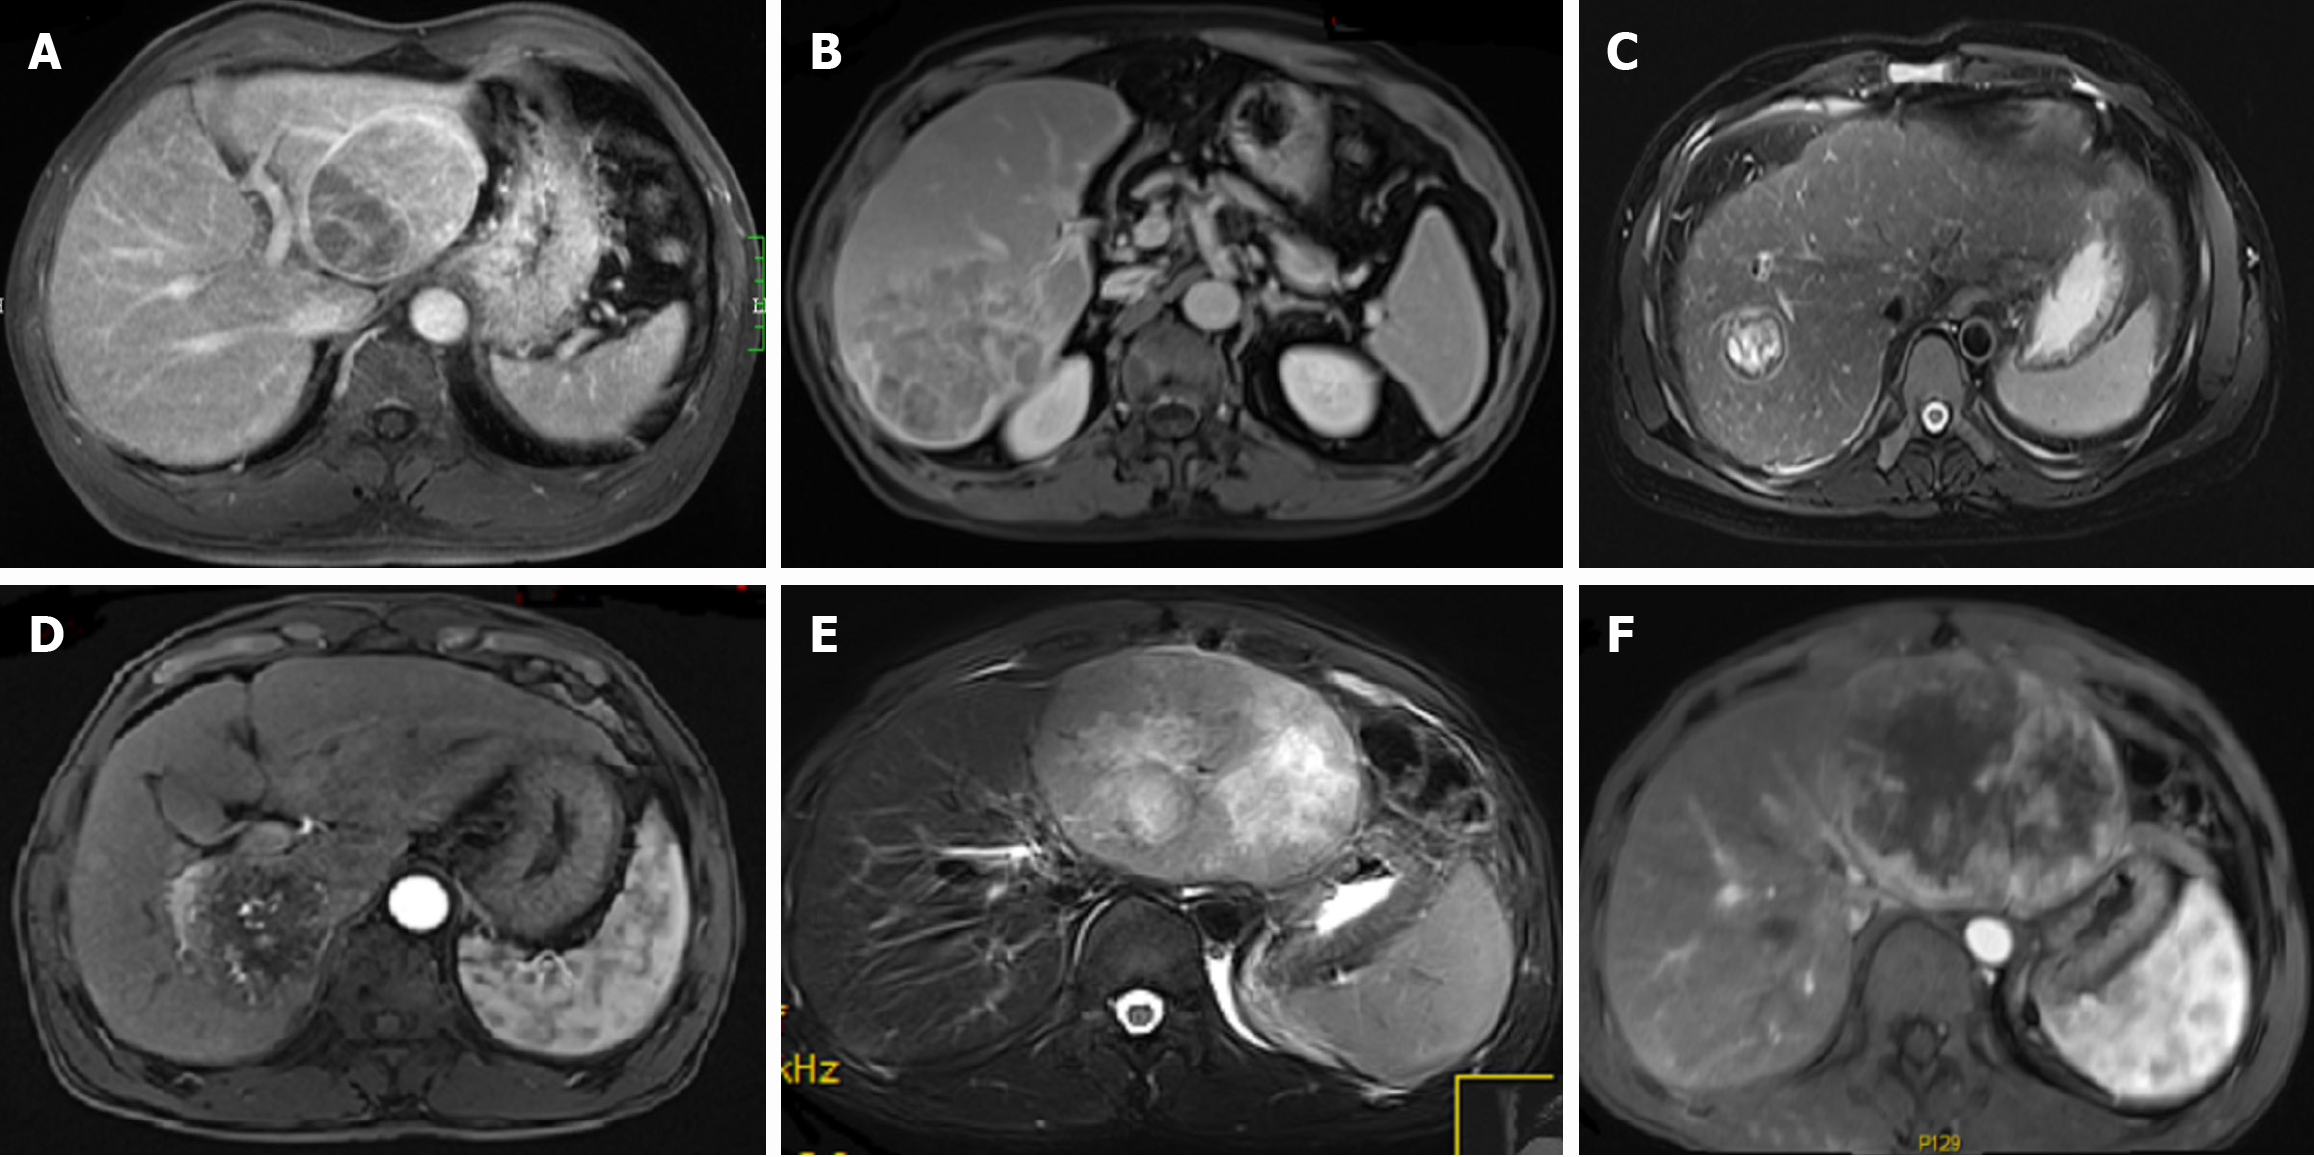
Figure 1 Representative examples of hepatocellular carcinoma magnetic resonance imaging radiological signs.
A: Axial portal venous phase image: A high-signal ring surrounding the tumor lesion edge in the left lobe of the liver, demonstrating good continuity, indicative of a complete pseudocapsule; B: Axial delayed phase image: A high-signal ring around the tumor lesion edge in the right lobe of the liver with interrupted continuity, suggesting an incomplete pseudocapsule; C: Axial T2-weighted imaging image: Irregular liver margin and diffuse reticular slightly low-signal change of the liver parenchyma, characteristic of cirrhosis; D: Axial arterial phase image: Thickened and tortuous enhanced blood vessels within the tumor lesion in the right lobe of the liver, representing tumor vessels; E: Axial T2-weighted imaging image: Irregular patchy high-signal region within a large tumor, suggesting areas of cystic degeneration or necrosis; F: Axial delayed phase image: Corresponding to E, showing no enhancement in the areas of suspected cystic degeneration or necrosis.
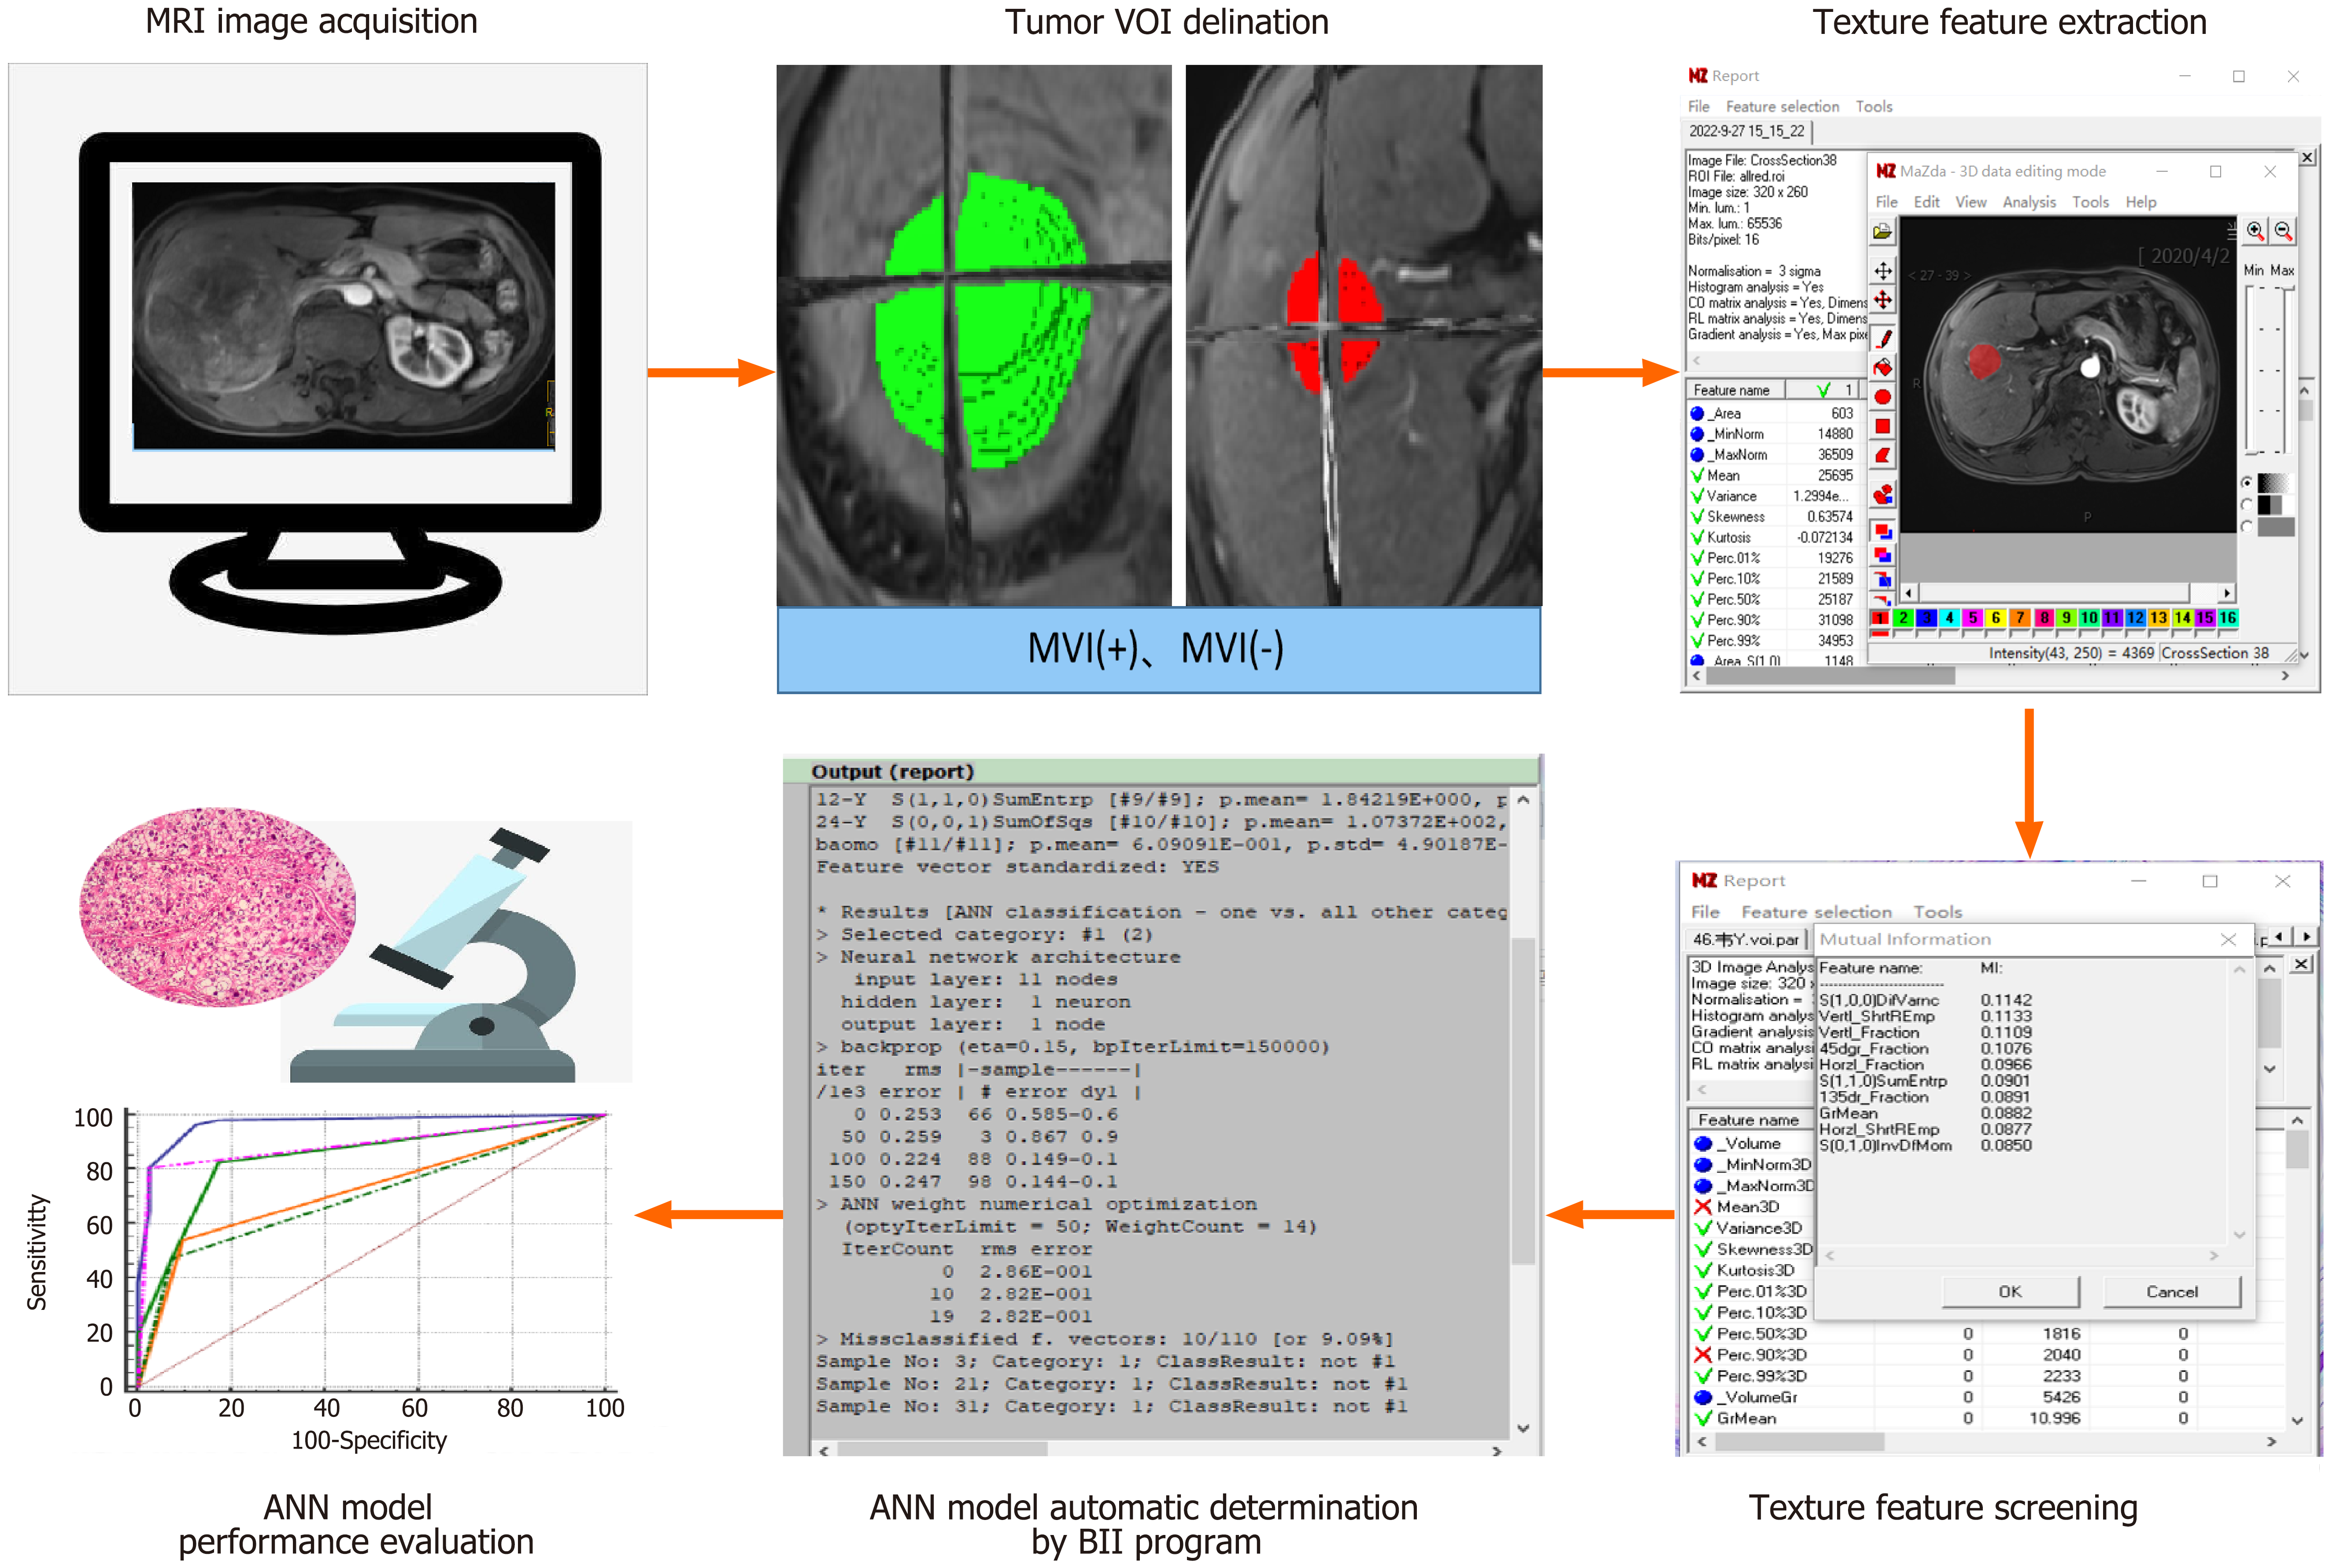
Figure 2 Flowchart of artificial neural network model construction based on magnetic resonance imaging texture features.
MRI: Magnetic resonance imaging; ANN: Artificial neural network; VOI: Volume of interest; MVI: Microvascular invasion.
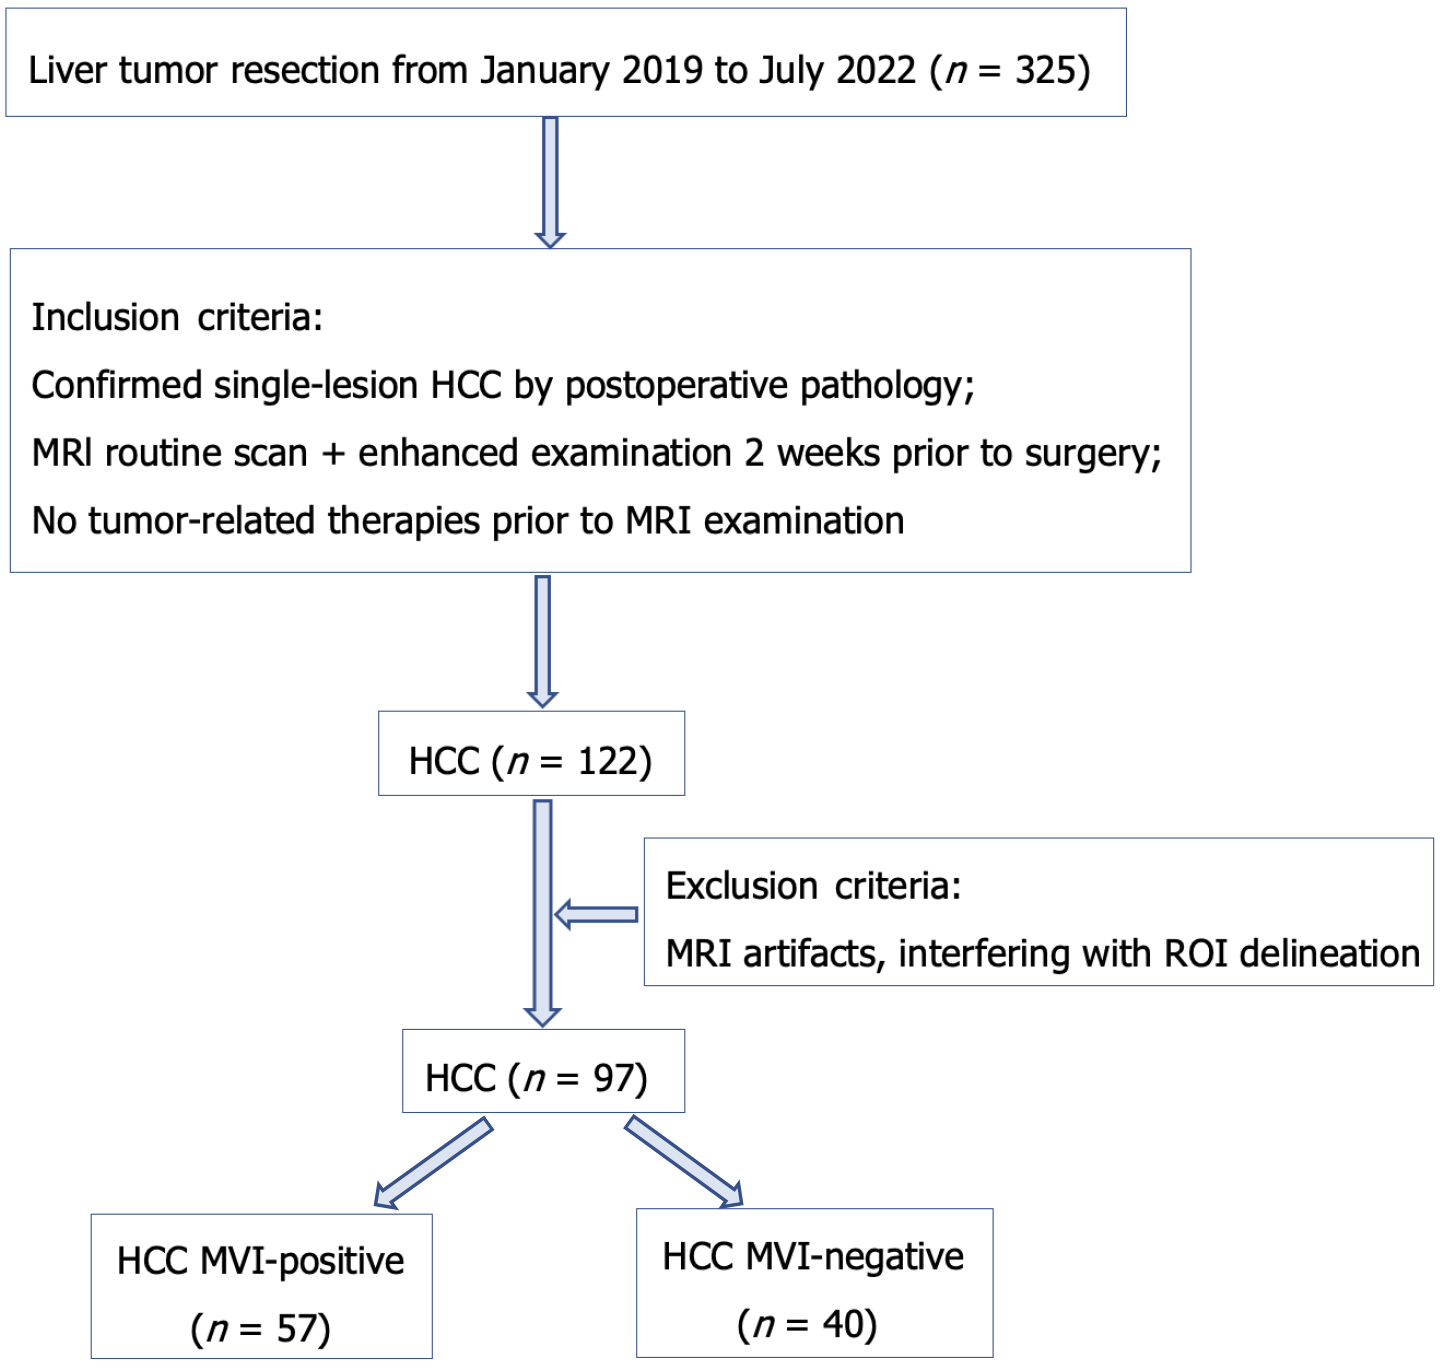
Figure 3 Flowchart of subject enrollment in this study.
MRI: Magnetic resonance imaging; MVI: Microvascular invasion; HCC: Hepatocellular carcinoma; ROI: Region of interest.
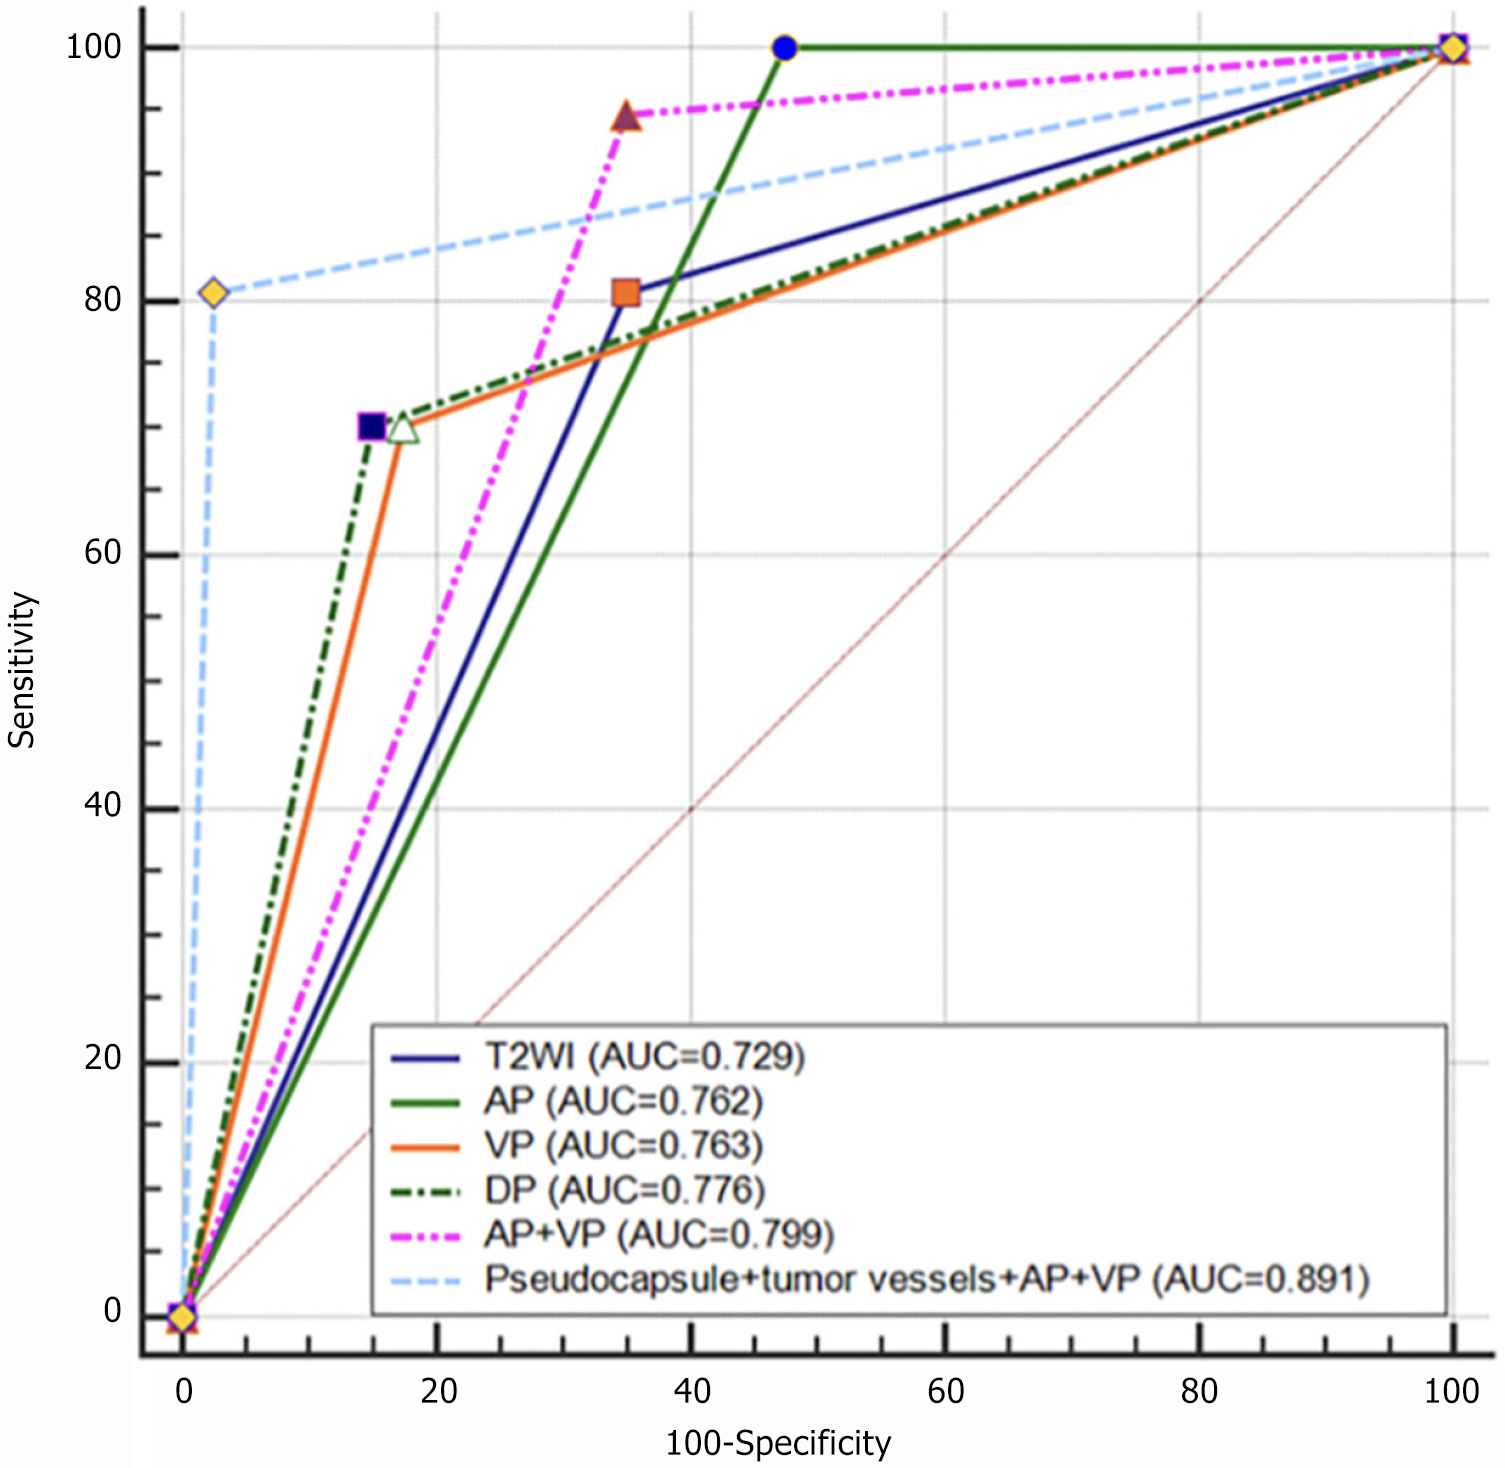
Figure 4 Receiver operating characteristic curves for predicting hepatocellular carcinoma microvascular invasion using artificial neural network models constructed on different sequence features.
T2WI: T2-weighted imaging; AUC: Area under curve; AP: Arterial phases; VP: Venous phase; DP: Delayed phase.
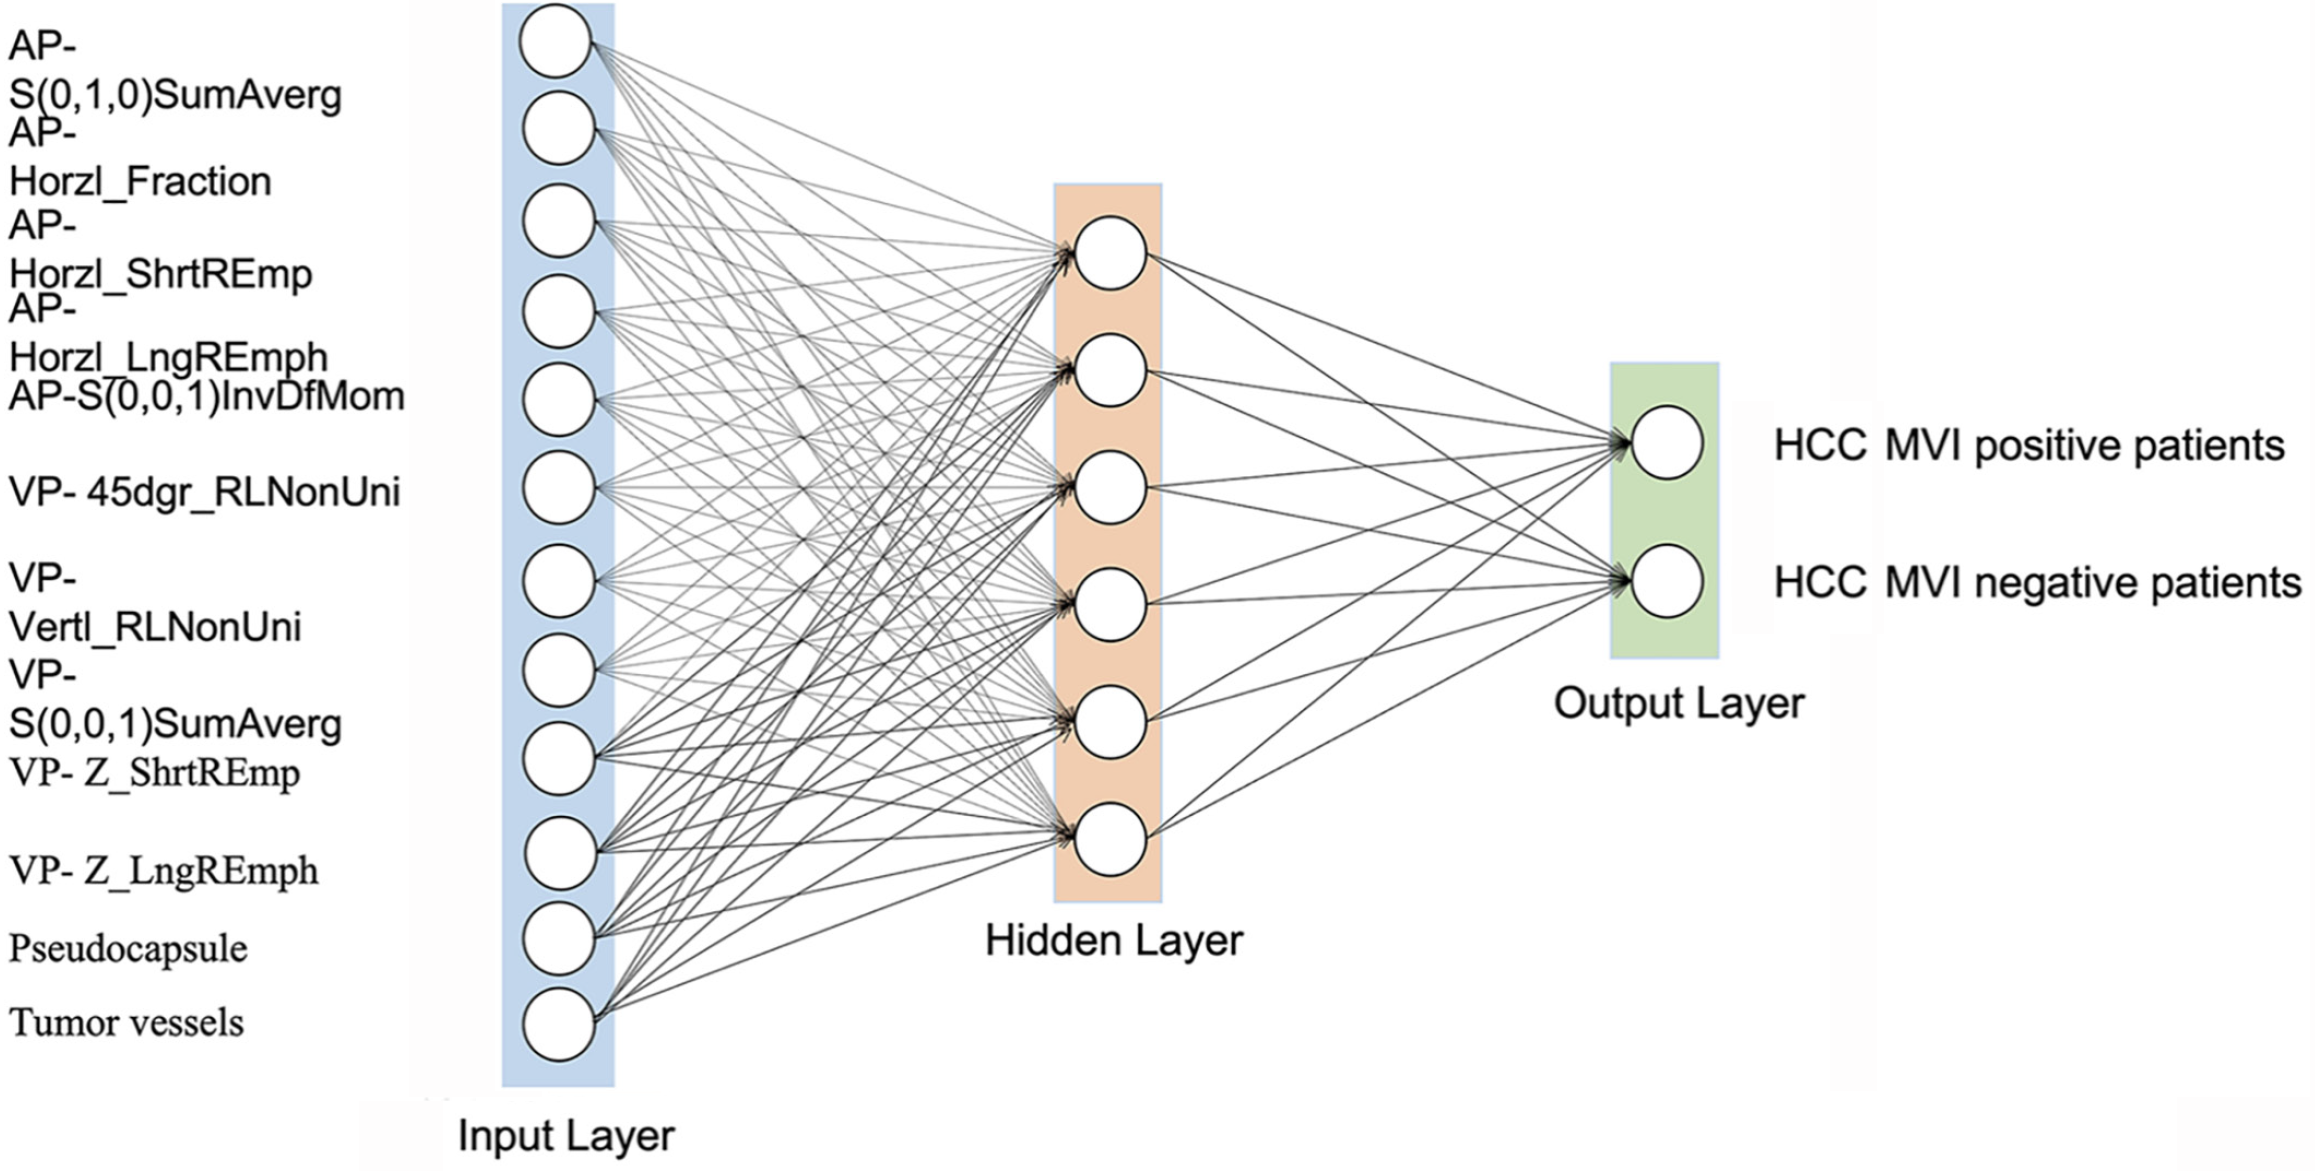
Figure 5 Schematic diagram of the combined group artificial neural network model structure.
AP: Arterial phases; VP: Venous phase; MVI: Microvascular invasion; HCC: Hepatocellular carcinoma.
- Citation: Nong HY, Cen YY, Lu SJ, Huang RS, Chen Q, Huang LF, Huang JN, Wei X, Liu MR, Li L, Ding K. Predictive value of a constructed artificial neural network model for microvascular invasion in hepatocellular carcinoma: A retrospective study. World J Gastrointest Oncol 2025; 17(1): 96439
- URL: https://www.wjgnet.com/1948-5204/full/v17/i1/96439.htm
- DOI: https://dx.doi.org/10.4251/wjgo.v17.i1.96439


