©The Author(s) 2025.
World J Gastrointest Oncol. Jan 15, 2025; 17(1): 92908
Published online Jan 15, 2025. doi: 10.4251/wjgo.v17.i1.92908
Published online Jan 15, 2025. doi: 10.4251/wjgo.v17.i1.92908
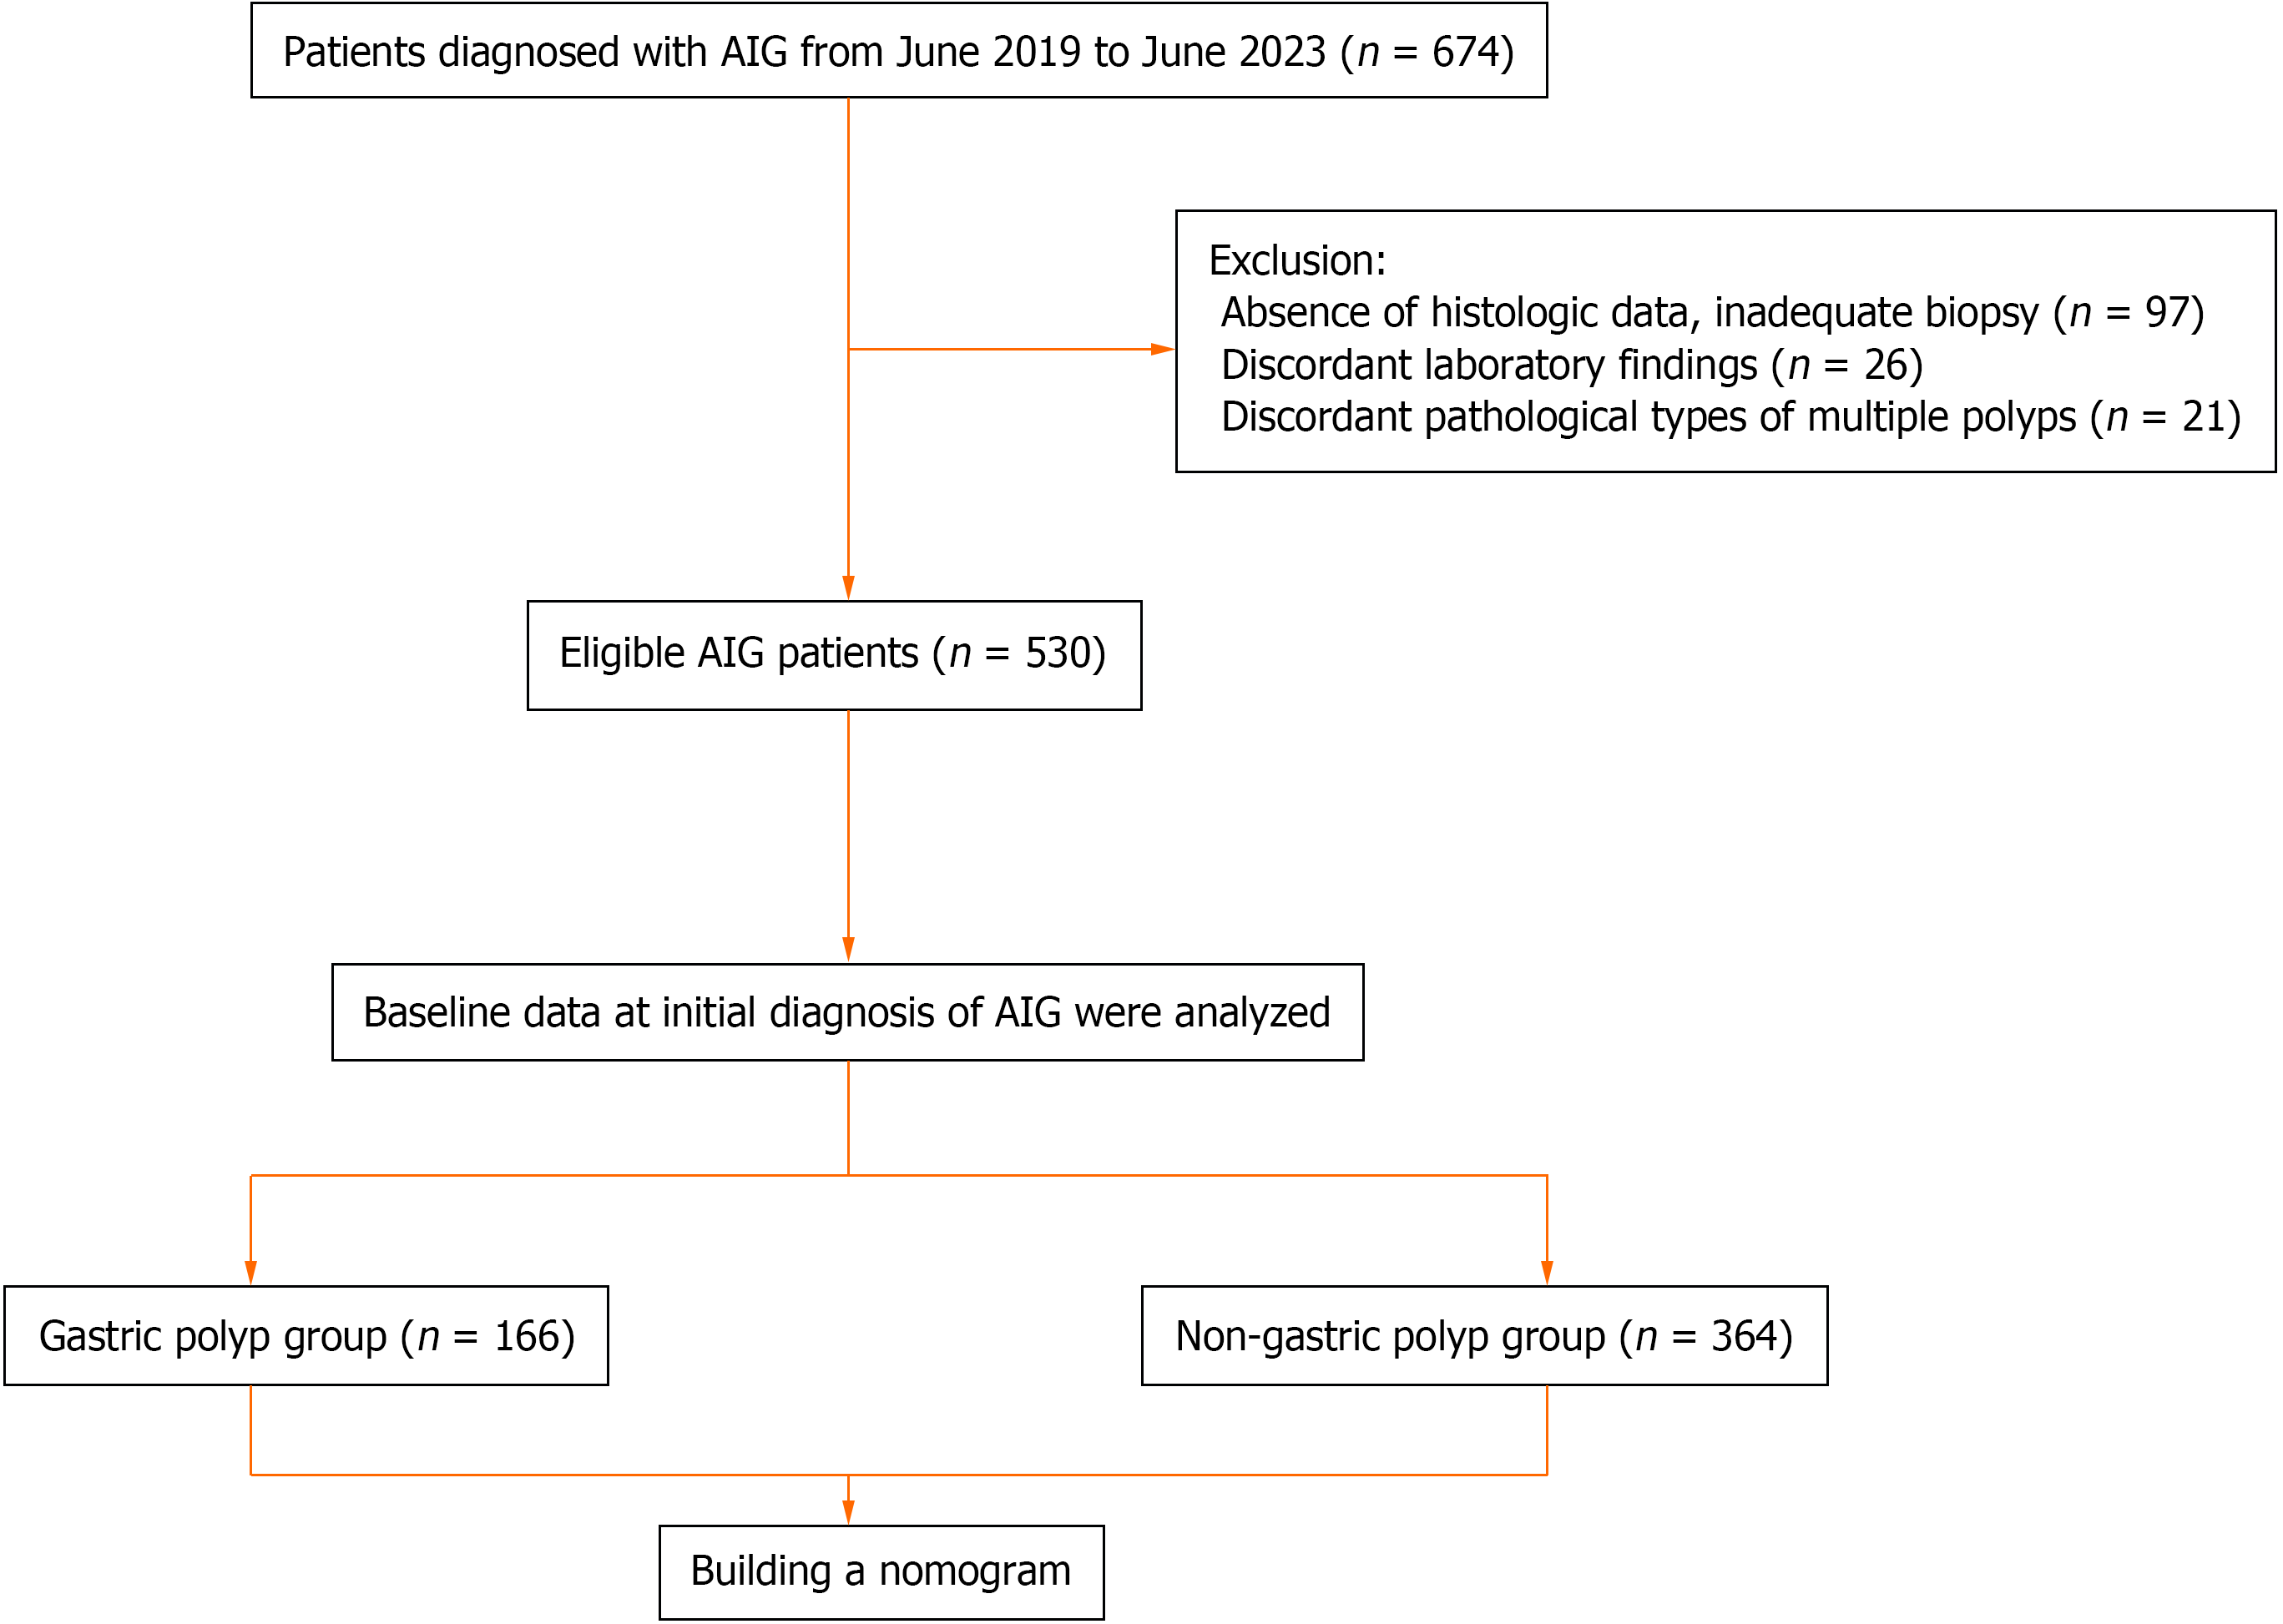
Figure 1 Flow chart depicting the study population and study design.
AIG: Autoimmune gastritis.
Figure 2 Group differences between the gastric polyp and without gastric polyp groups.
A: Heat map of age and blood biochemical difference between gastric polyp group and without gastric polyp group; B: Heat map of histopathological differences between gastric polyp group and without gastric polyp group. GP: Gastric polyp; NGP: Without gastric polyp; FDR: False discovery rate; PG: Pepsinogen; ECL: Enterochromaffin-like; OLGA: Operative Link on Gastritis Assessment; OLGIM: Operative Link on Gastric Intestinal Metaplasia; PCA: Parietal cell antibody.
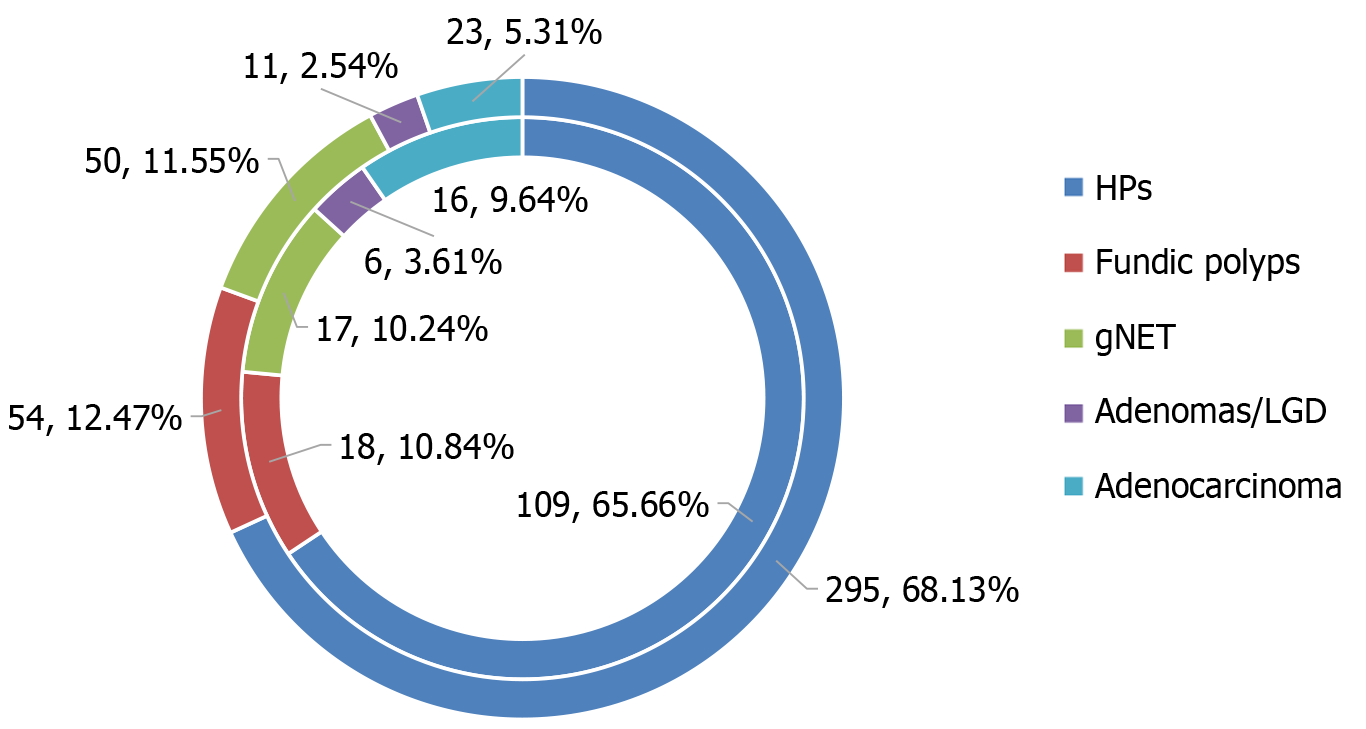
Figure 3 The proportion of gastric polyps and autoimmune gastritis patients.
HP: Helicobacter pylori; gNET: Gastric neuroendocrine tumor; LGD: Low-grade glandular dysplasia.
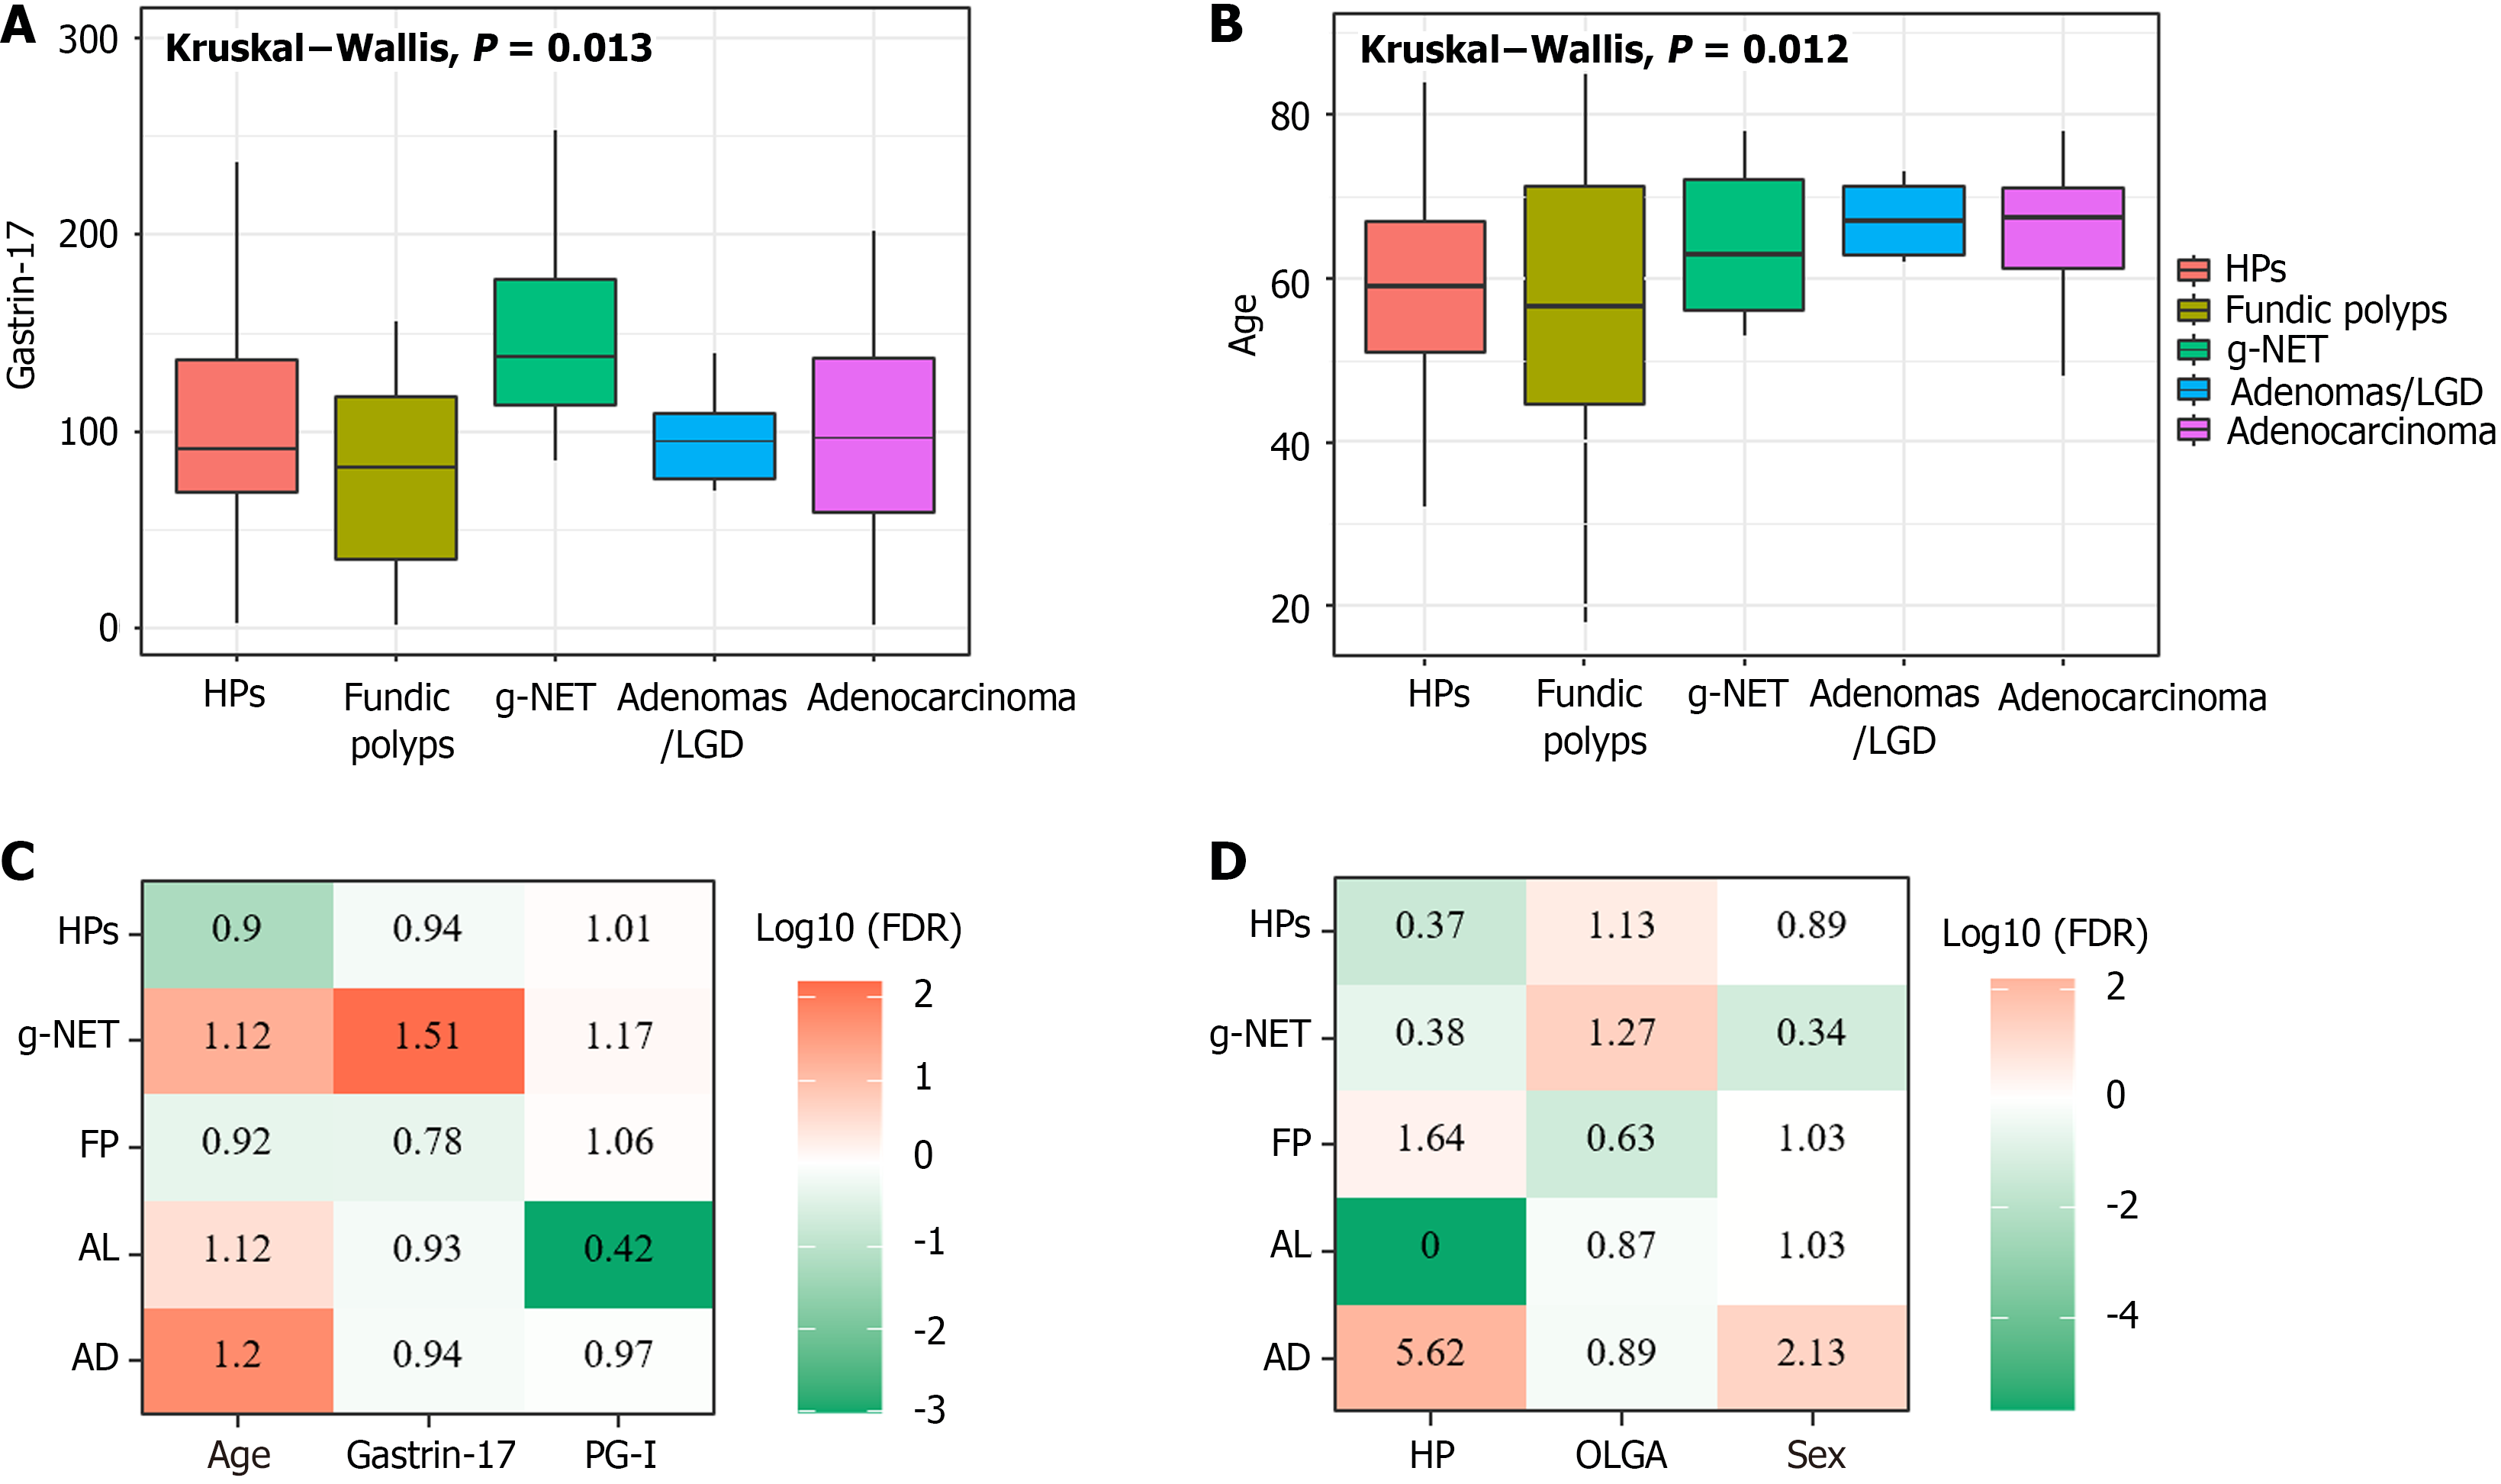
Figure 4 Differences among the gastric polyp groups.
A: Gastrin-17 differences between groups; B: Age differences between groups; C: Heat map of age and blood biochemical differences between groups; D: Heat map of histopathological differences between groups. HP: Helicobacter pylori; gNET: Gastric neuroendocrine tumor; LGD: Llow-grade glandular dysplasia; FP: Fundic polyps; AL: Adenomas/low-grade glandular dysplasia; AD: Adenocarcinoma; PG: Pepsinogen; OLGA: Operative Link on Gastritis Assessment; FDR: False discovery rate.
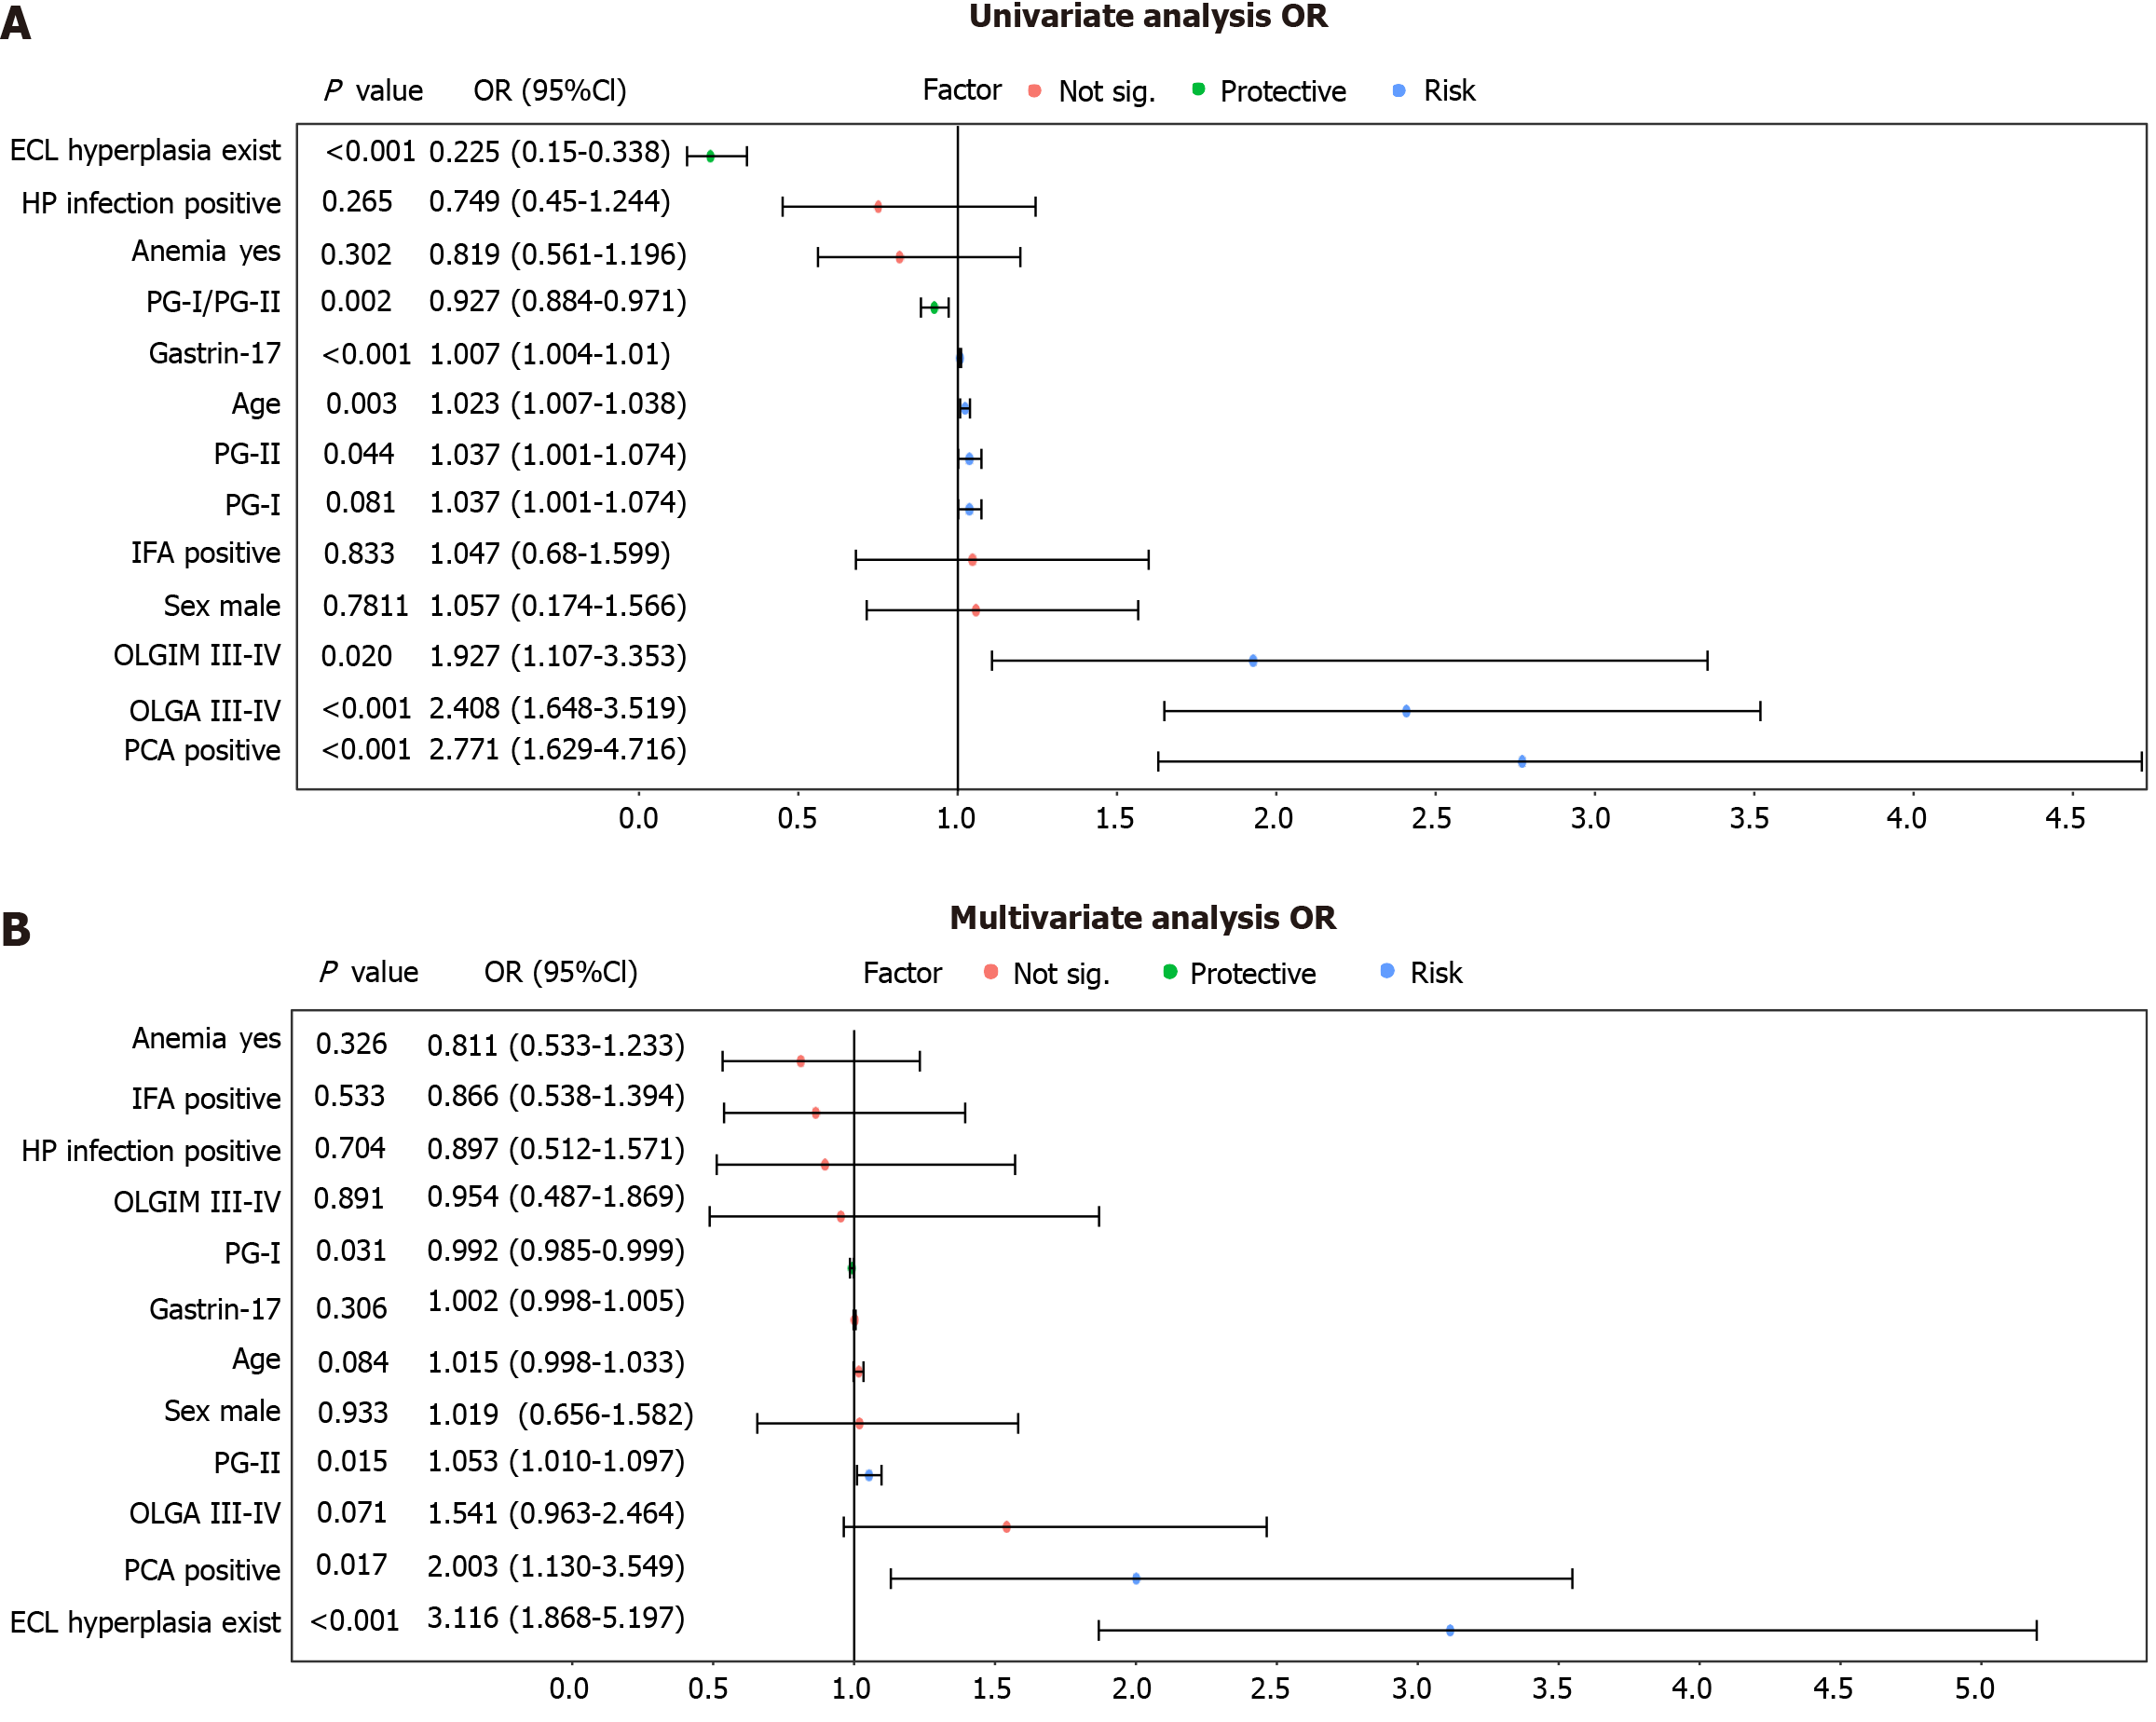
Figure 5 Forestplot depicting the results of univariate and multivariate analyses.
A: Forest plots for univariate analysis; B: Forest plots for multivariate analysis. OR: Odds ratio; CI: Confidence interval; ECL: Enterochromaffin-like; HP: Helicobacter pylori; PG: Pepsinogen; IFA: Intrinsic factor antibody; OLGA: Operative Link on Gastritis Assessment; OLGIM: Operative Link on Gastric Intestinal Metaplasia; PCA: Parietal cell antibody.
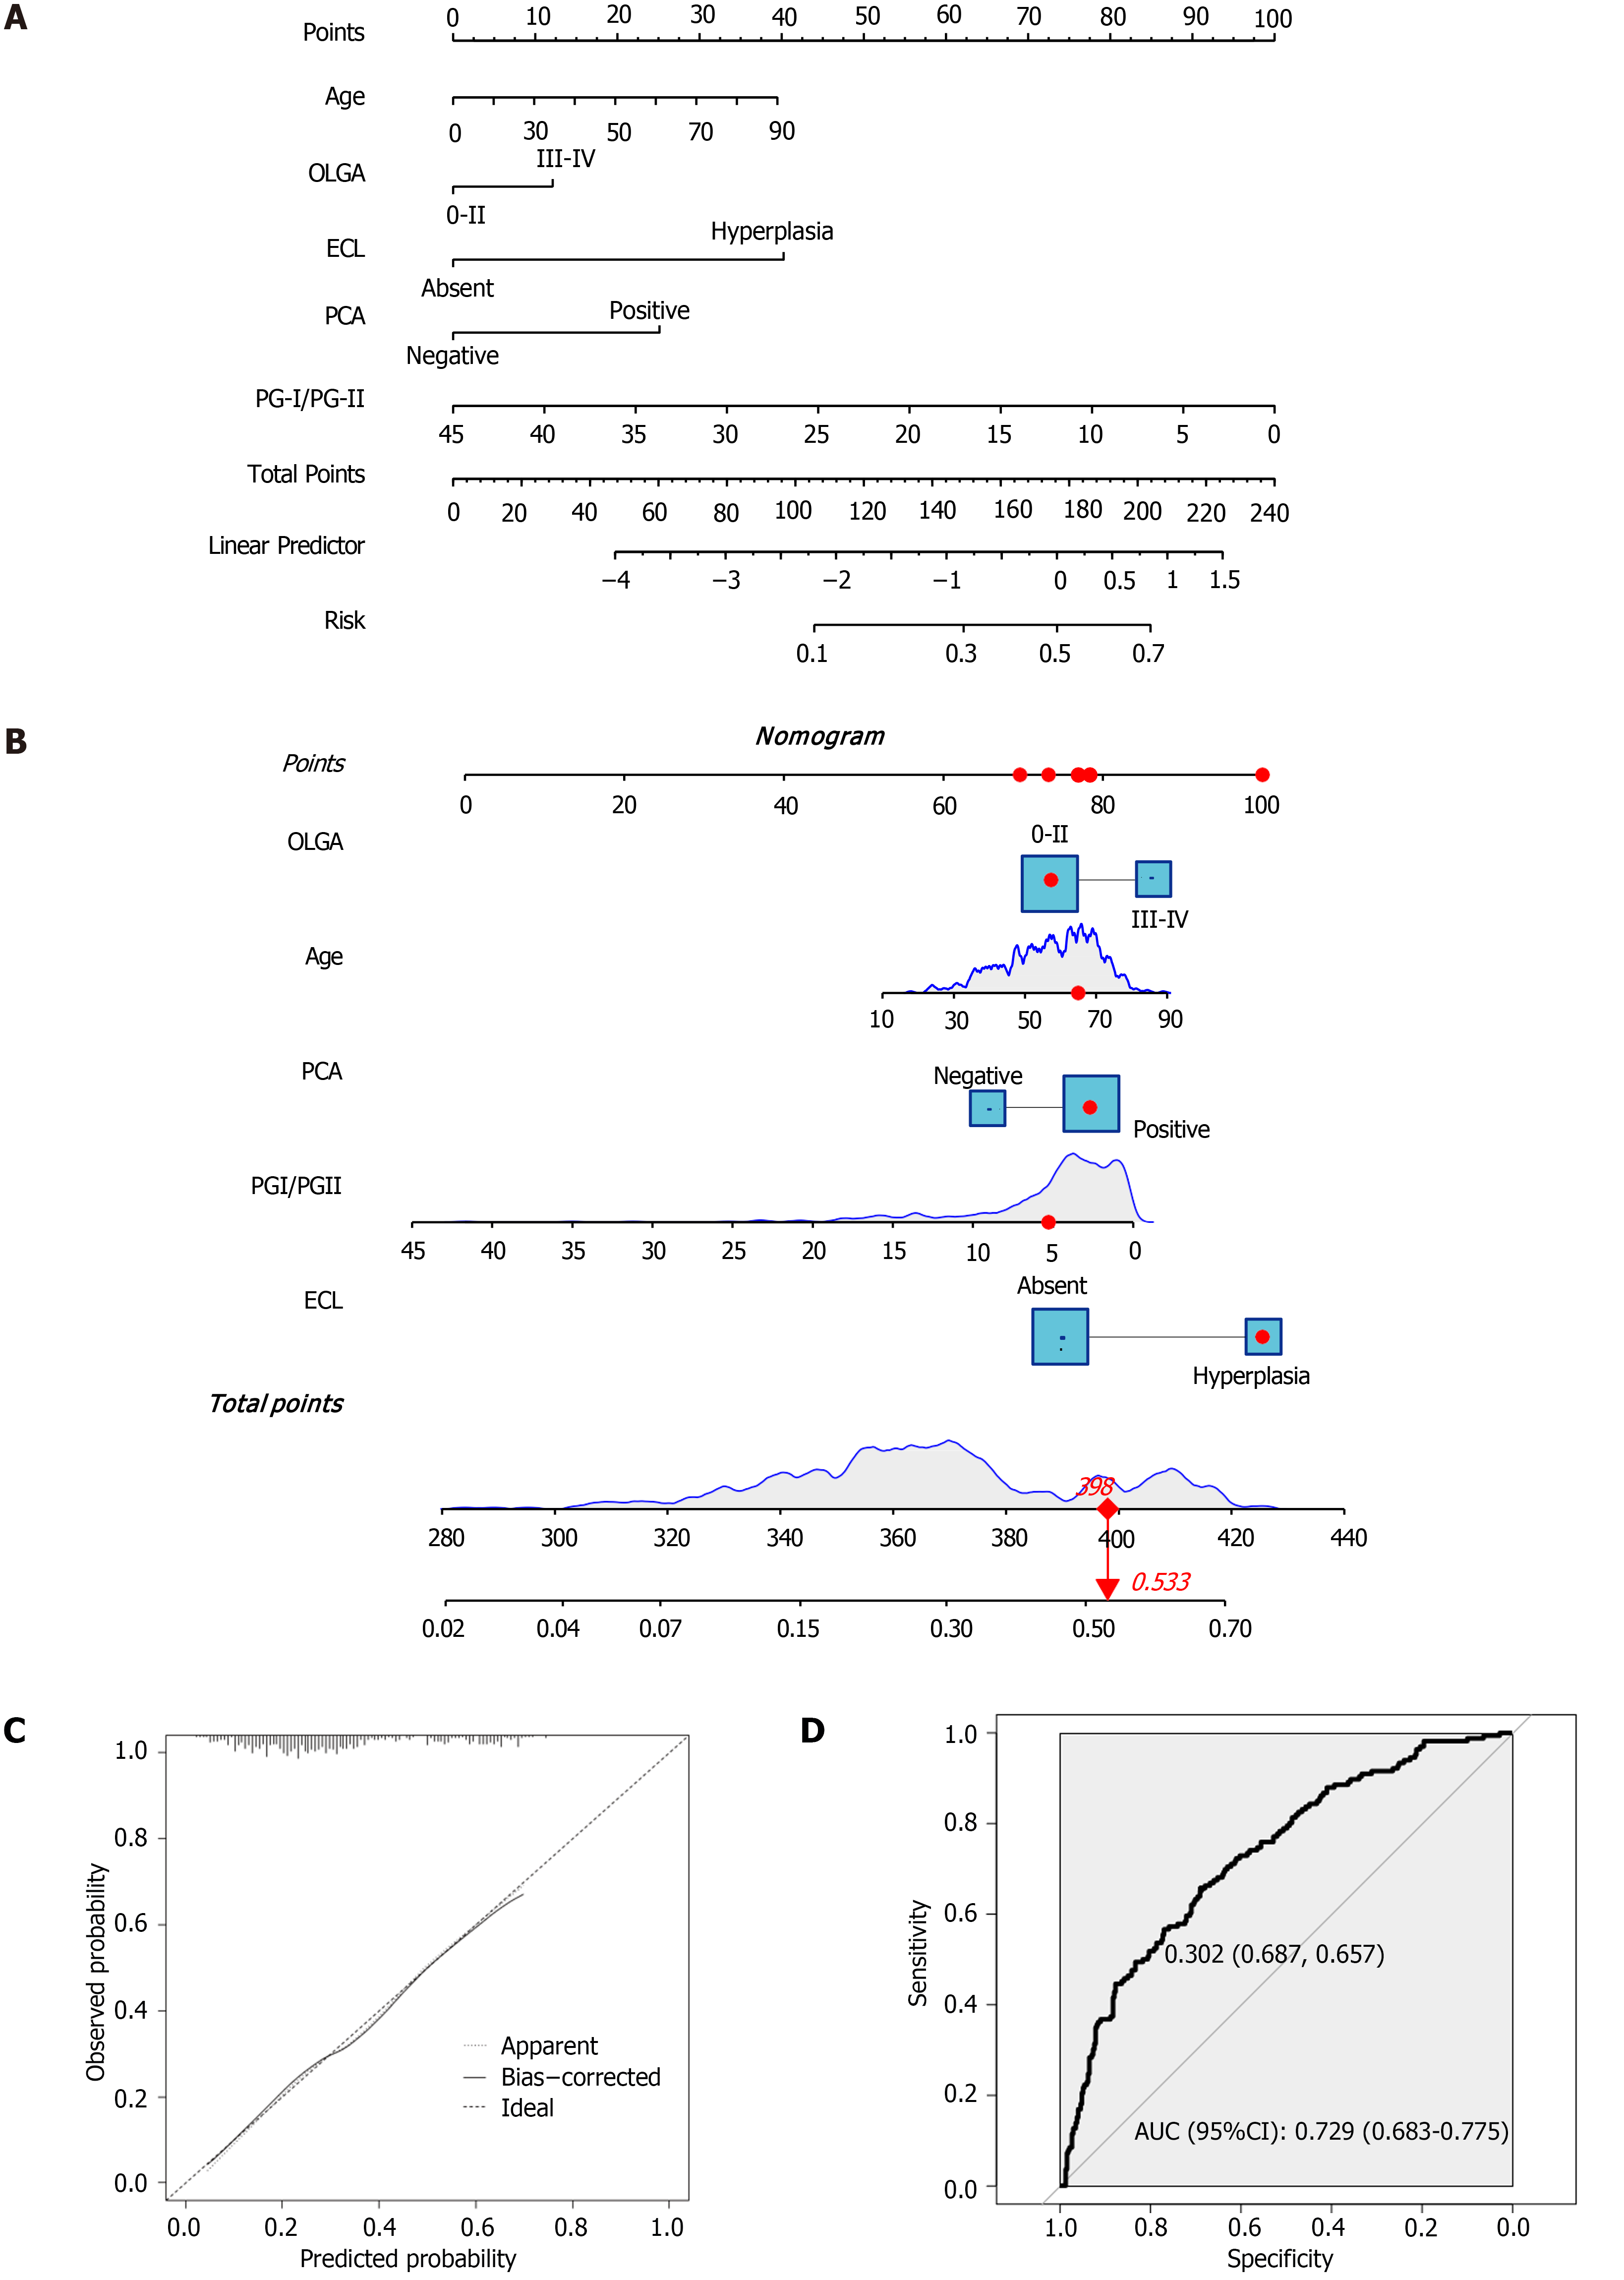
Figure 6 Nomogram, receiver operating characteristic curve, and forest plot depictions.
A: Nomogram; B: An example of the nomogram; C: Calibration curve; D: Receiver operating characteristic curve. OLGA: Operative Link on Gastritis Assessment; ECL: Enterochromaffin-like; PCA: Parietal cell antibody; PG: Pepsinogen; AUC: Area under the receiver operating characteristic curve.
- Citation: Jin JZ, Liang X, Liu SP, Wang RL, Zhang QW, Shen YF, Li XB. Association between autoimmune gastritis and gastric polyps: Clinical characteristics and risk factors. World J Gastrointest Oncol 2025; 17(1): 92908
- URL: https://www.wjgnet.com/1948-5204/full/v17/i1/92908.htm
- DOI: https://dx.doi.org/10.4251/wjgo.v17.i1.92908


