©The Author(s) 2025.
World J Gastrointest Oncol. Jan 15, 2025; 17(1): 100757
Published online Jan 15, 2025. doi: 10.4251/wjgo.v17.i1.100757
Published online Jan 15, 2025. doi: 10.4251/wjgo.v17.i1.100757
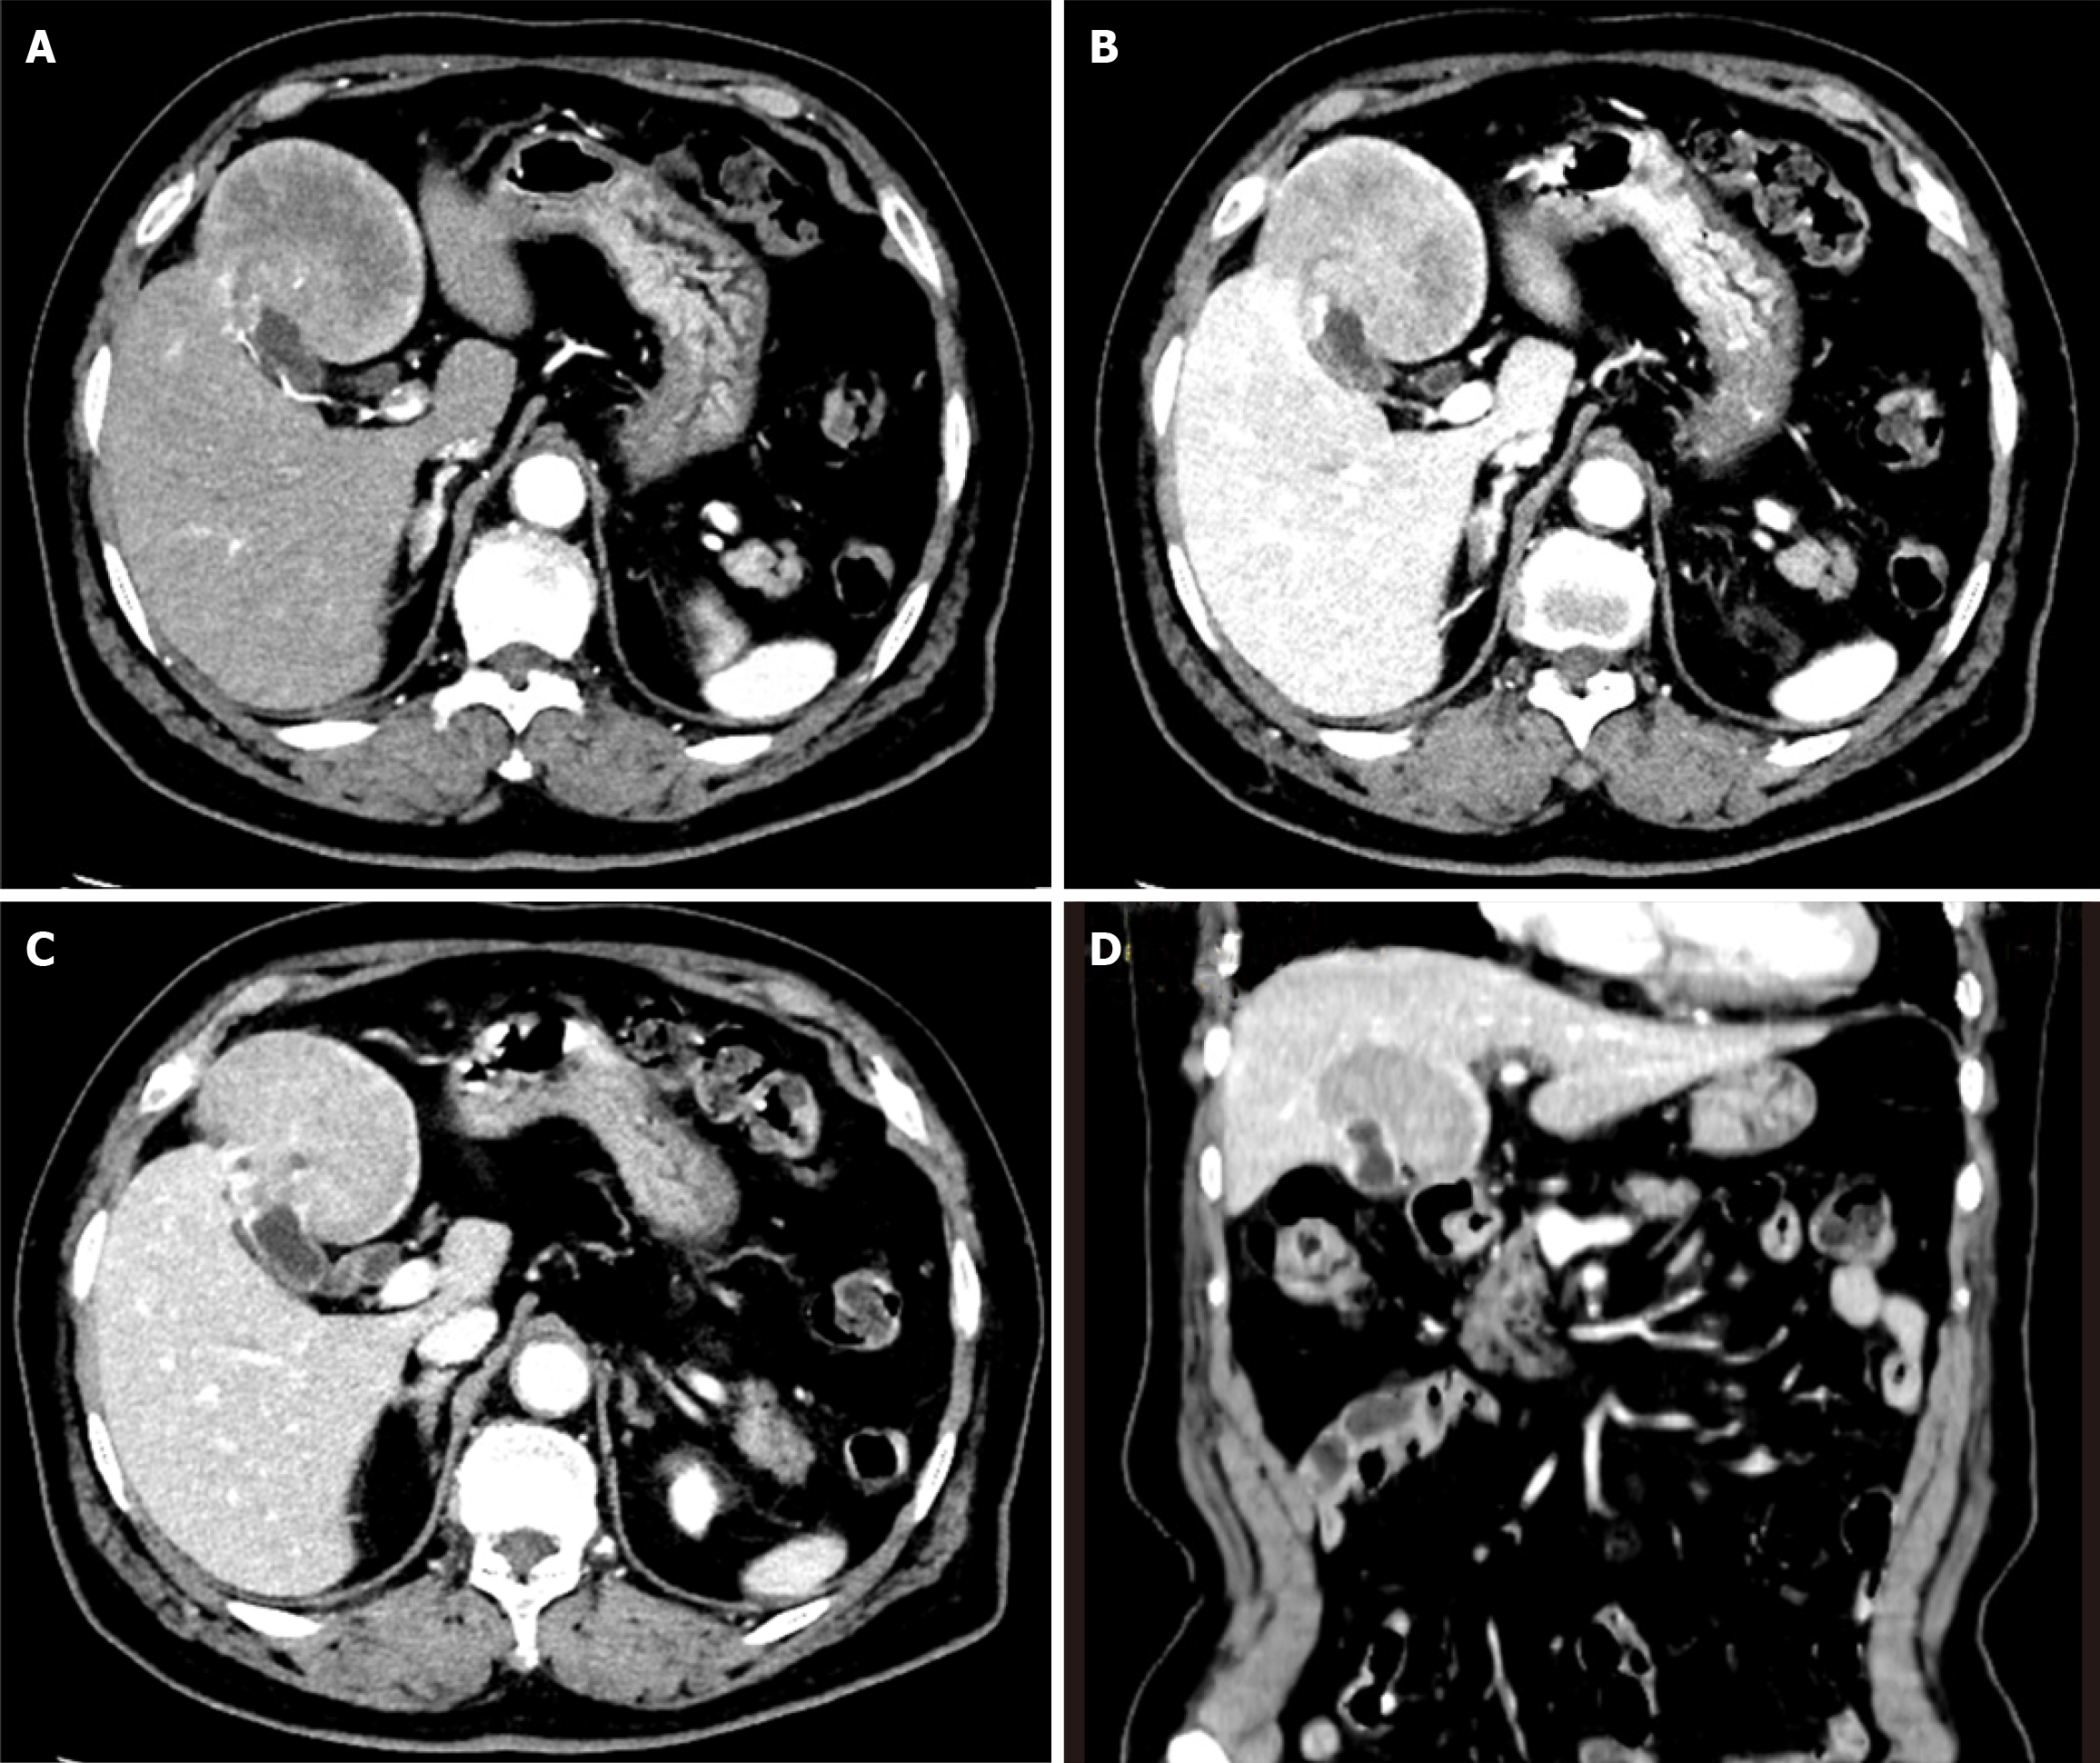
Figure 1 Abdominal contrast-enhanced computed tomography scan reveals a 7 cm mass in liver segments IVb and V, with localized thickening of the gallbladder fundus wall and early-stage enhancement followed by a prolonged contrast effect.
A: Arterial phase showed inhomogeneous lesion enhancement; B: The portal venous phase showed a prolonged contrast effect in the mass; C: The delayed phase showed progressive enhancement of the mass; D: The mass invades liver segments IVb and V.
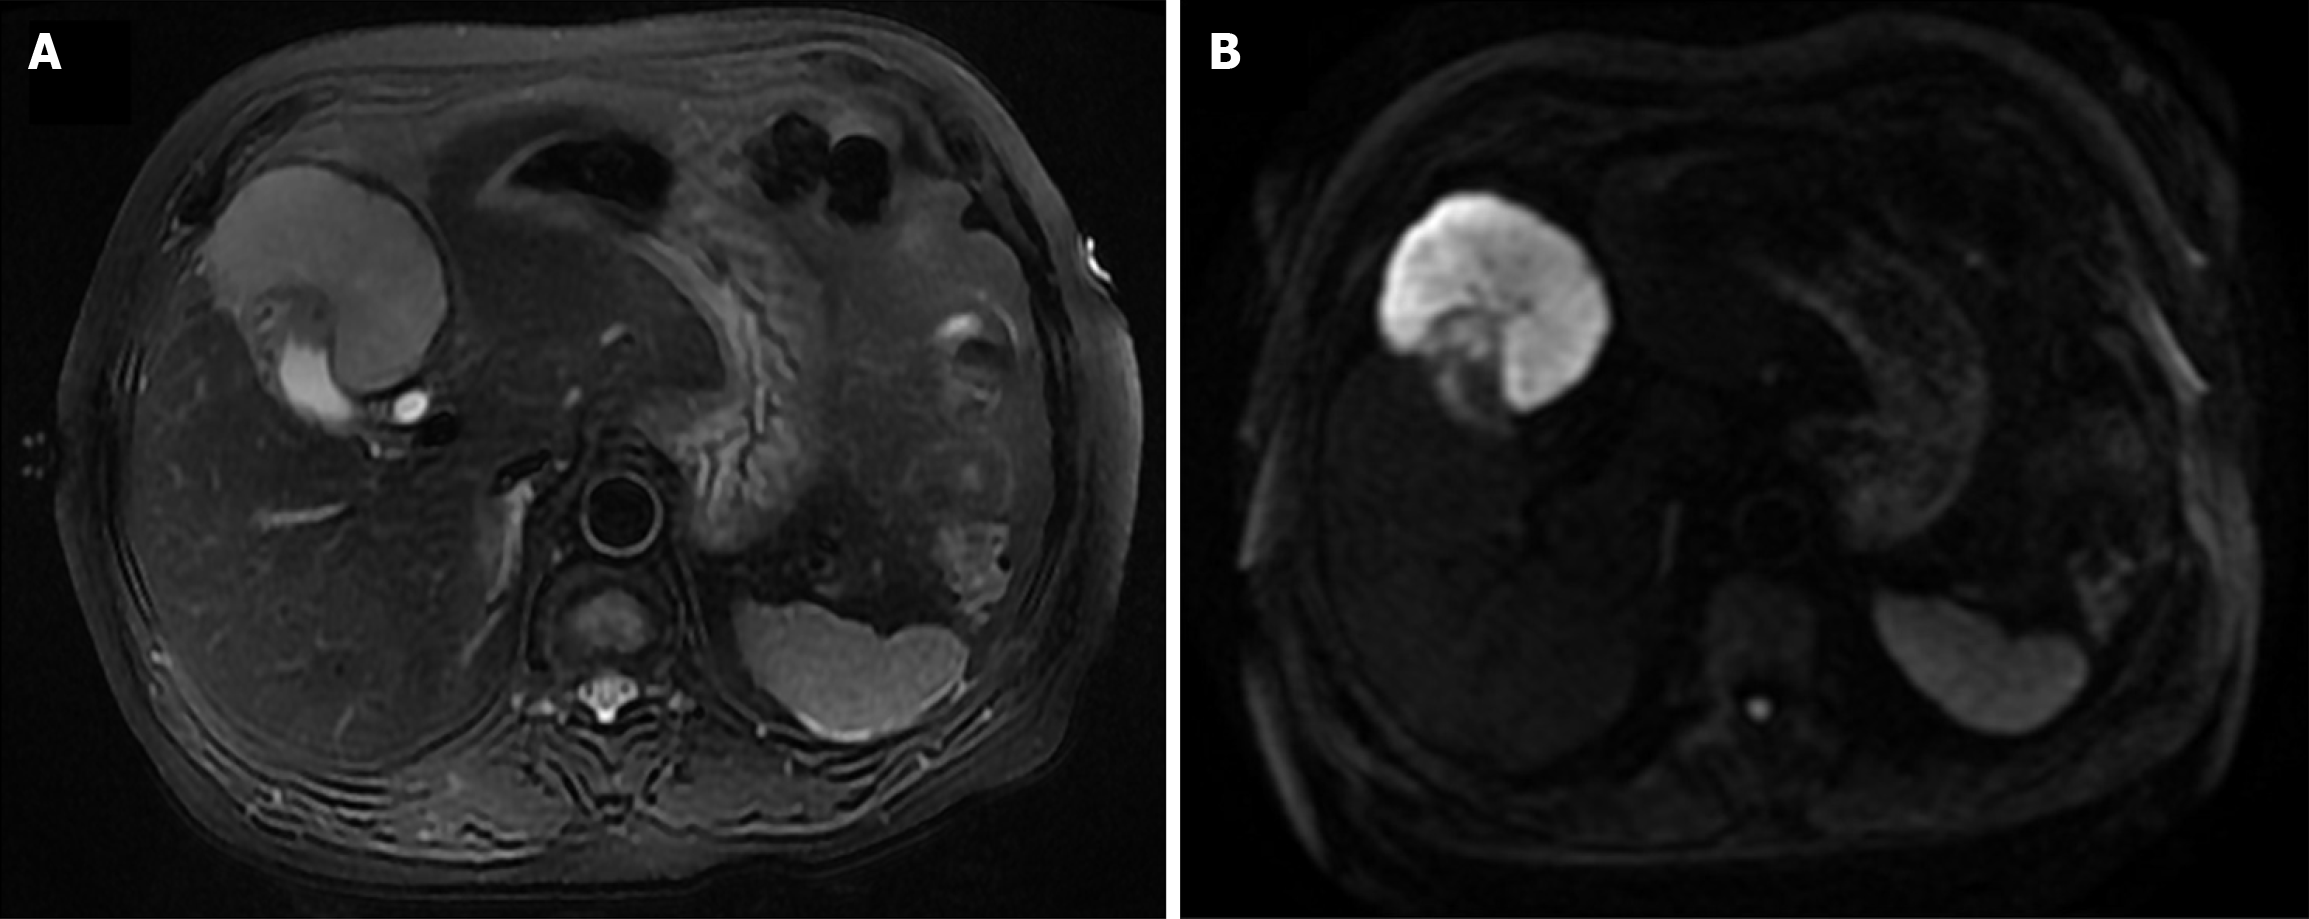
Figure 2 Preoperative magnetic resonance imaging examination of the reported case.
A and B: The gallbladder lesion appears slightly hyperintense on T2-weighted imaging (A) and hyperintense on diffusion-weighted imaging (B).
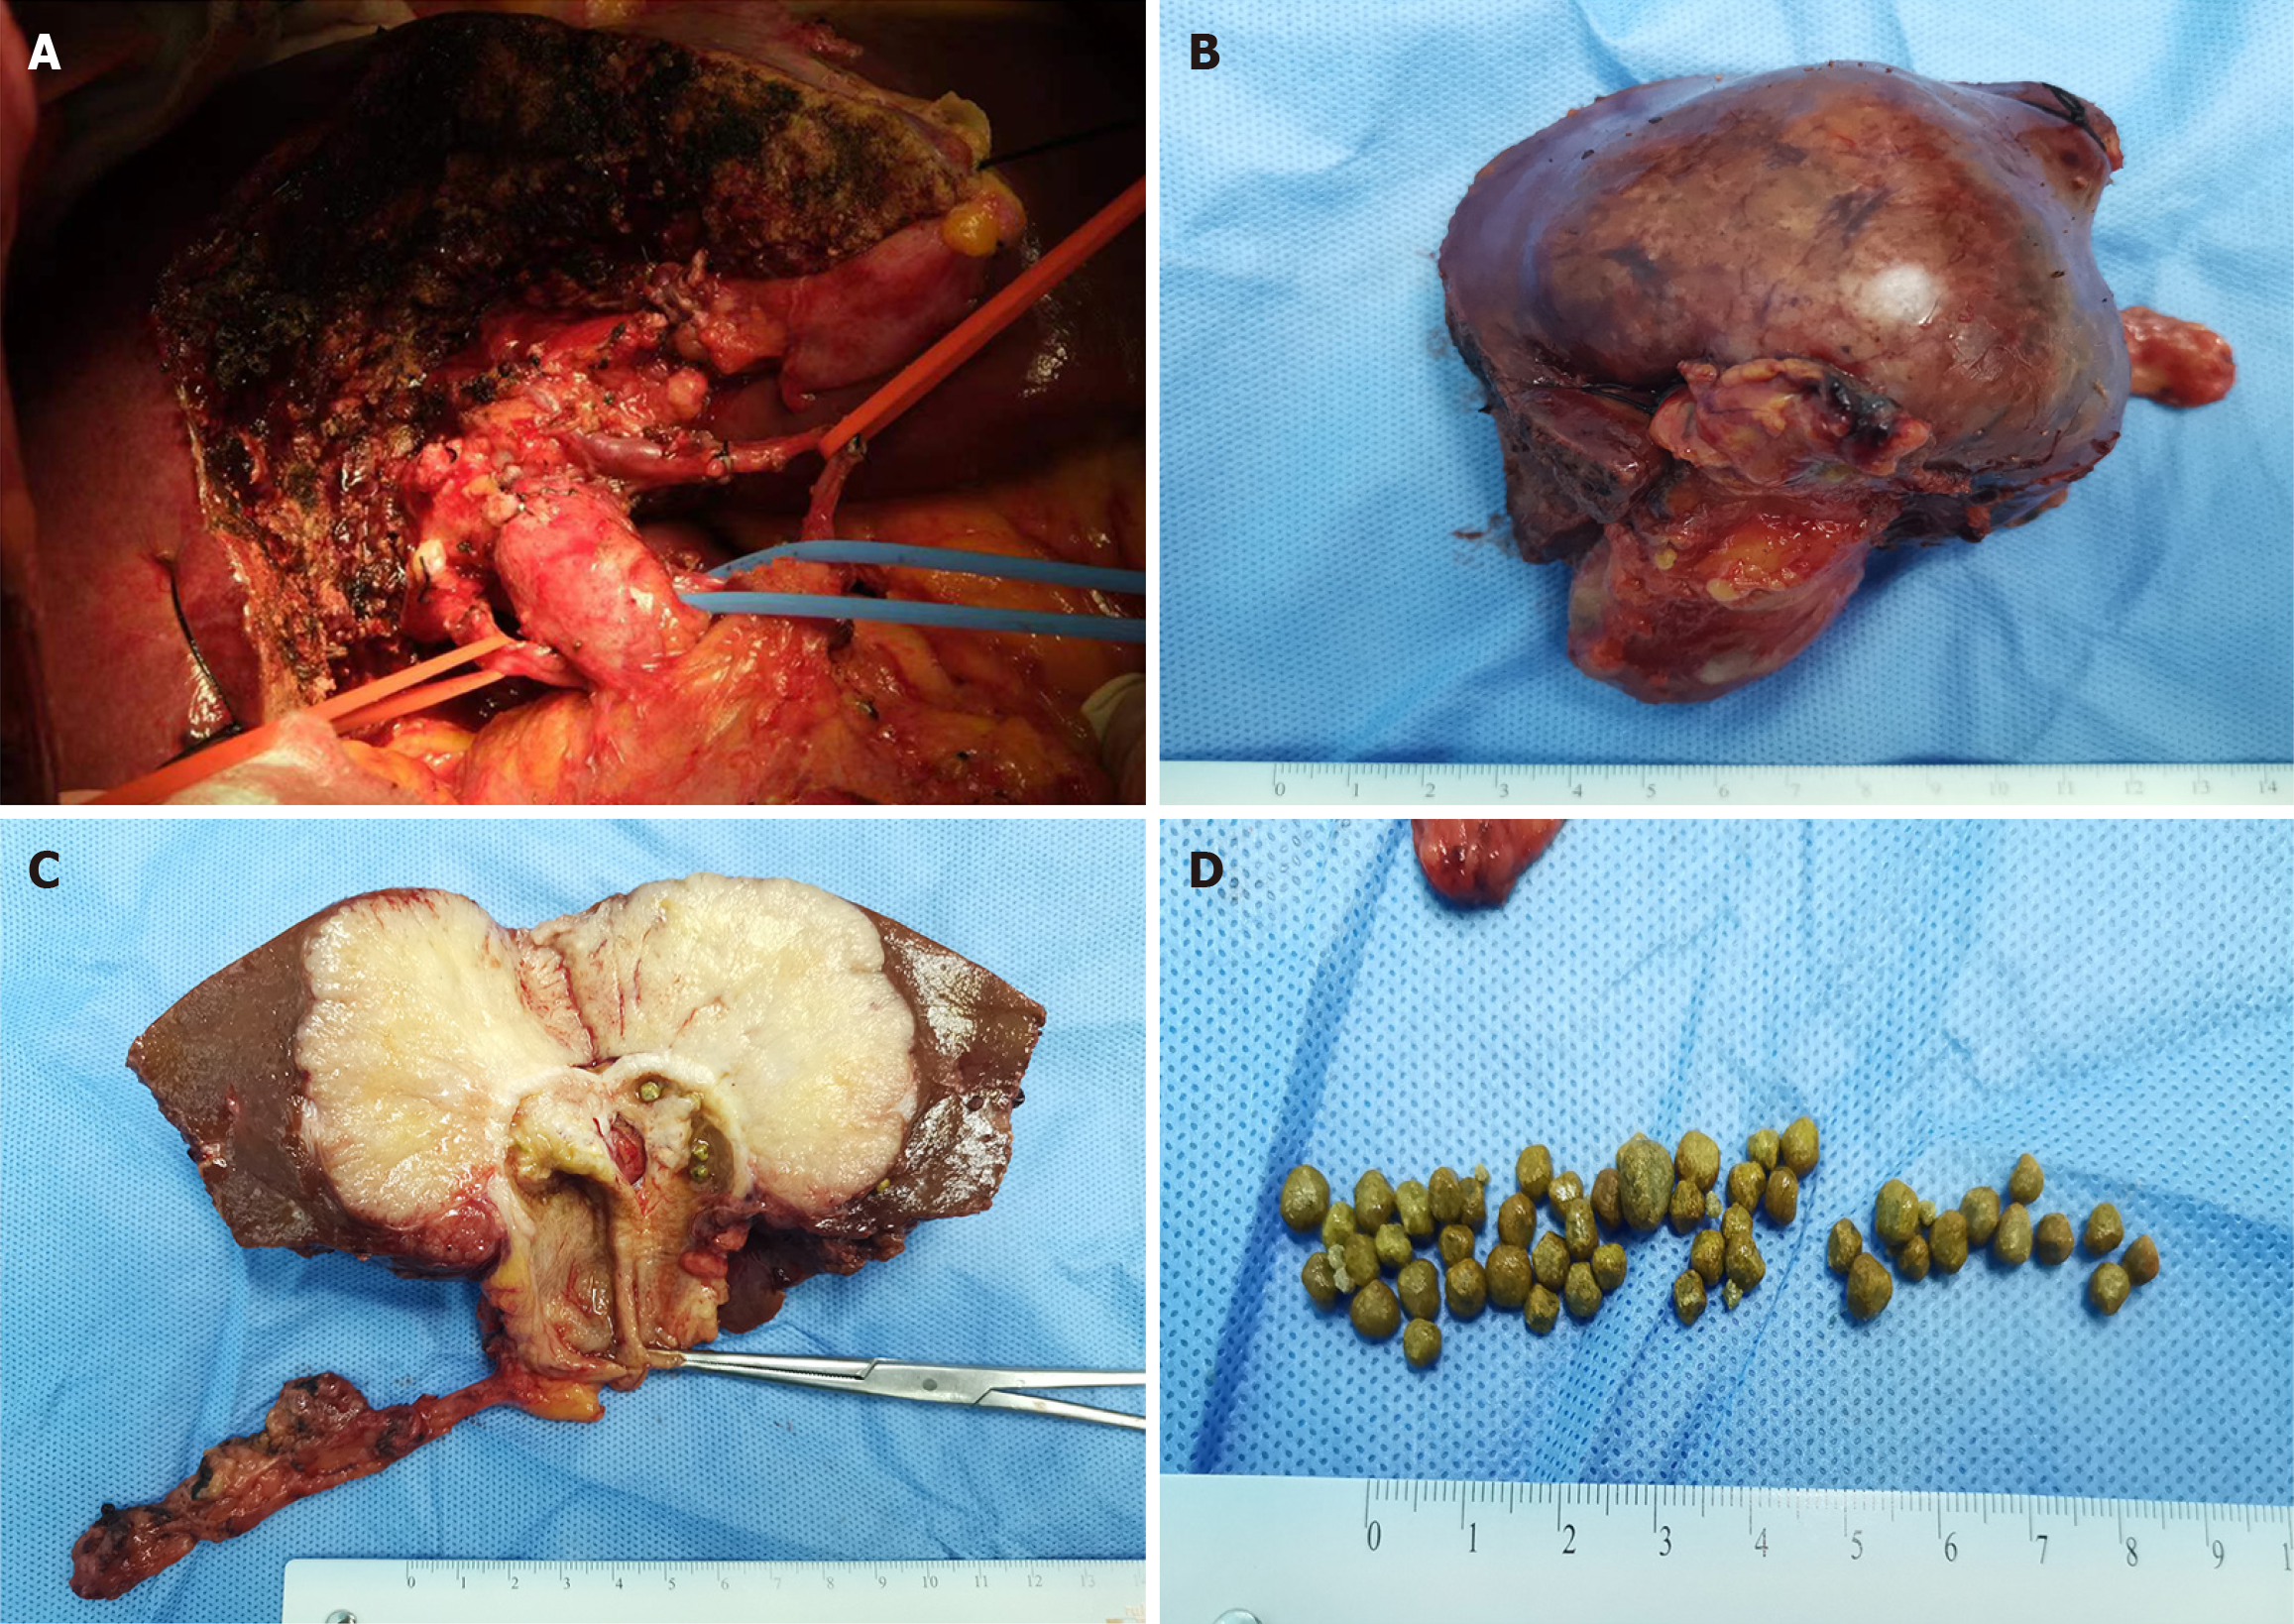
Figure 3 Illustration of the surgical procedure.
A: A radical cholecystectomy was performed; B: The gross tumor specimen was displayed; C: Macroscopic analysis revealed a greyish-yellow globular lesion; D: Multiple yellowish stones were identified.
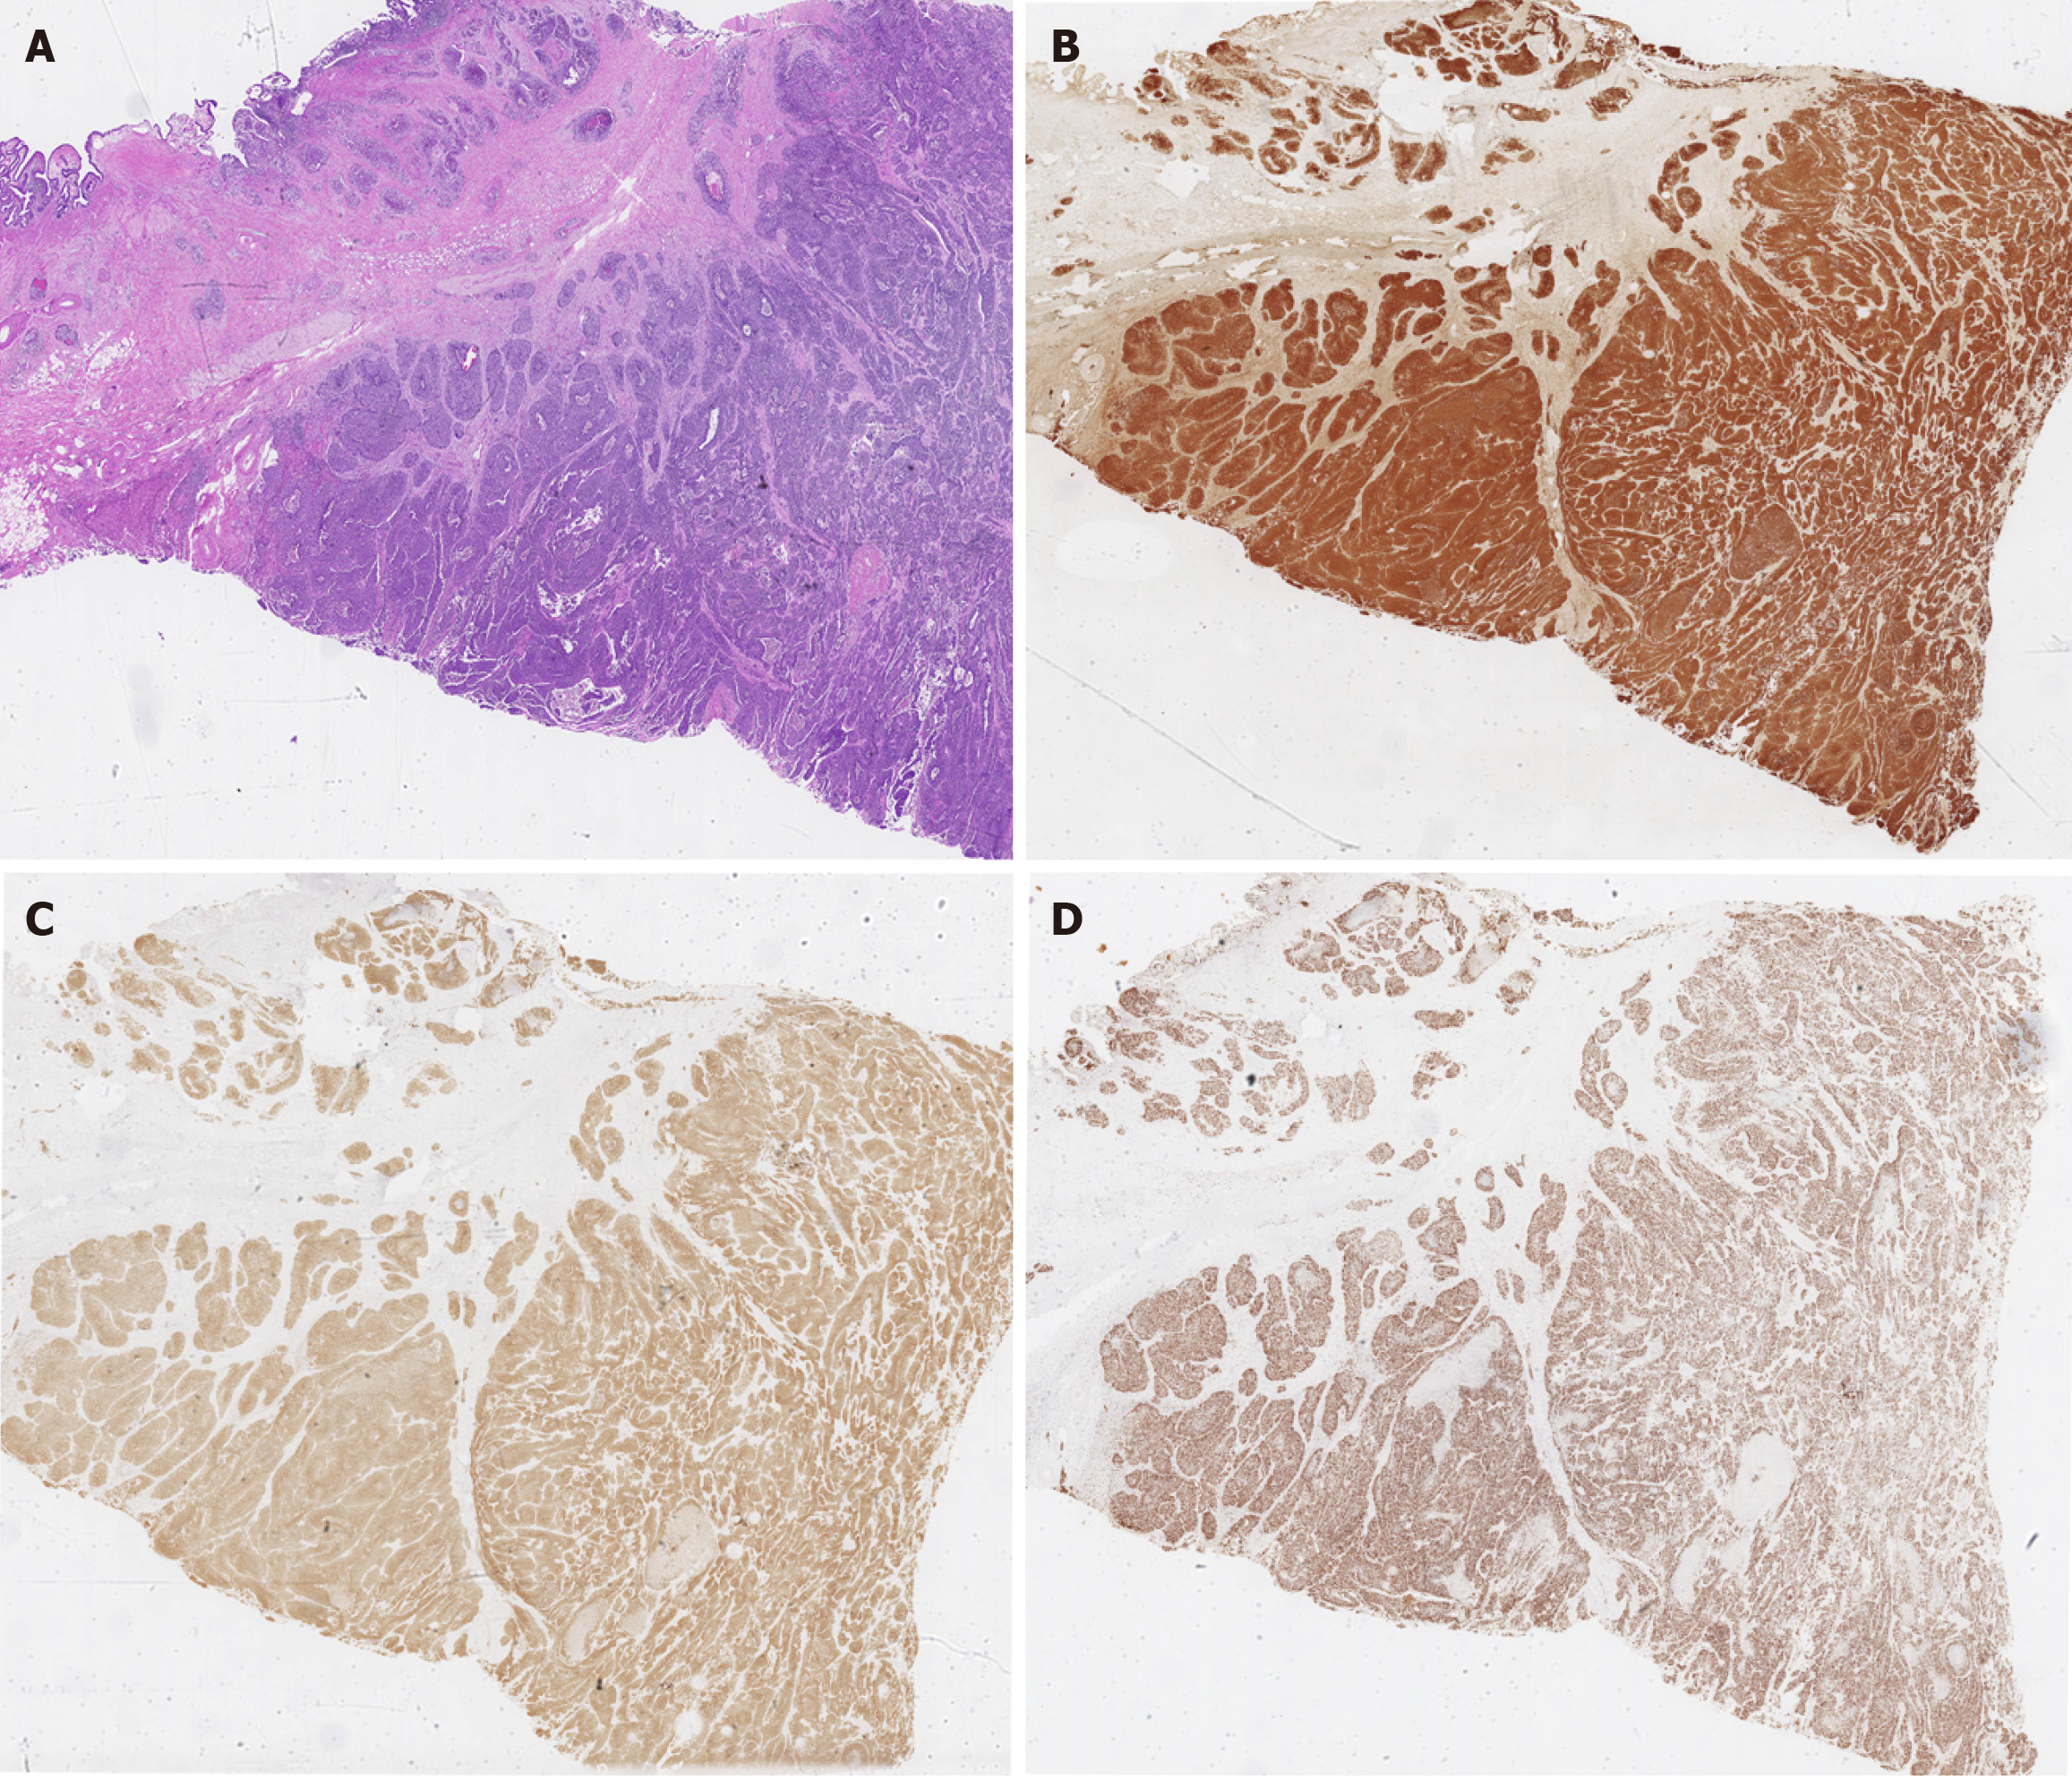
Figure 4 Pathological analysis results.
A: Hematoxylin and eosin staining revealed a nest-like arrangement of tumor cells exhibiting marked cellular heterogeneity and visible necrosis; B–D: Immunohistochemical analyses showed positivity for chromogranin A, Ki-67, and synaptophysin, respectively.
Figure 5 PD-L1 and tumor mutation burden.
A and B: Targeted gene sequencing revealed no expression of PD-L1 in gallbladder neuroendocrine carcinoma cells; C and D: Buffer solutions and isotype-matched monoclonal antibodies were used as controls to confirm the specificity of primary antibody binding; E: Targeted gene sequencing also helped quantify the tumor mutation burden. TMB: Tumor mutation burden.
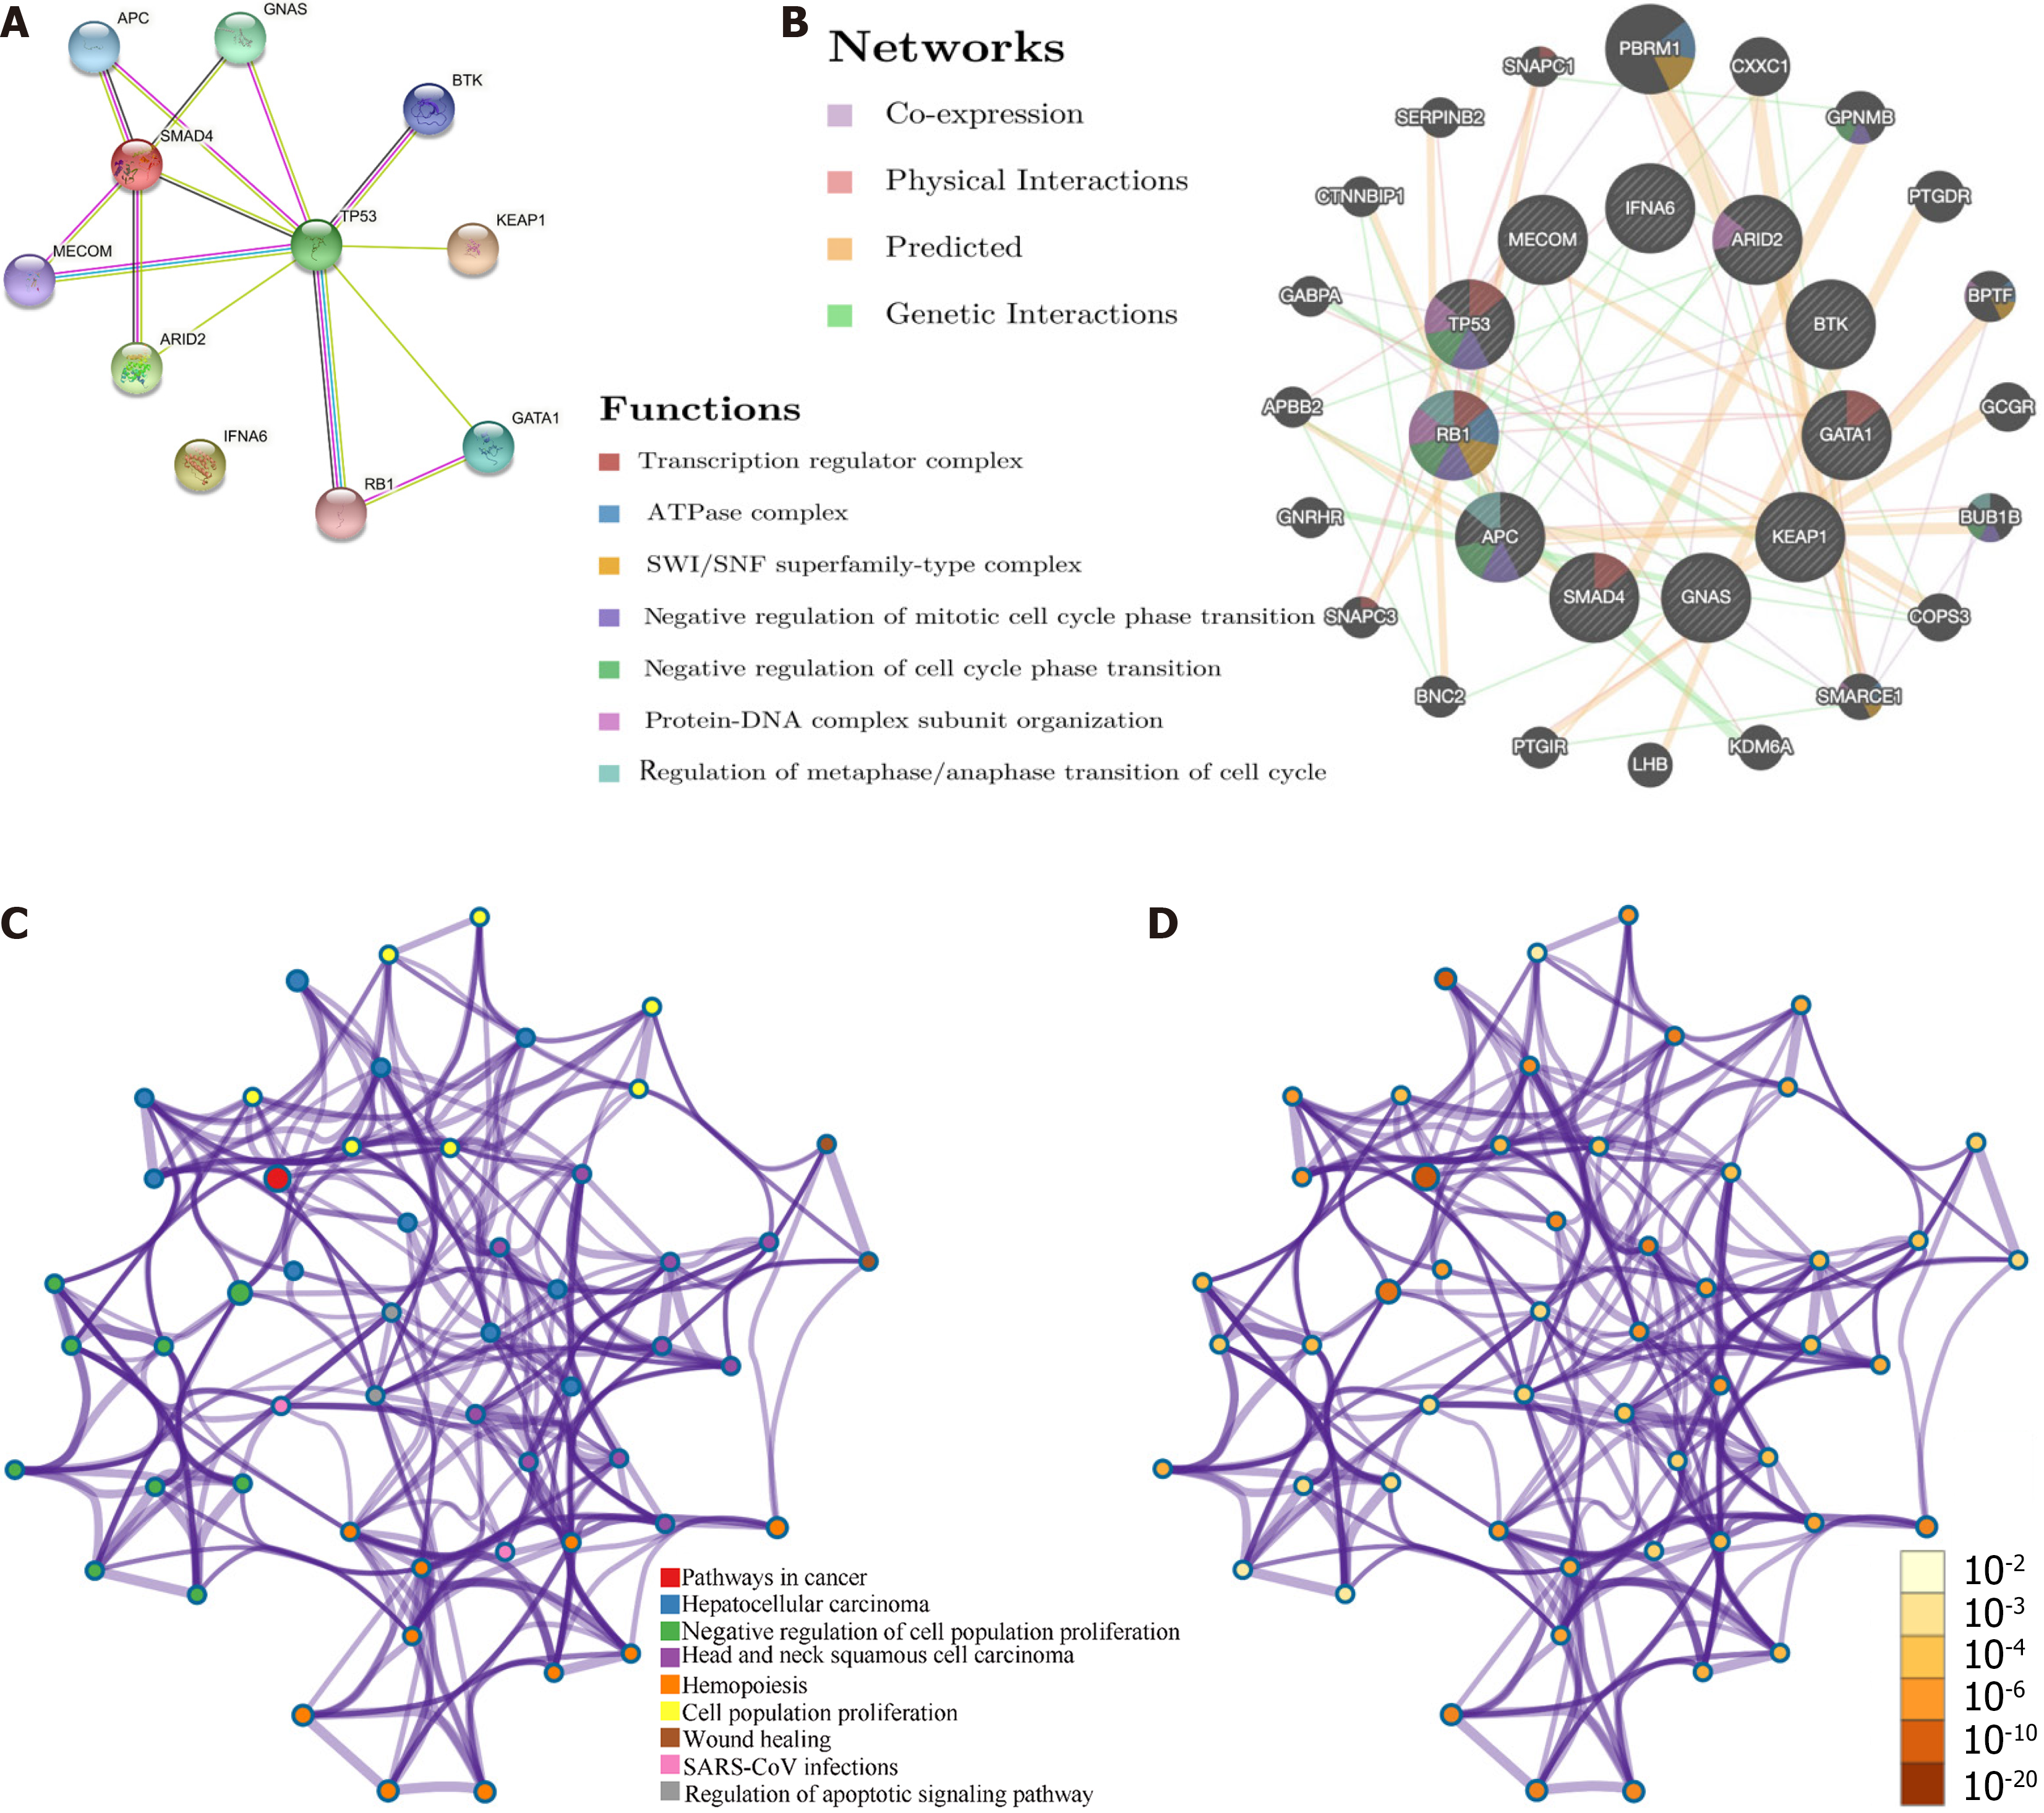
Figure 6 Interaction network analyses.
A and B: The protein-protein interaction network was constructed using 12 mutated genes; C and D: Protein-protein interaction enrichment analysis was performed to explore functional relationships between these 12 mutated genes.
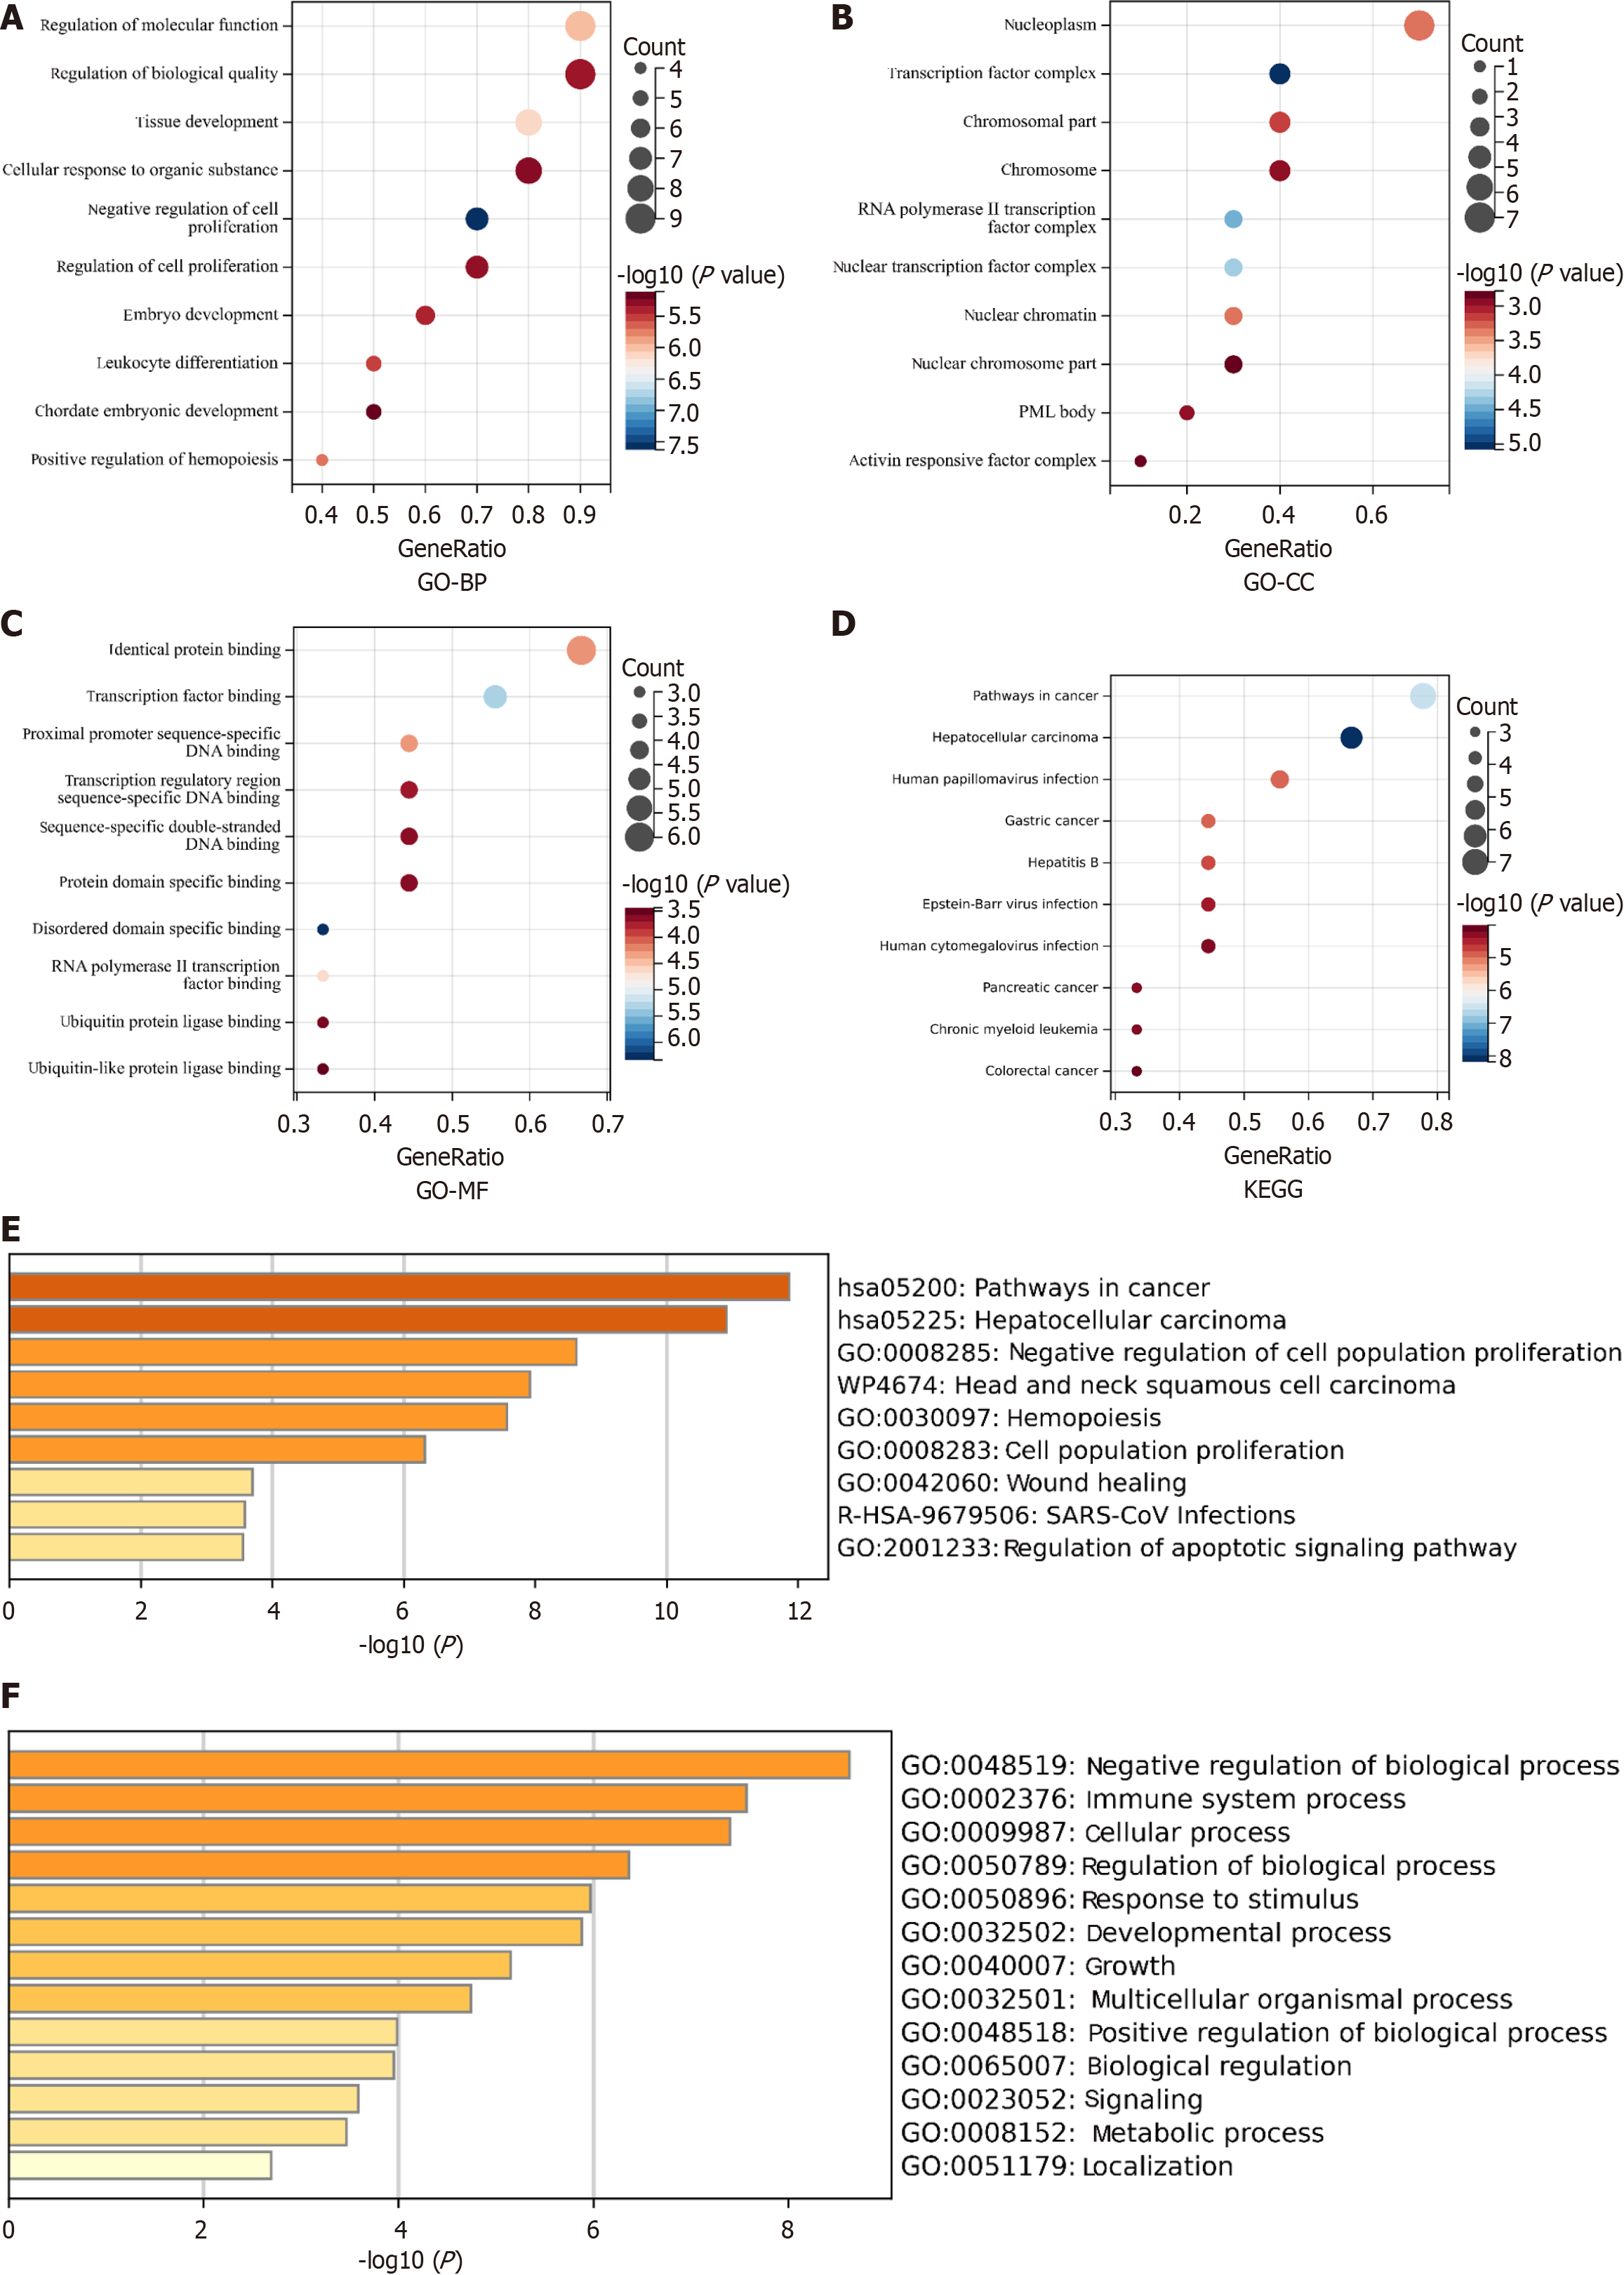
Figure 7 Significantly enriched Gene Ontology terms and Kyoto Encyclopedia of Genes and Genomes pathways for mutated genes.
A-D: Gene Ontology analysis of biological processes (A), cellular components (B), molecular function (C), and Kyoto Encyclopedia of Genes and Genomes enrichment analysis (D); E and F: The Metascape database yielded similar results for the mutated genes. GO: Gene Ontology; BP: Biological processes; CC: Cellular components; MF: Molecular function; KEGG: Kyoto Encyclopedia of Genes and Genomes.
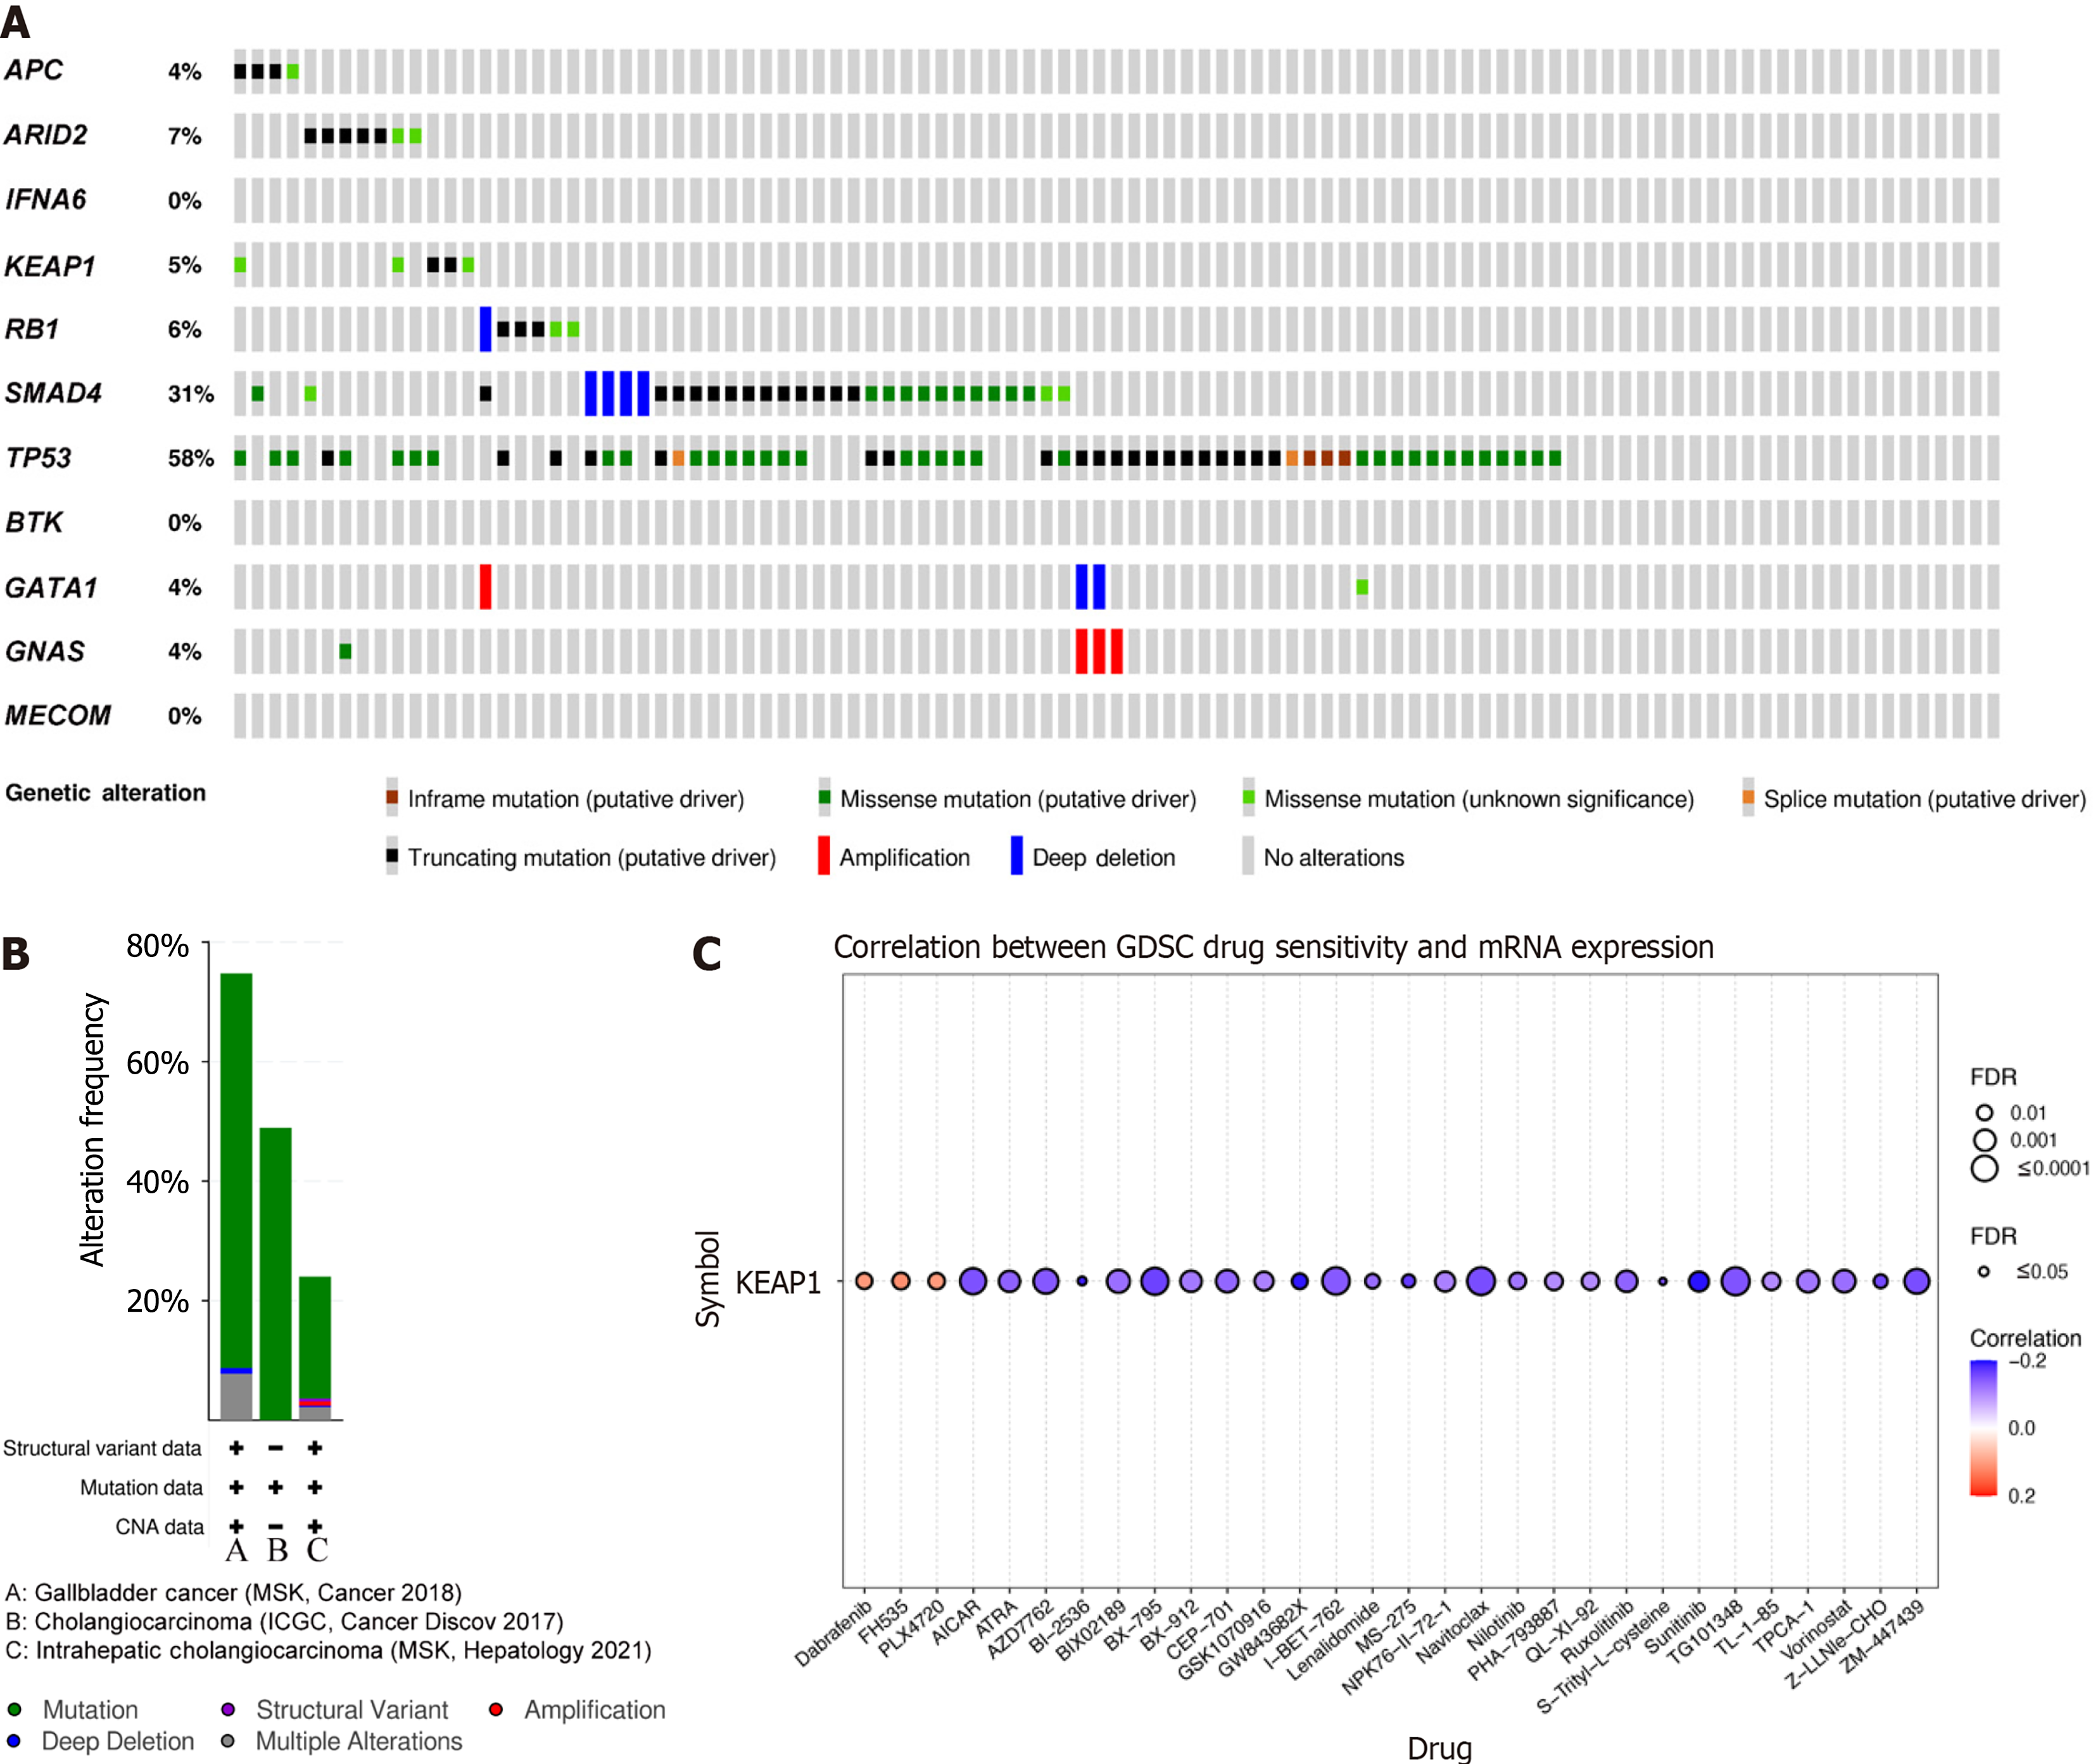
Figure 8 Gene mutations in gallbladder carcinomas.
A: A summary of alterations in the 12 queried gene mutations from the cBioPortal database; B: Detailed summary of alterations in the 12 mutated genes; C: The correlation between KEAP1 expression and the sensitivity to GDSC drugs (top 30) in pan-cancer analysis.
- Citation: Yang YC, Chen ZT, Wan DL, Tang H, Liu ML. Targeted gene sequencing and bioinformatics analysis of patients with gallbladder neuroendocrine carcinoma: A case report. World J Gastrointest Oncol 2025; 17(1): 100757
- URL: https://www.wjgnet.com/1948-5204/full/v17/i1/100757.htm
- DOI: https://dx.doi.org/10.4251/wjgo.v17.i1.100757


