©The Author(s) 2024.
World J Gastrointest Oncol. Sep 15, 2024; 16(9): 3798-3819
Published online Sep 15, 2024. doi: 10.4251/wjgo.v16.i9.3798
Published online Sep 15, 2024. doi: 10.4251/wjgo.v16.i9.3798
Figure 1 Glycyrrhiza uralensis Fisch.
A: Living plants; B: Image of the dried root from which the raw drug is obtained.
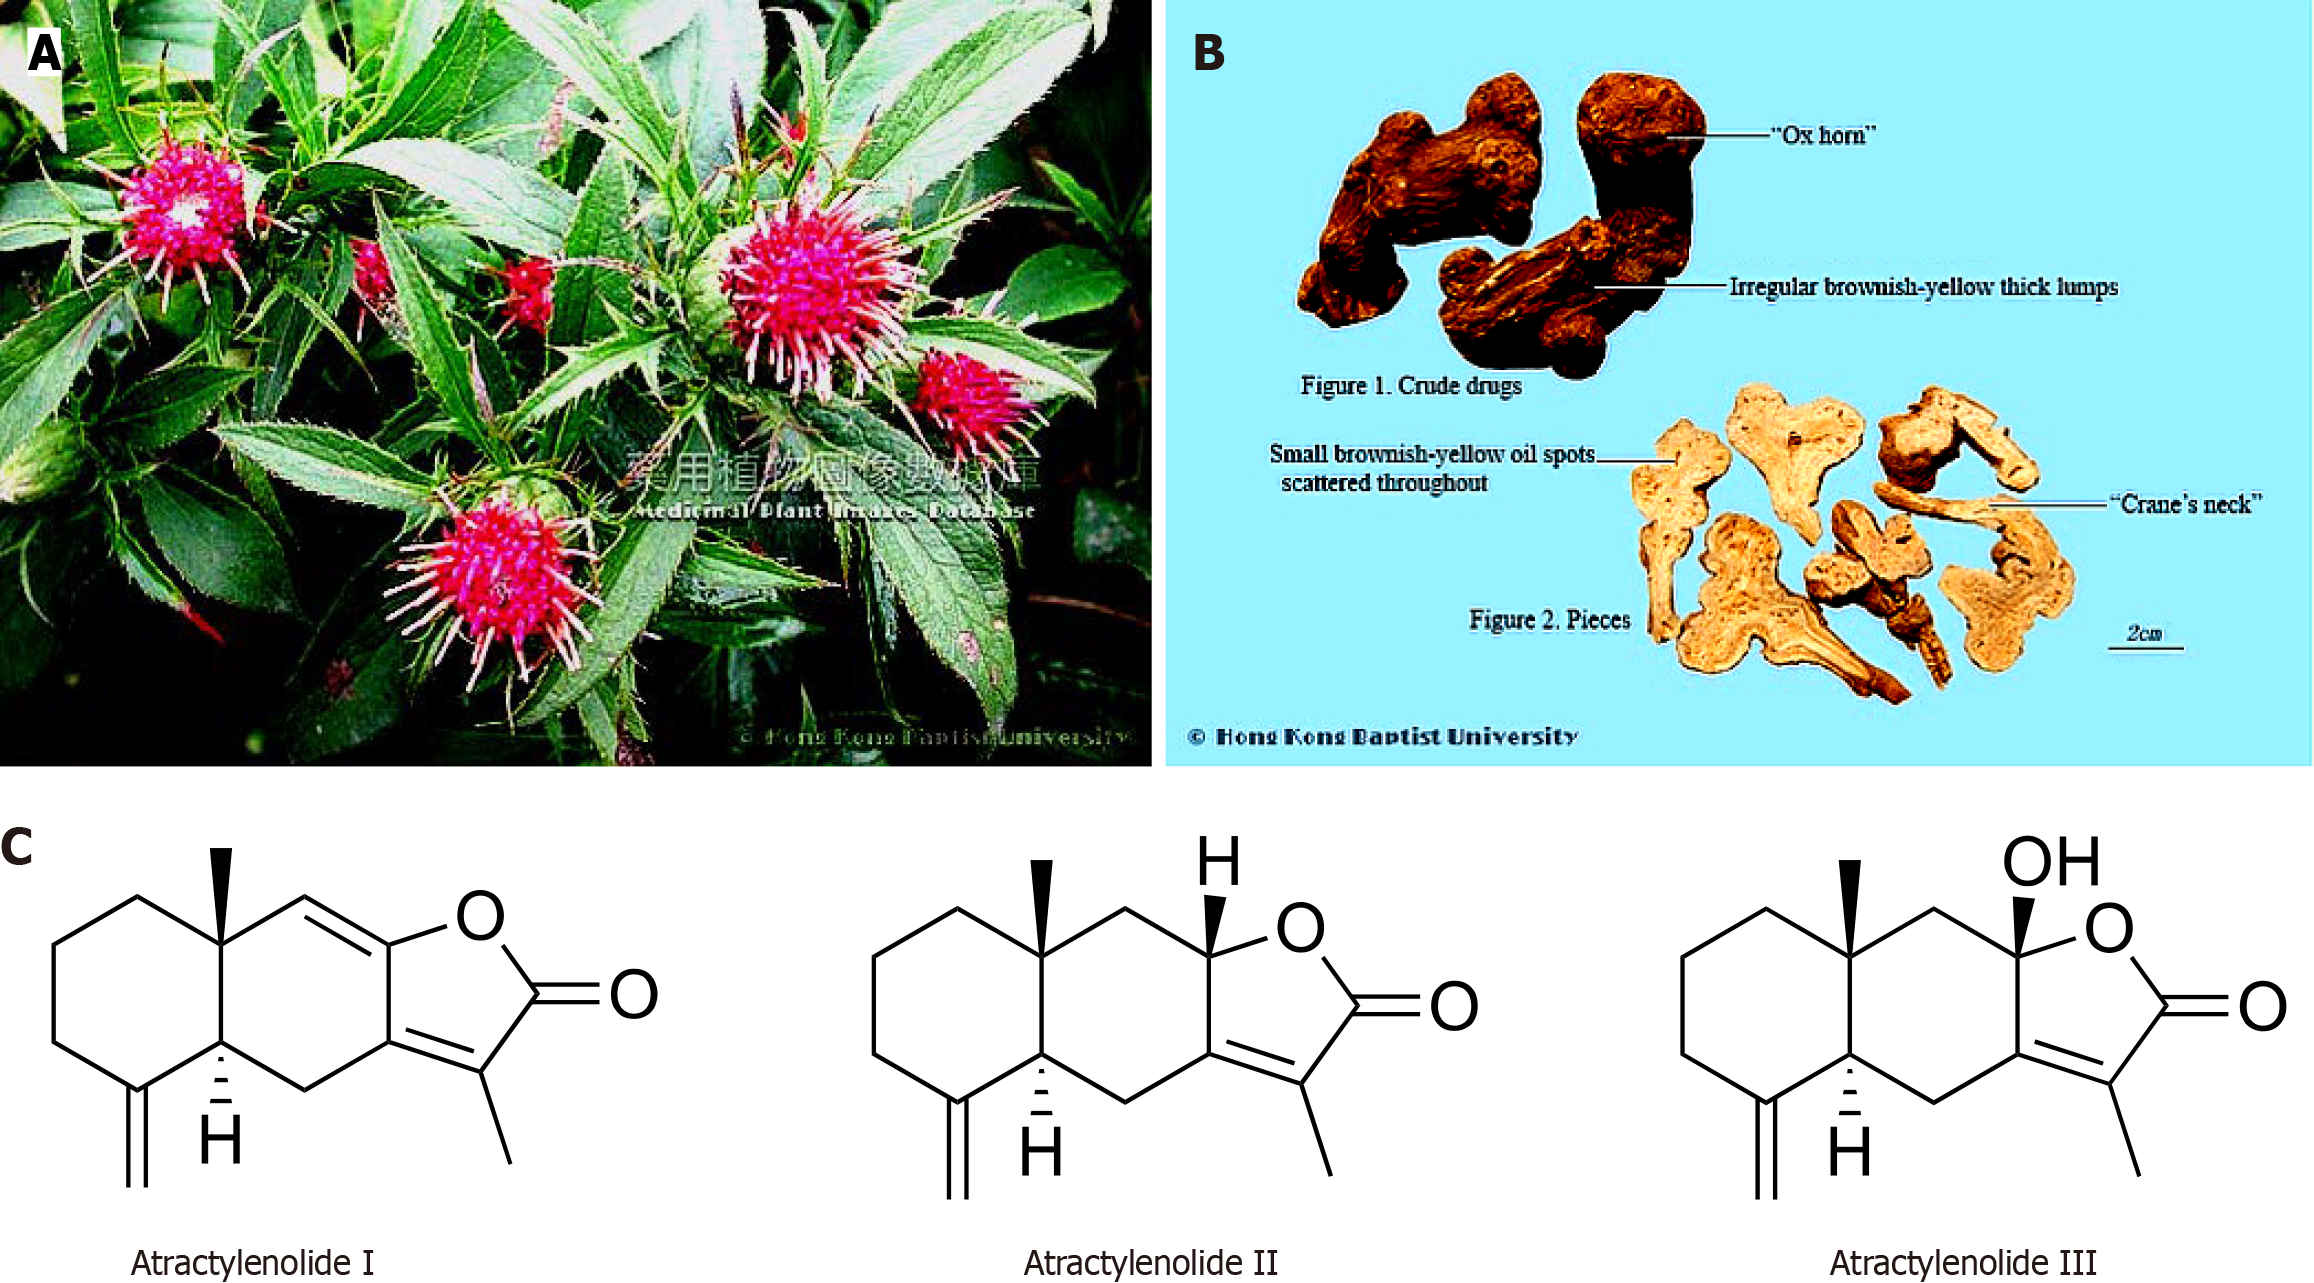
Figure 2 Atractylodes macrocephala Koidz.
A: Whole plants; B: Image of the root from which the crude drug is obtained; C: Main phytochemicals.
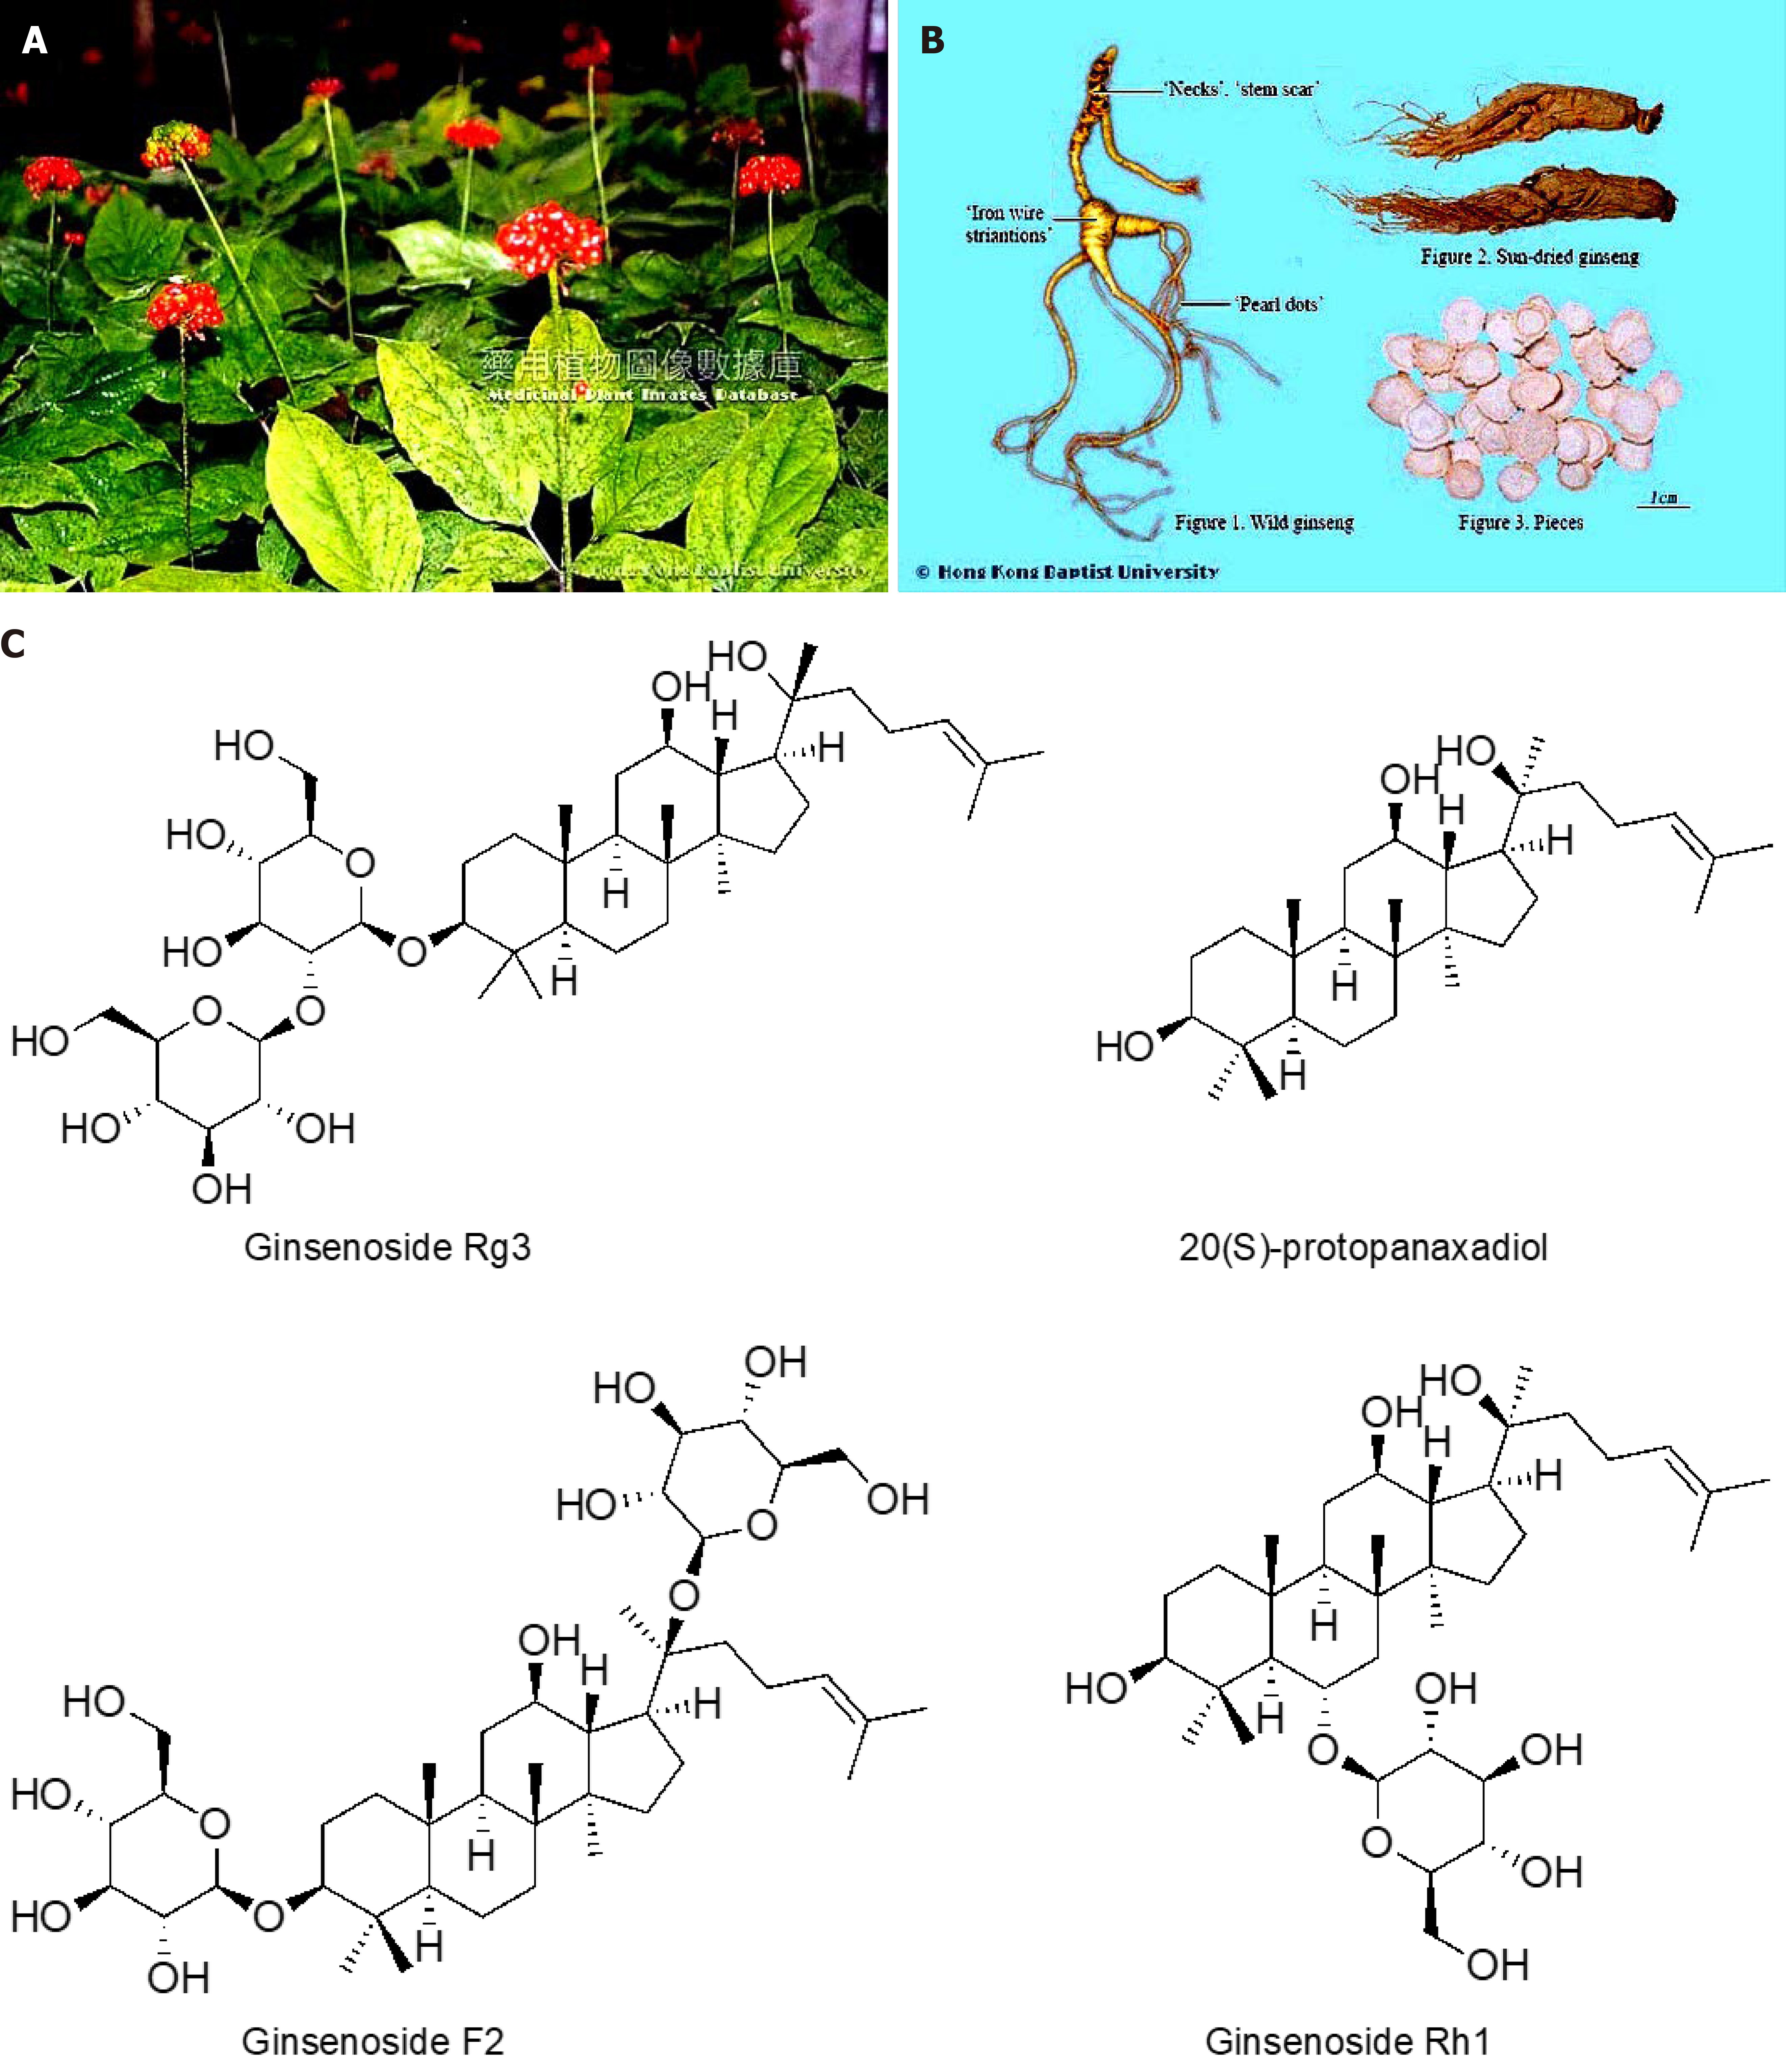
Figure 3 Panax ginseng C.
A. Mey. A: Whole plants; B: Image of the root from which the crude drug is obtained; C: Main phytochemicals.
Figure 4 Poria cocos F.
A. Wolf. A: Image of the root from which the crude drug is obtained; B: Pachymic acid.
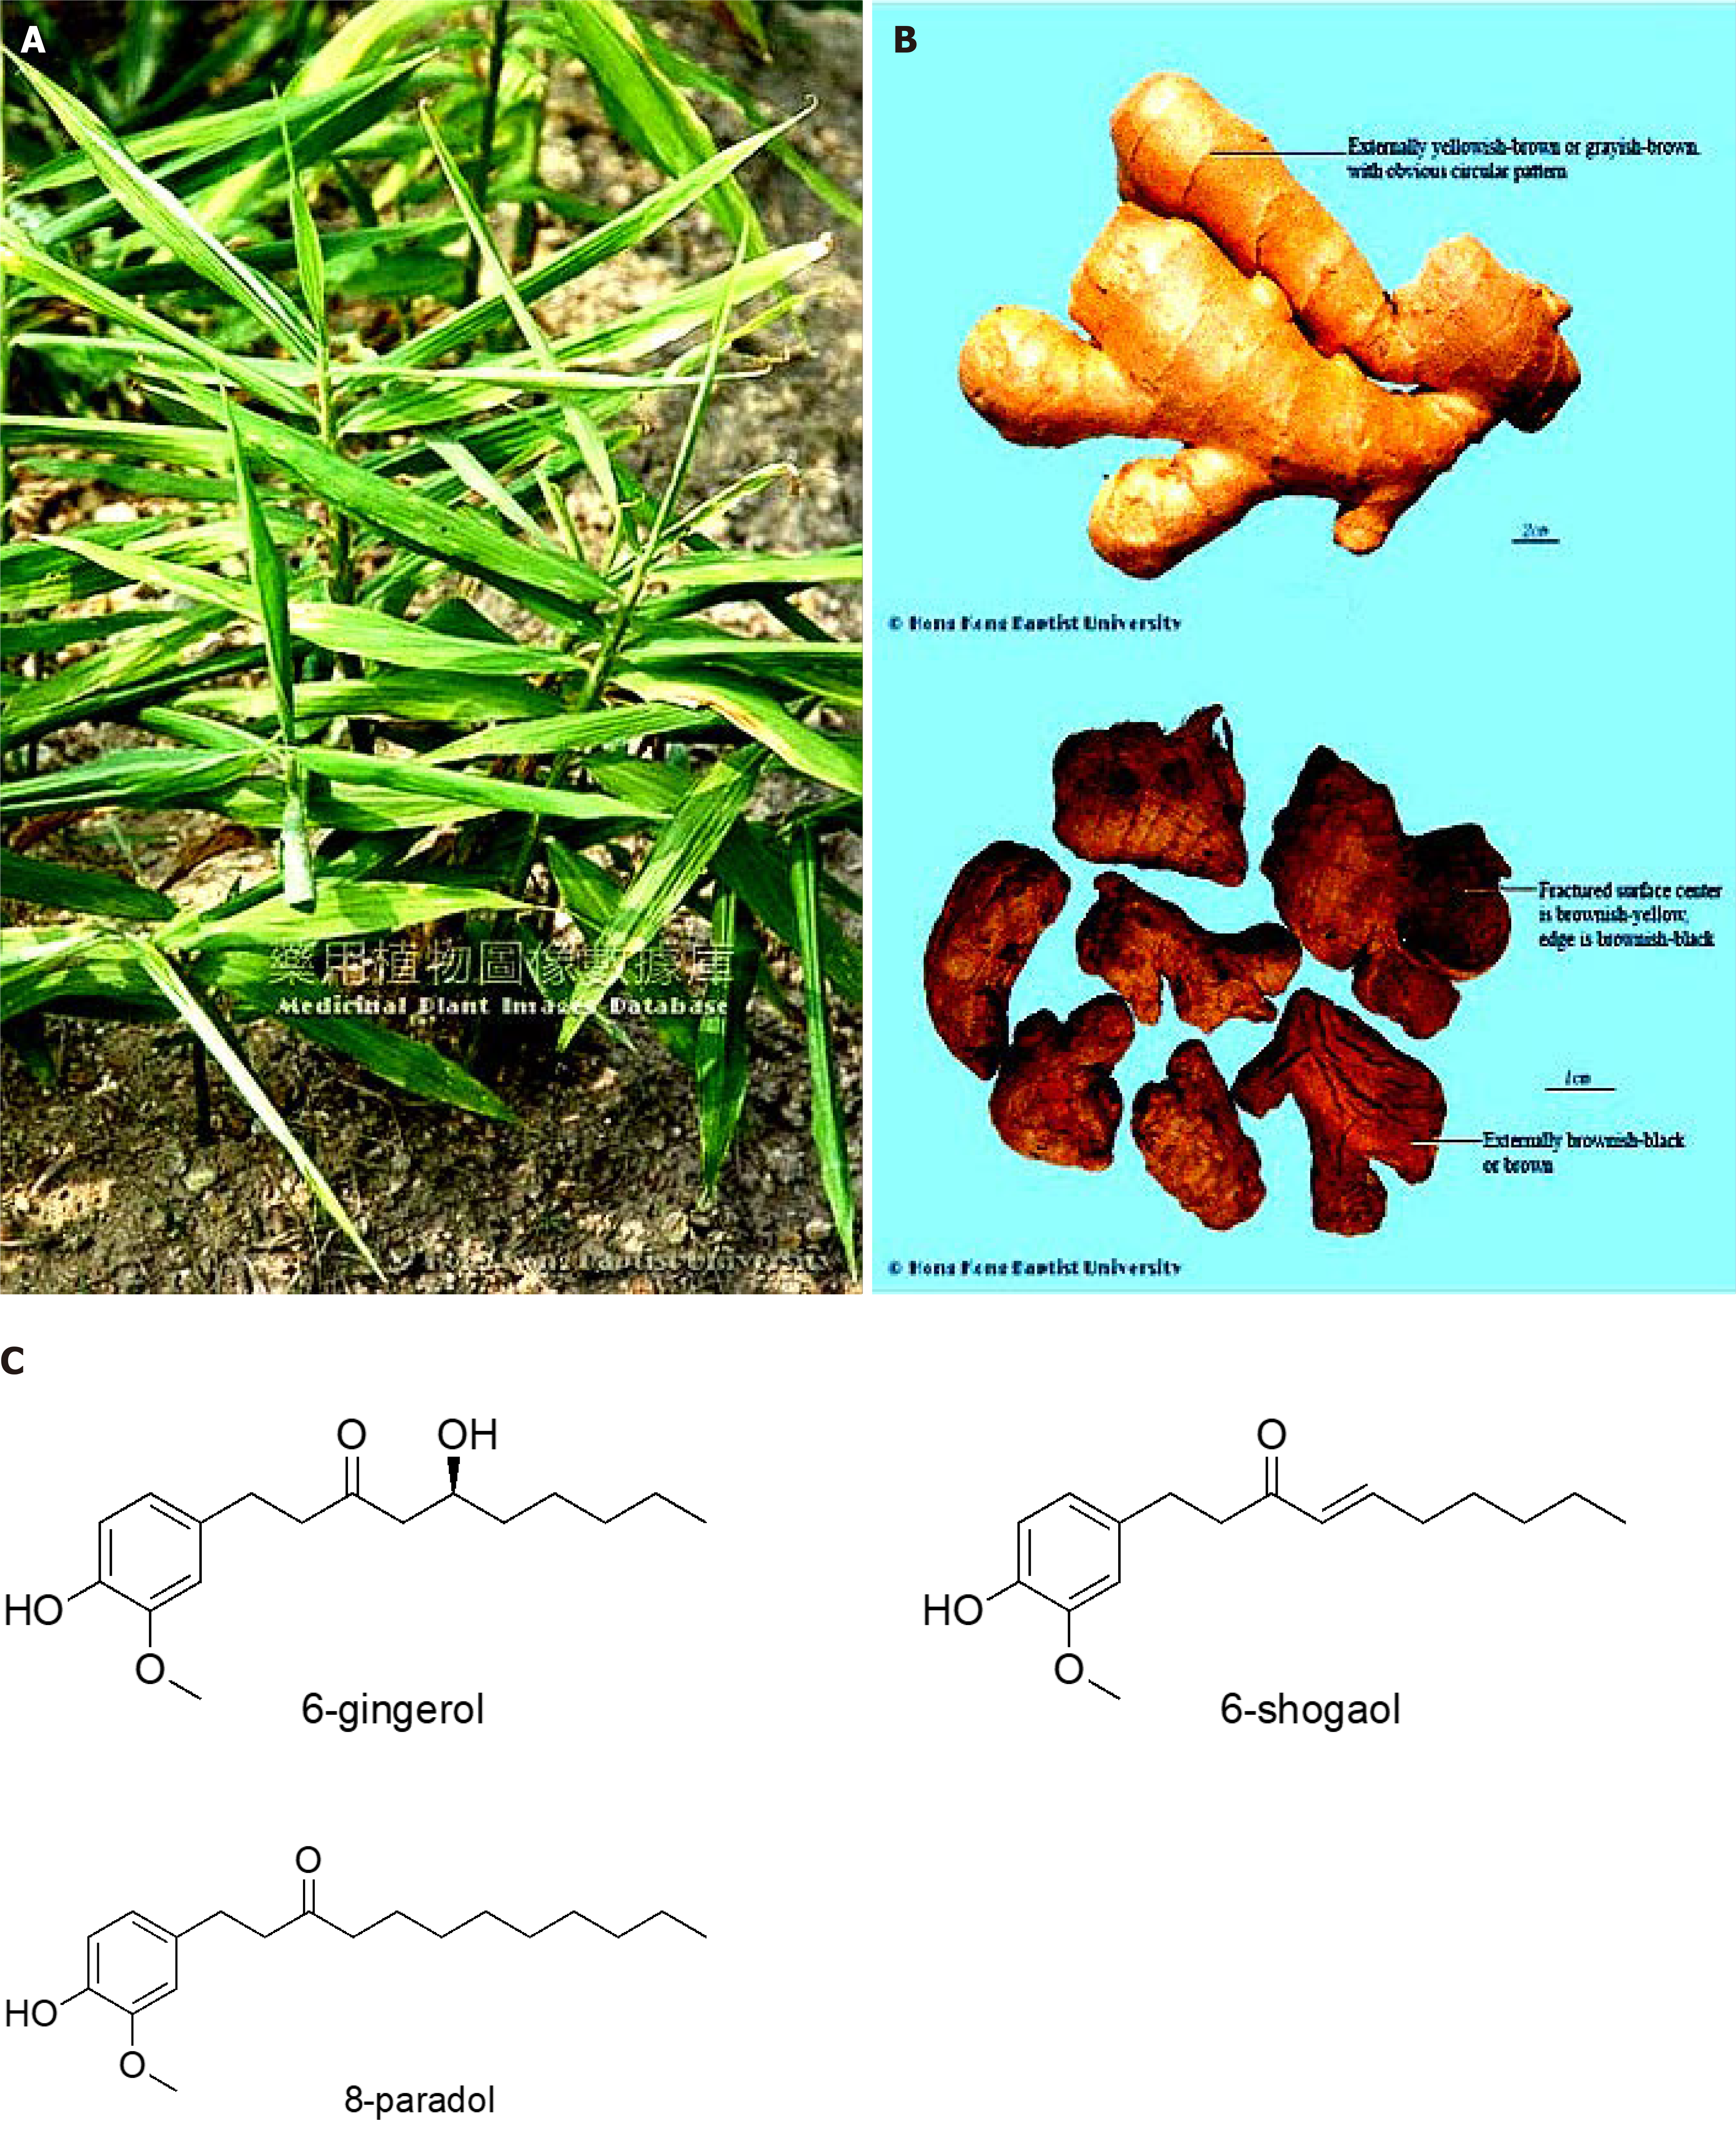
Figure 5 Zingiber officinale Roscoe.
A: Whole plants; B: Image of the root from which the crude drug is obtained; C: Main phytochemicals.
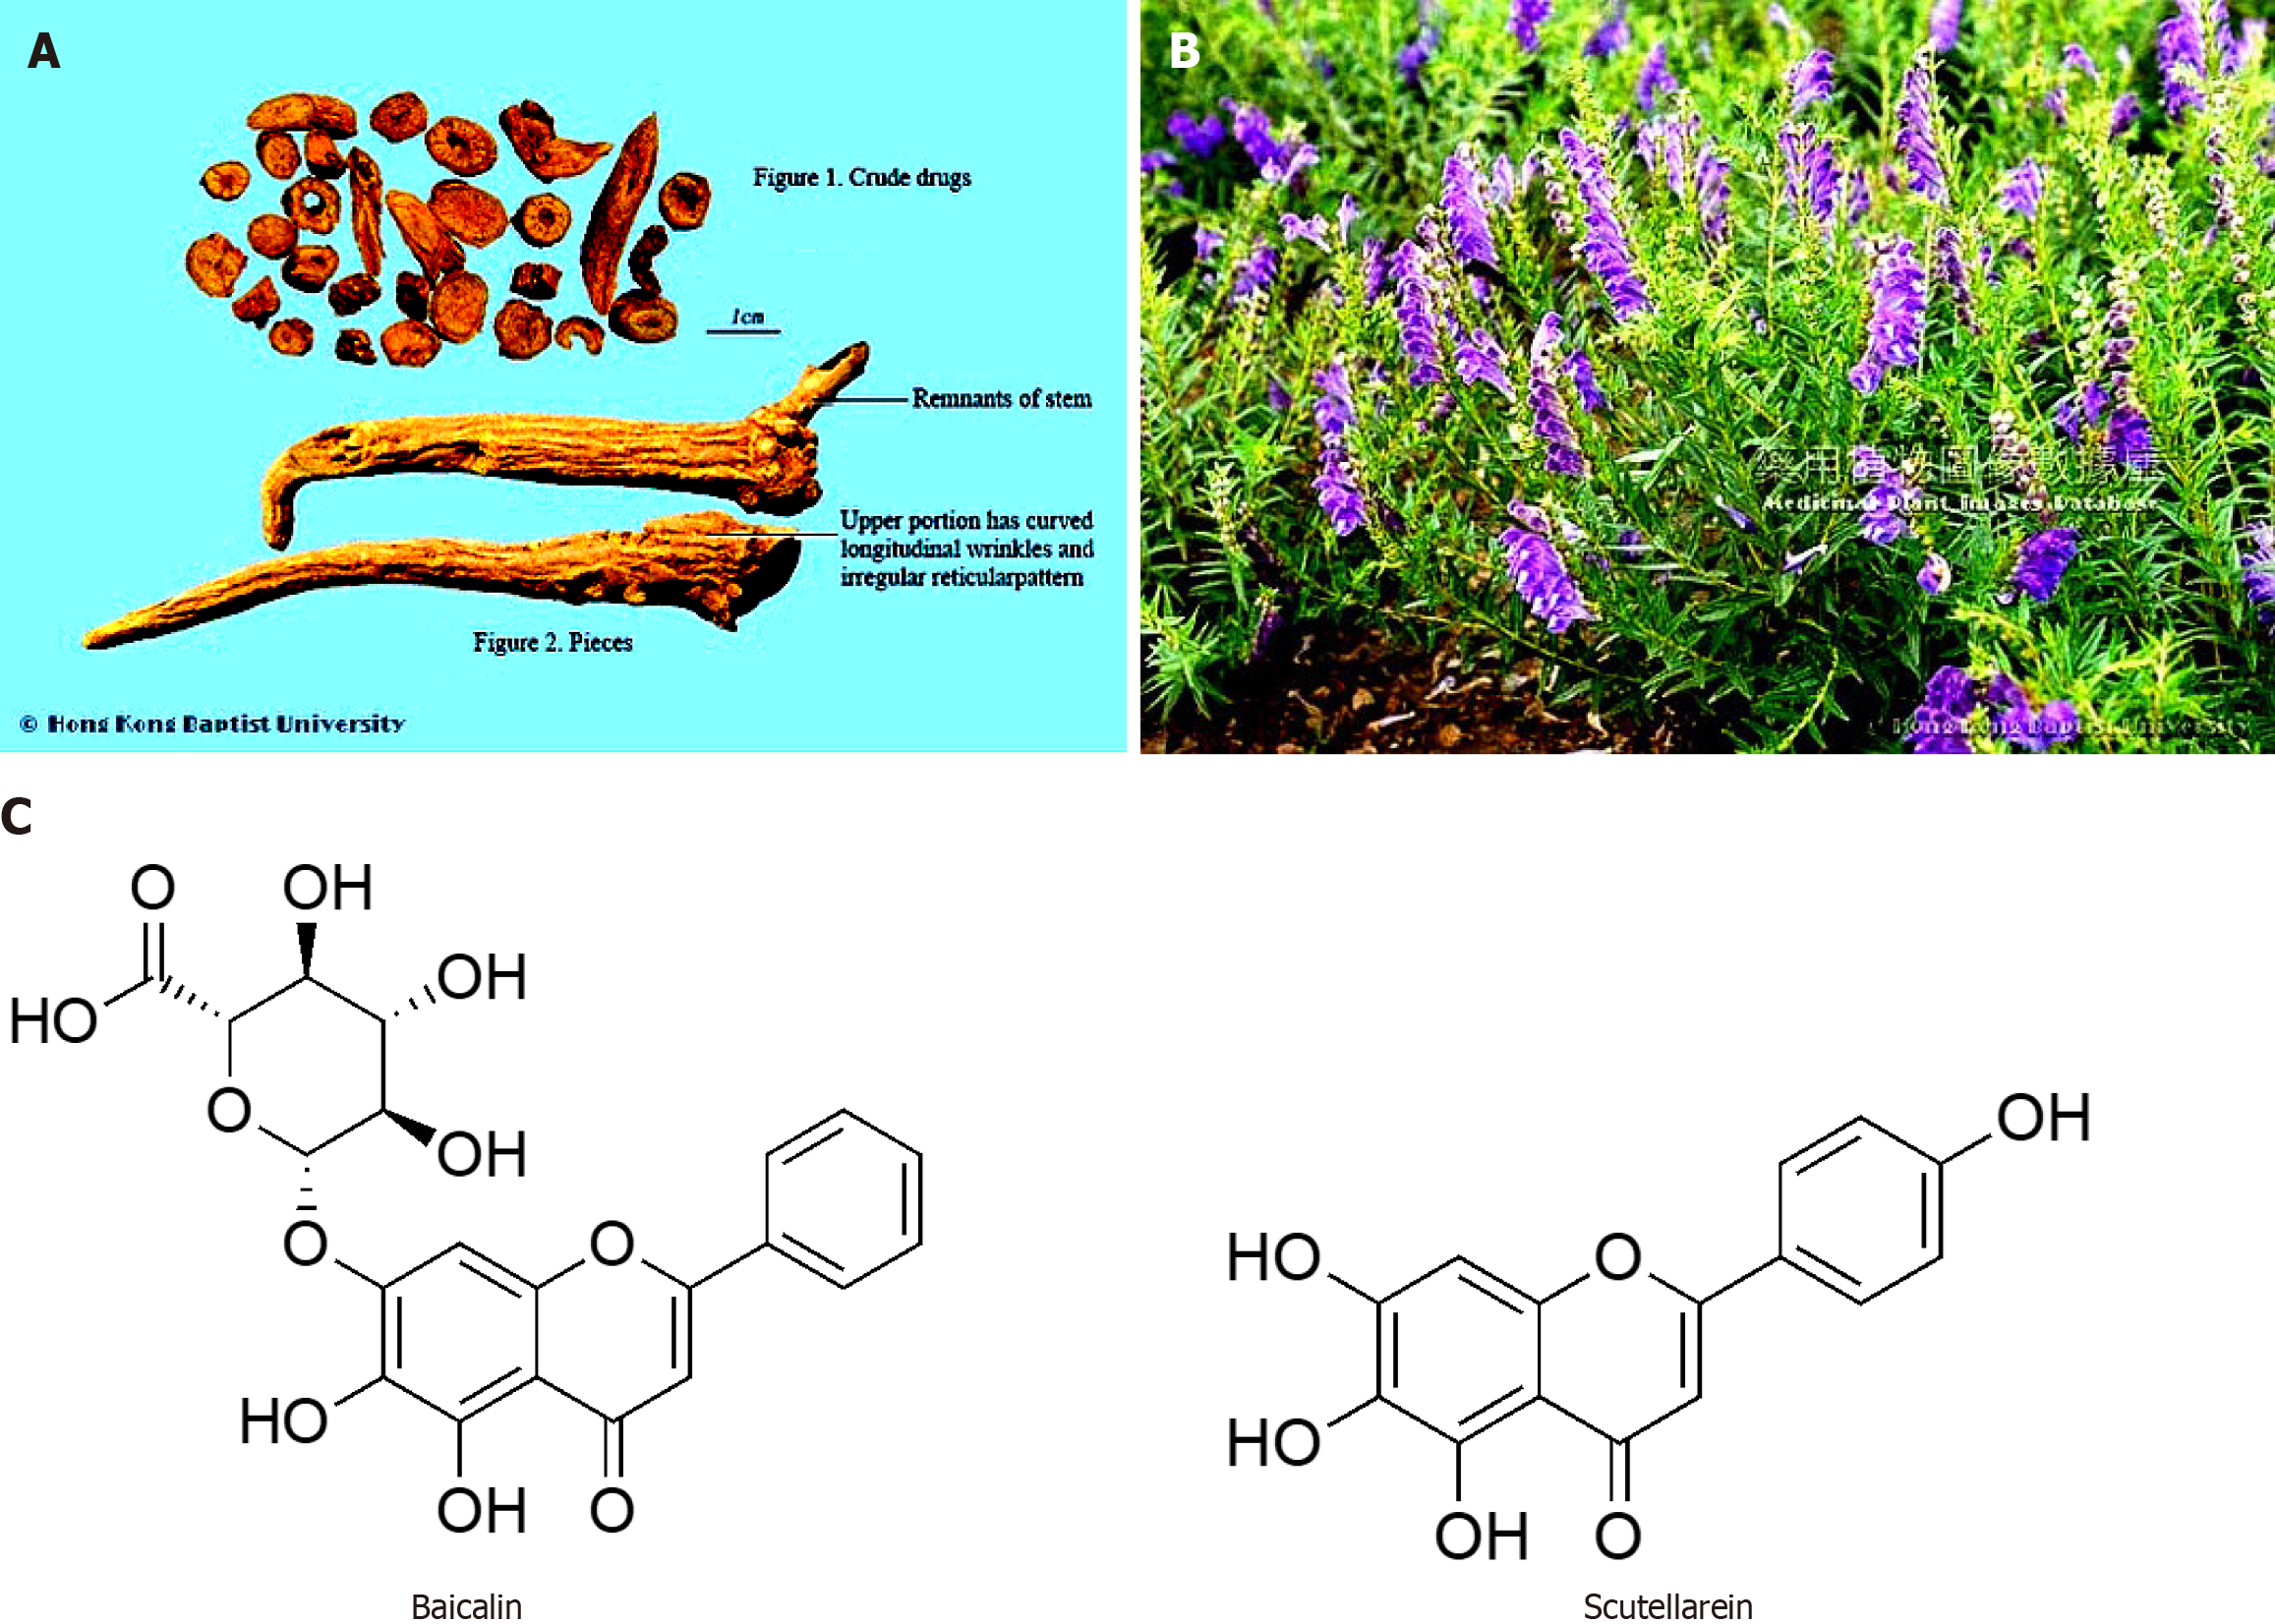
Figure 6 Scutellaria baicalensis Georgi.
A: Whole plants; B: Image of the root from which the crude drug is obtained; C: Main phytochemicals.
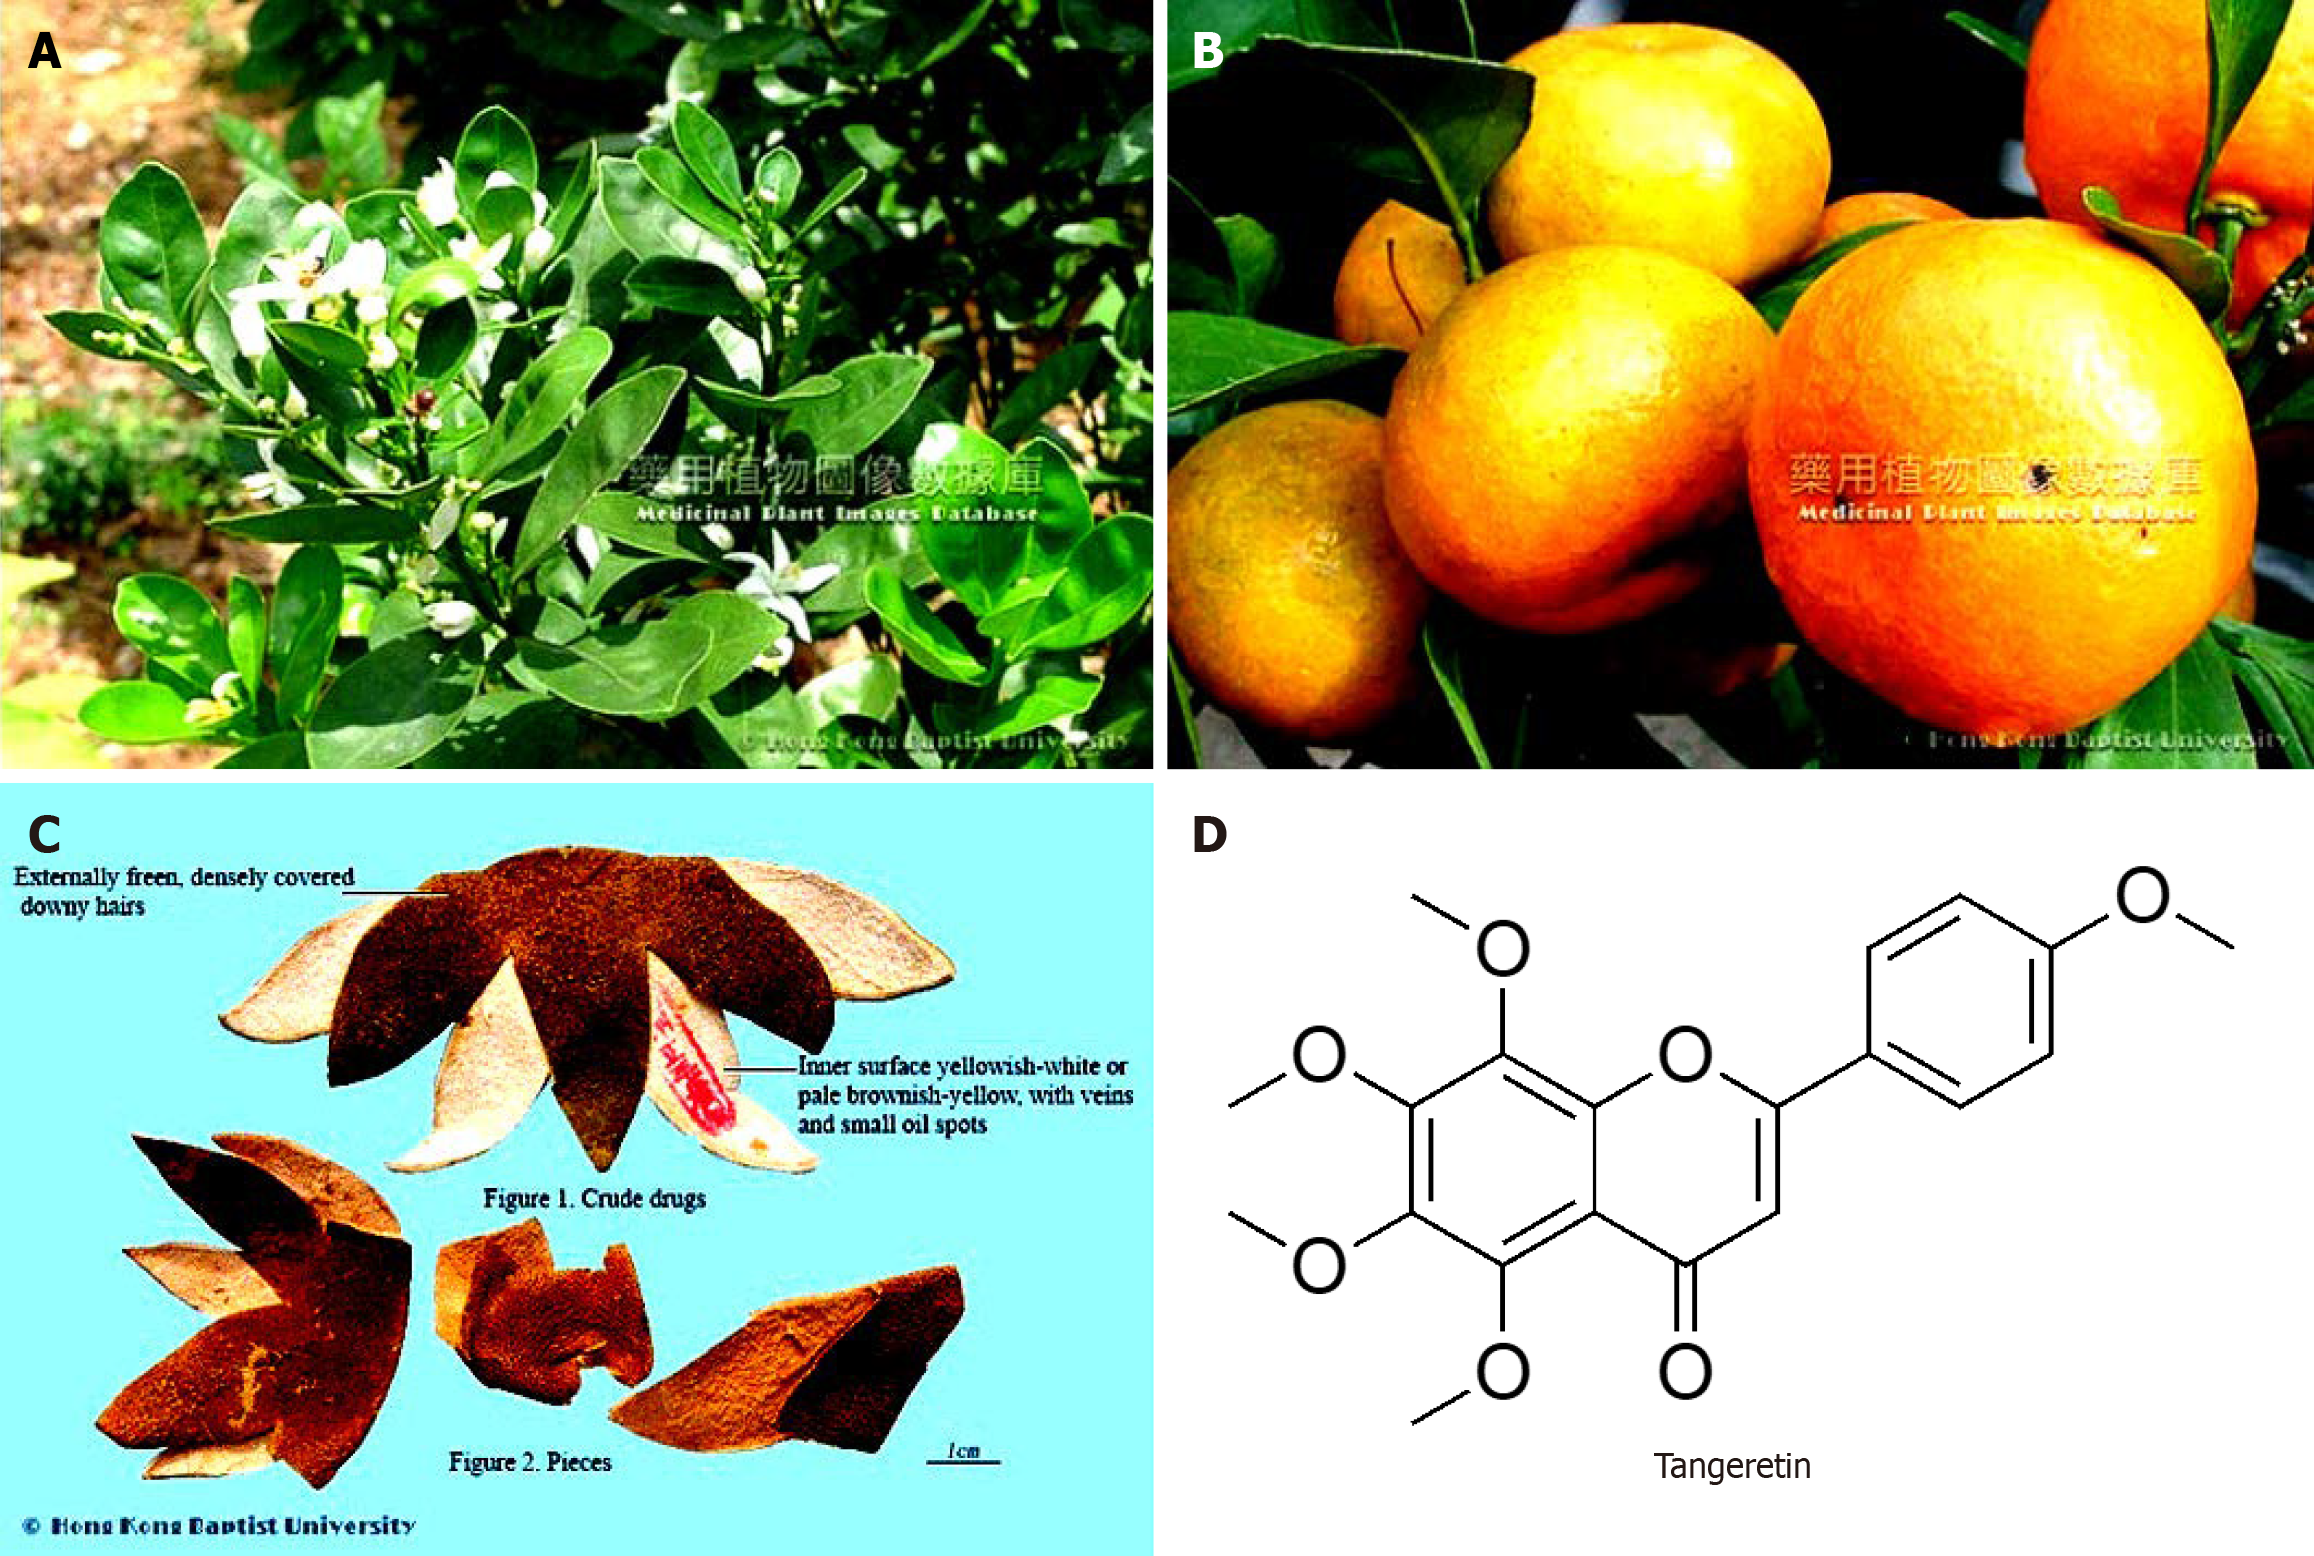
Figure 7 Citrus reticulata Blanco.
A: Whole plants; B: Fruits; C: Image of the dried peels of citrus from which the crude drug is obtained; D: Tangeretin.
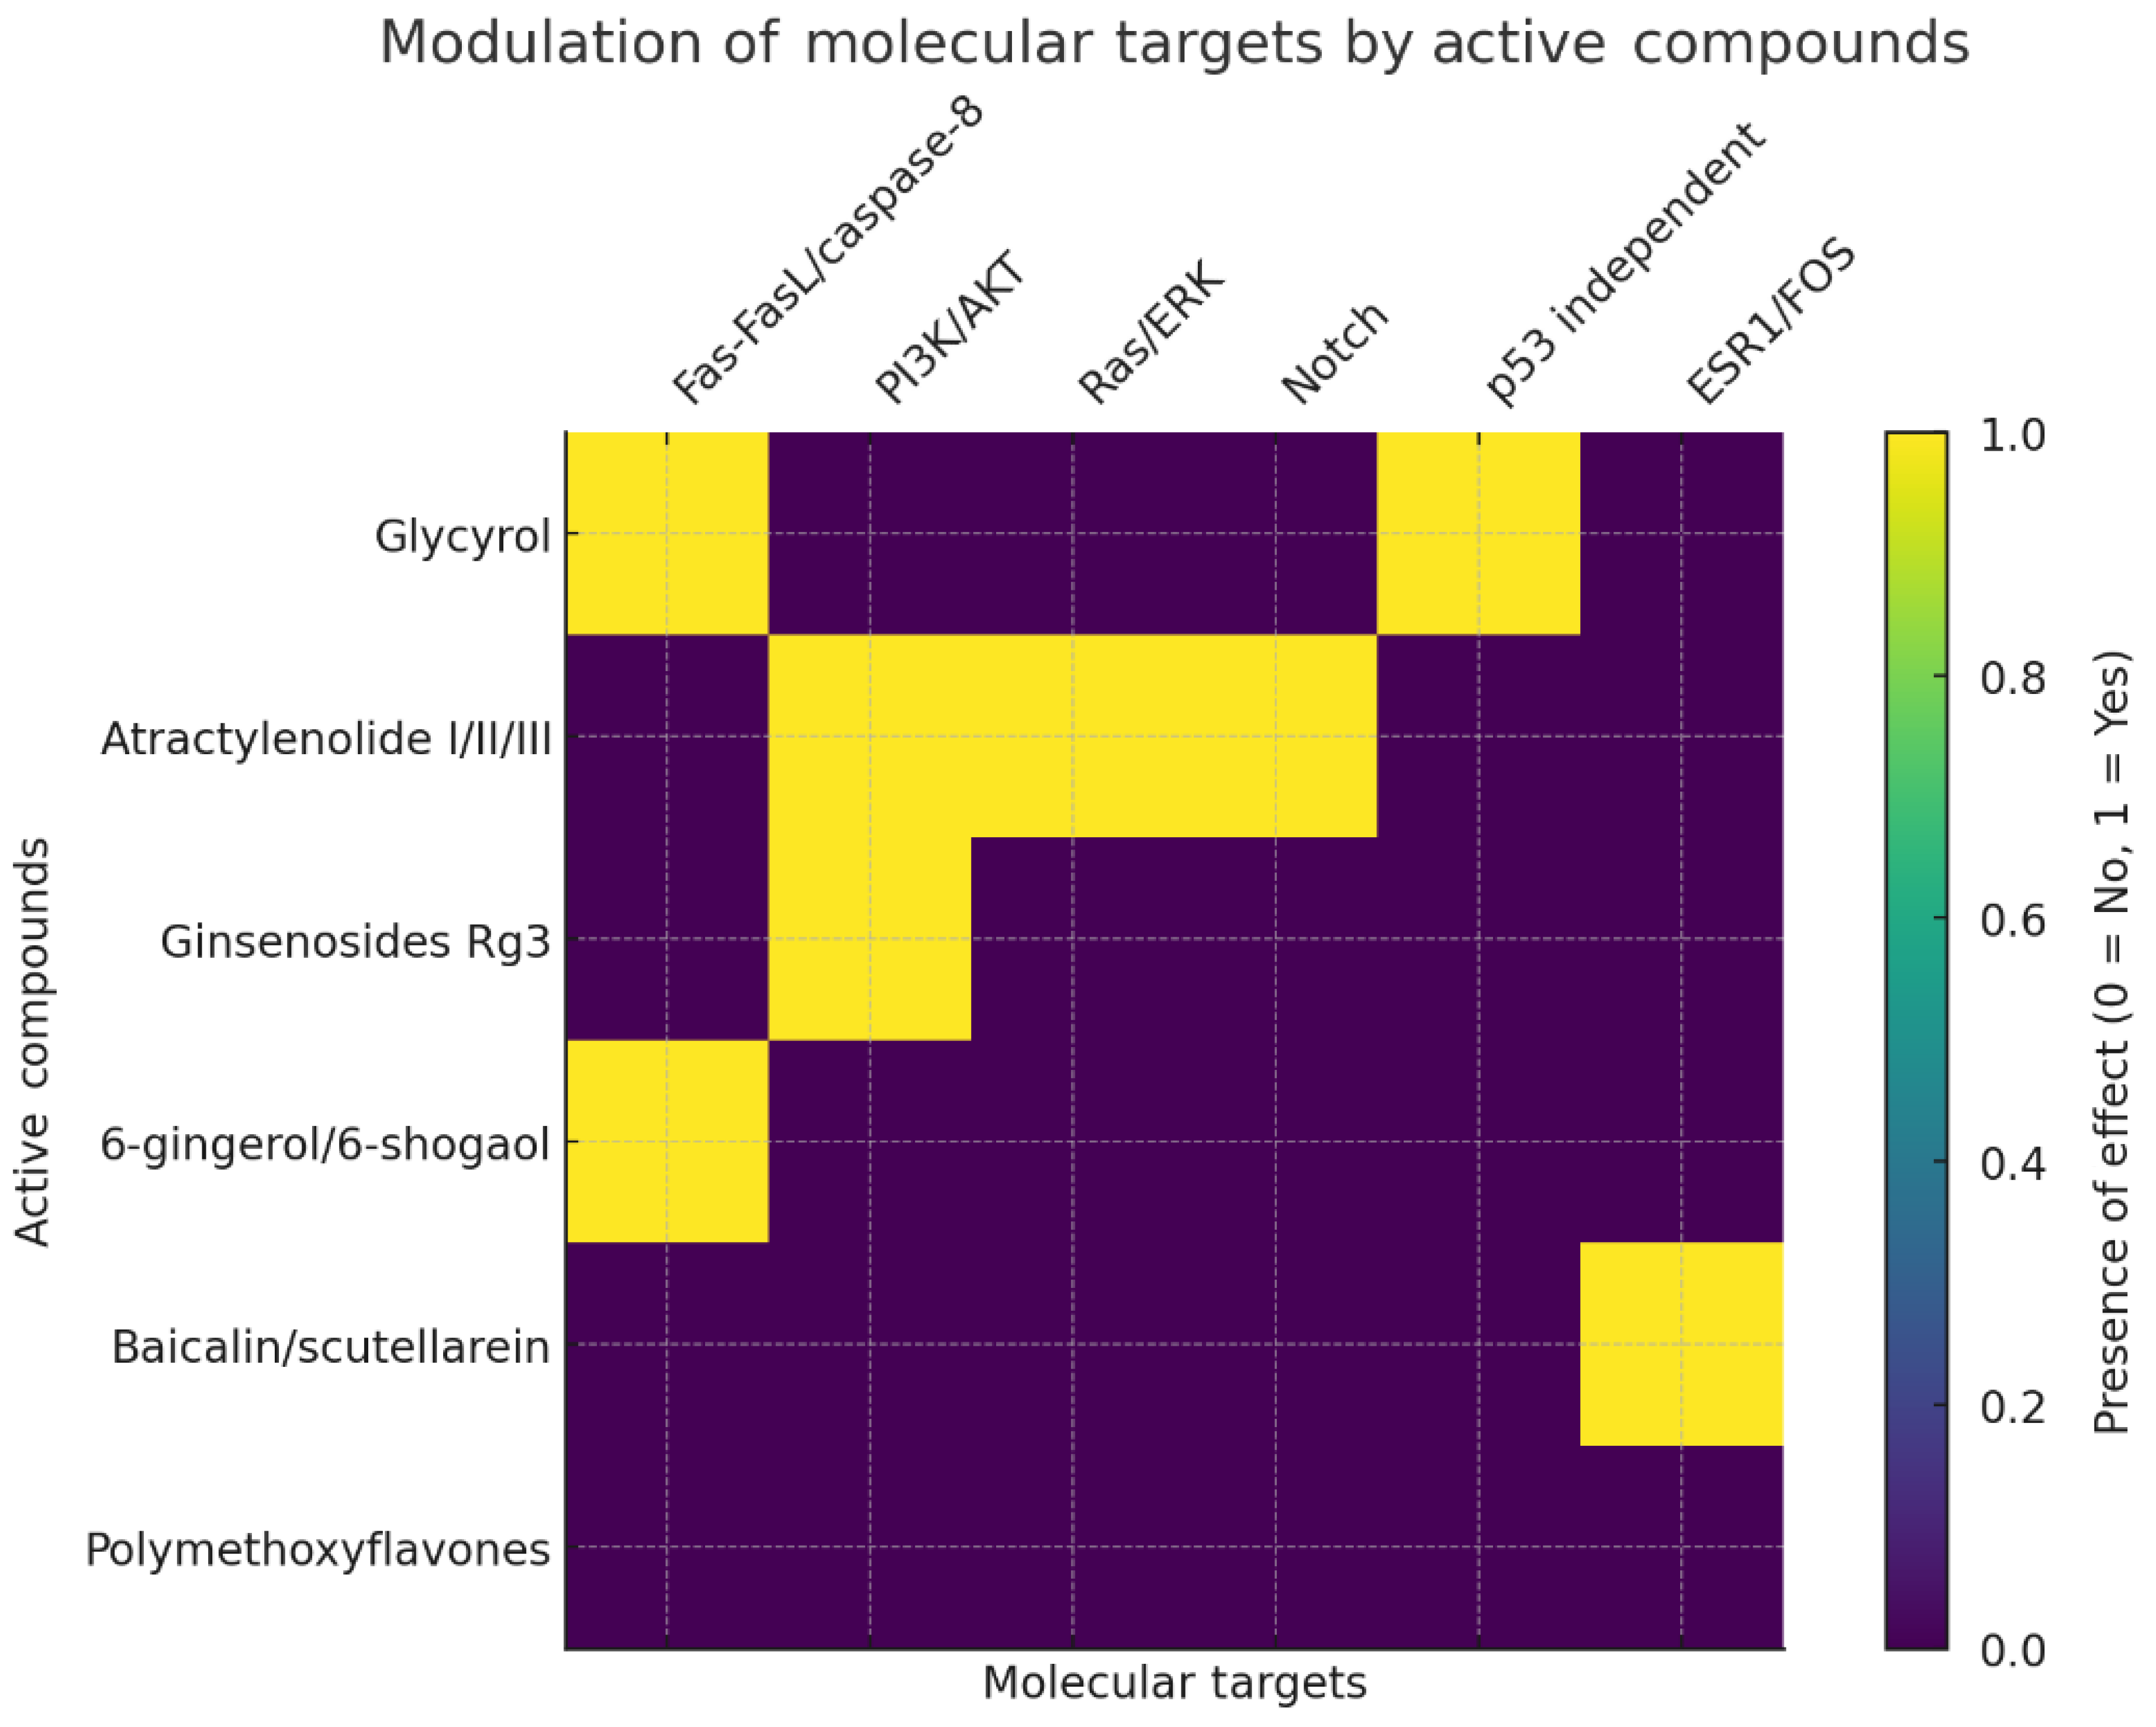
Figure 8 Heatmap of molecular target modulation by traditional Chinese medicine derived compounds.
This heatmap illustrates the interaction between selected active compounds and specific molecular targets. Each row represents a different compound, while each column corresponds to a molecular target. The colour intensity in each cell indicates whether a particular compound modulates a specific target (brighter green for modulation, darker for no modulation). This visualization aids in identifying which compounds are involved in influencing molecular pathways, providing insights into their potential therapeutic roles in modulating cellular processes relevant to cancer treatment and prevention.
- Citation: Micucci M, Xiang BZ, Ting CM, Kwan HY, Mari M, Retini M, Burattini S, Osman R, Okeke UJ, Abdullah FO, Gianfanti F, Battistelli M. Matching traditional Chinese medicine and western medicine-based research: Advanced nutraceutical development for proactive gastric cancer prevention. World J Gastrointest Oncol 2024; 16(9): 3798-3819
- URL: https://www.wjgnet.com/1948-5204/full/v16/i9/3798.htm
- DOI: https://dx.doi.org/10.4251/wjgo.v16.i9.3798


