©The Author(s) 2024.
World J Gastrointest Oncol. Aug 15, 2024; 16(8): 3539-3558
Published online Aug 15, 2024. doi: 10.4251/wjgo.v16.i8.3539
Published online Aug 15, 2024. doi: 10.4251/wjgo.v16.i8.3539
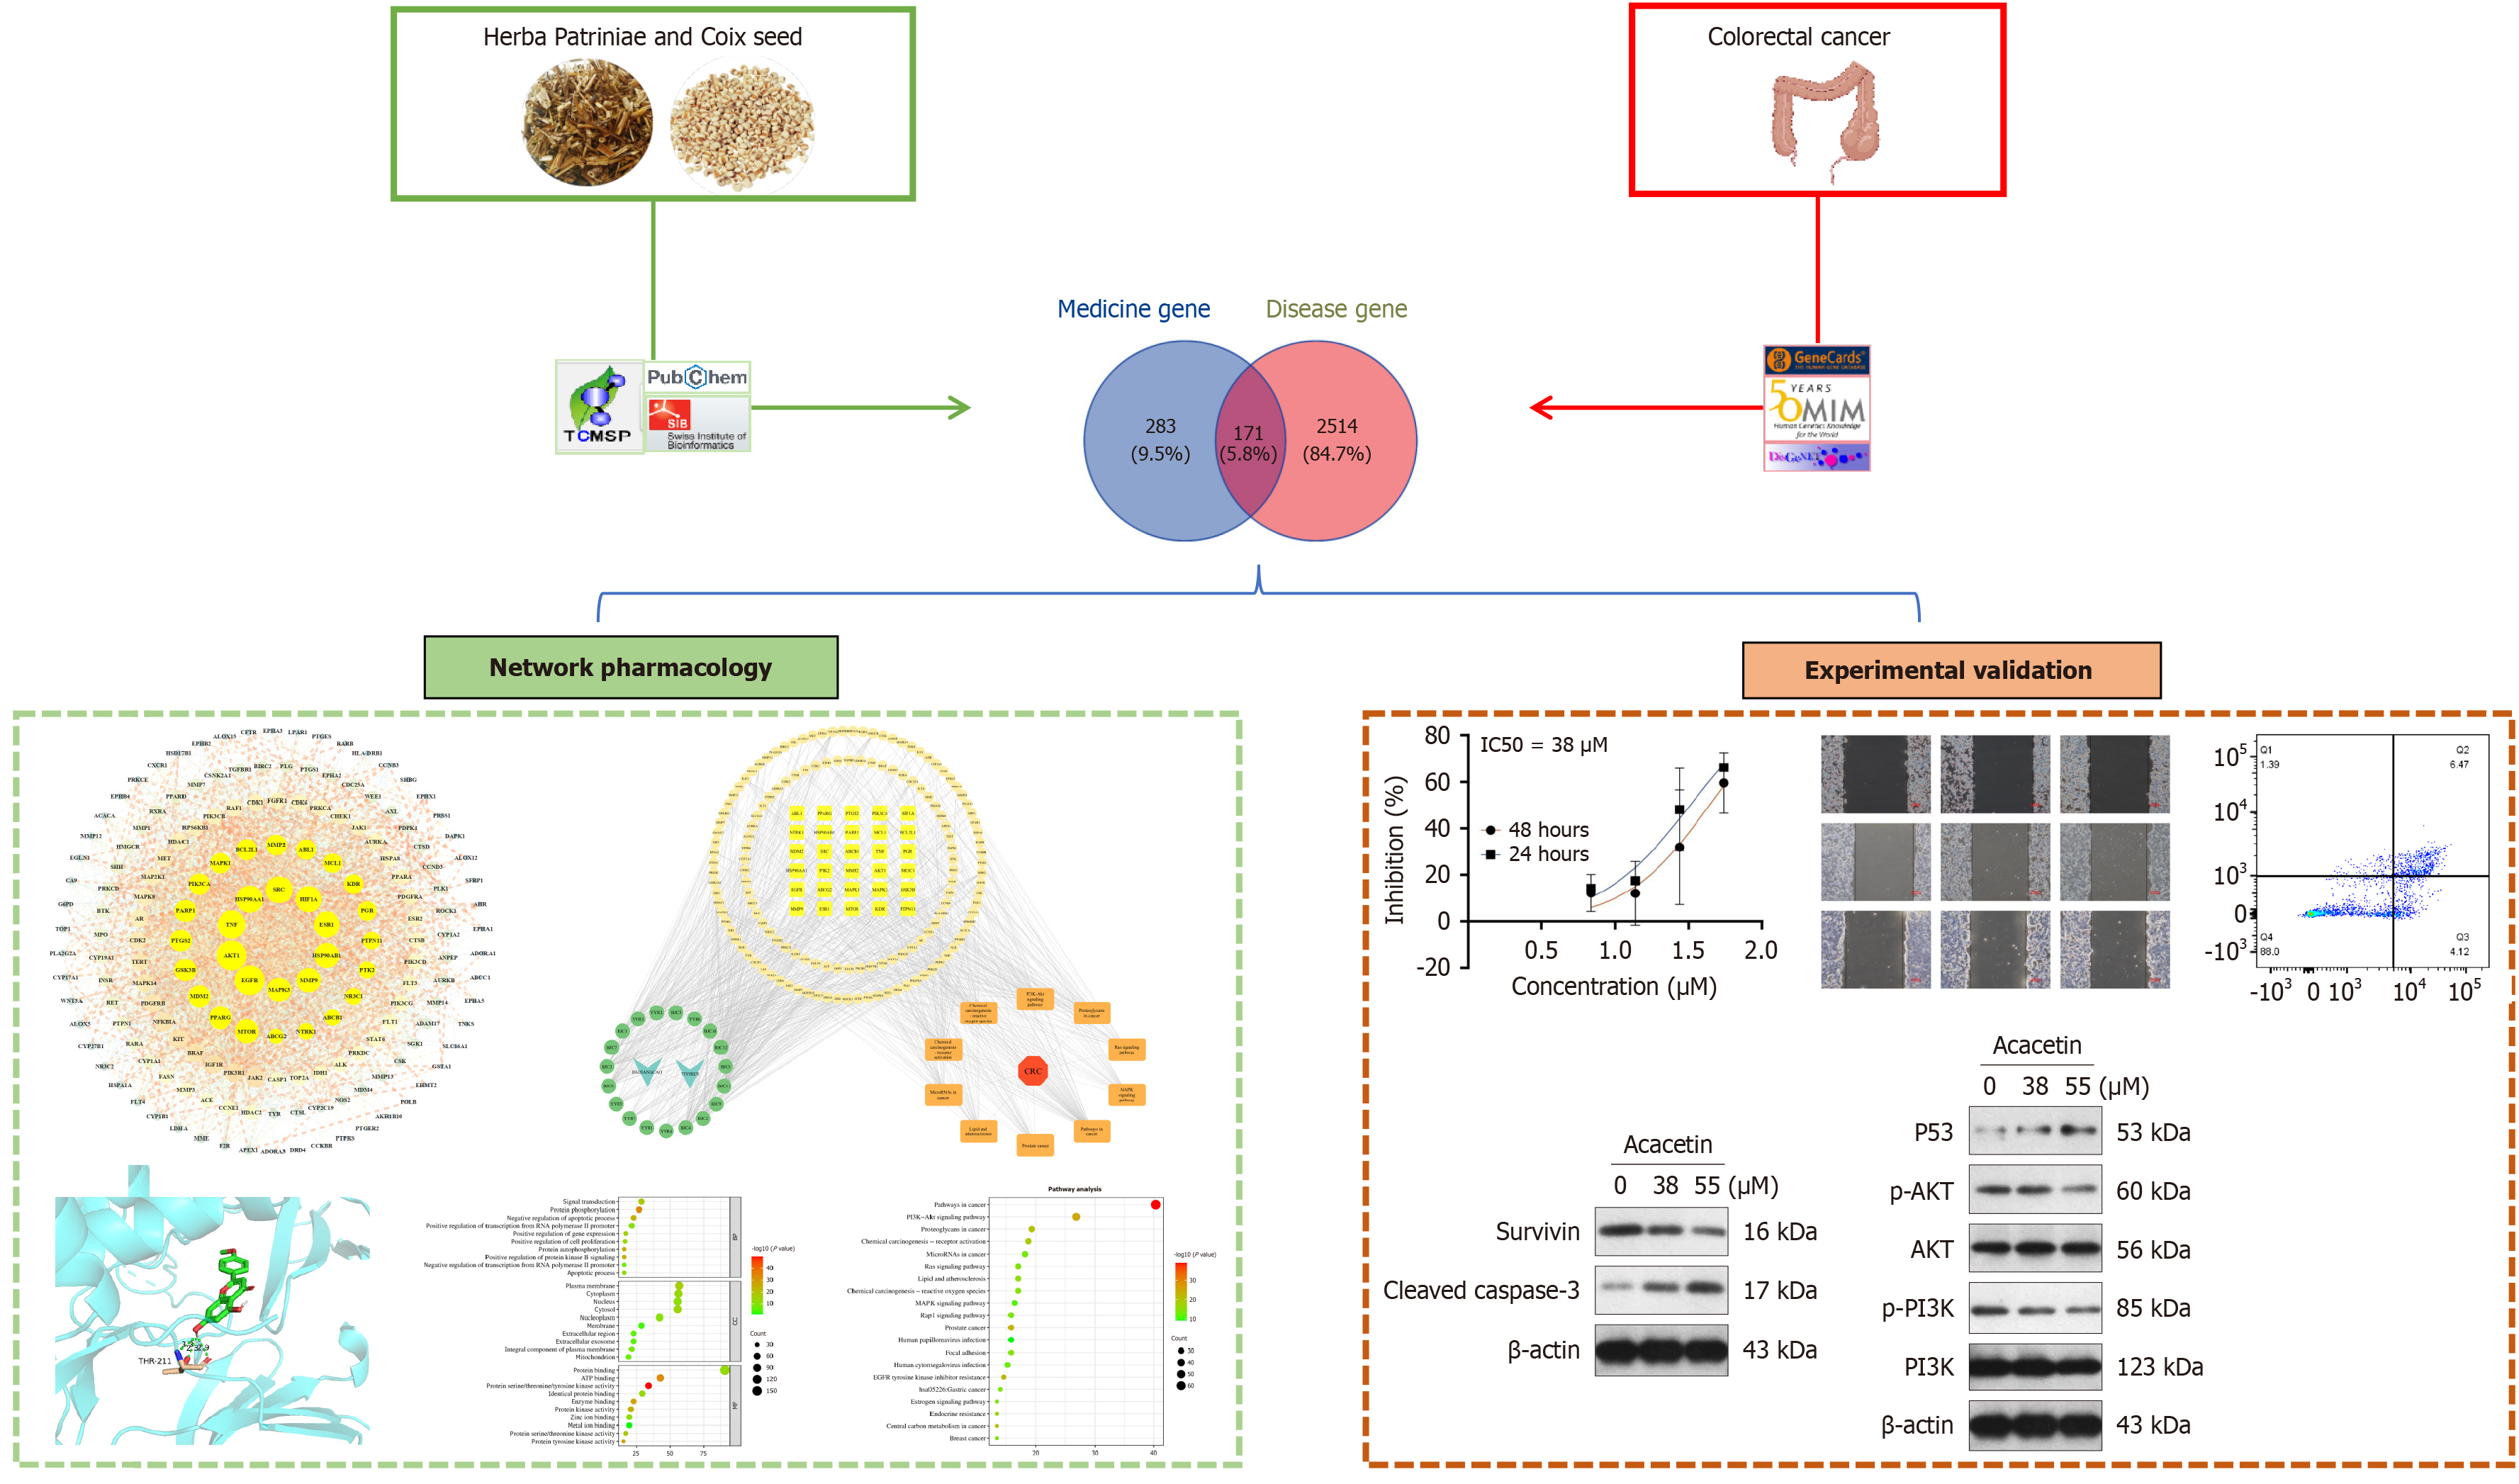
Figure 1 Flow chart depicting the study methodology.
Various databases were searched to obtain common targets of colorectal cancer (CRC) and Herba Patriniae-Coix seed. Possible targets and pathways for CRC were analyzed via network pharmacology and finally verified through in vitro experiments.
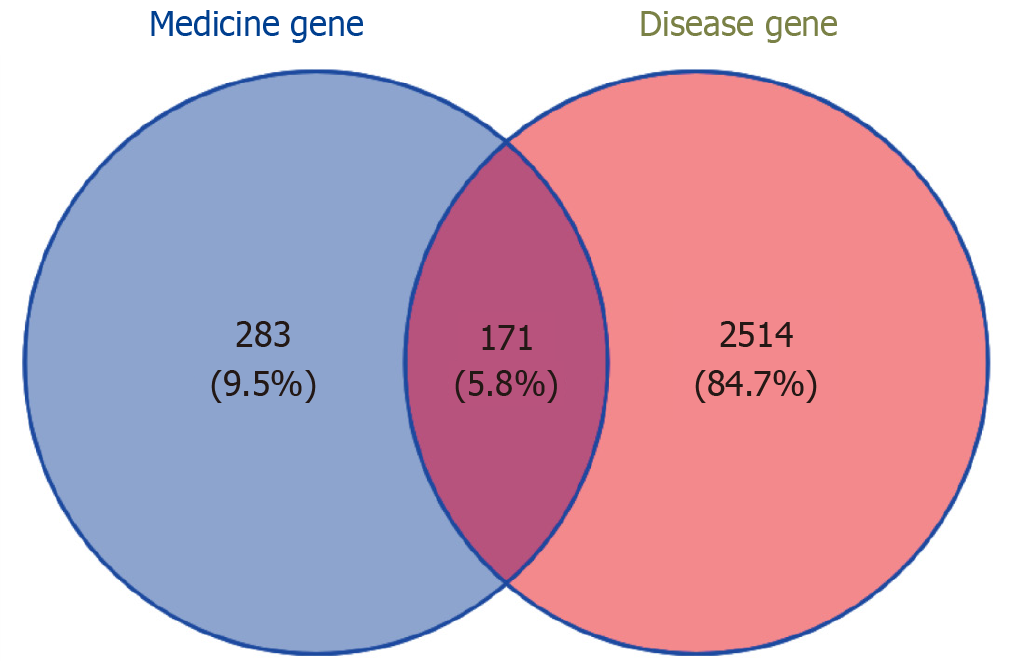
Figure 2 Venn diagram of the active ingredients and disease targets.
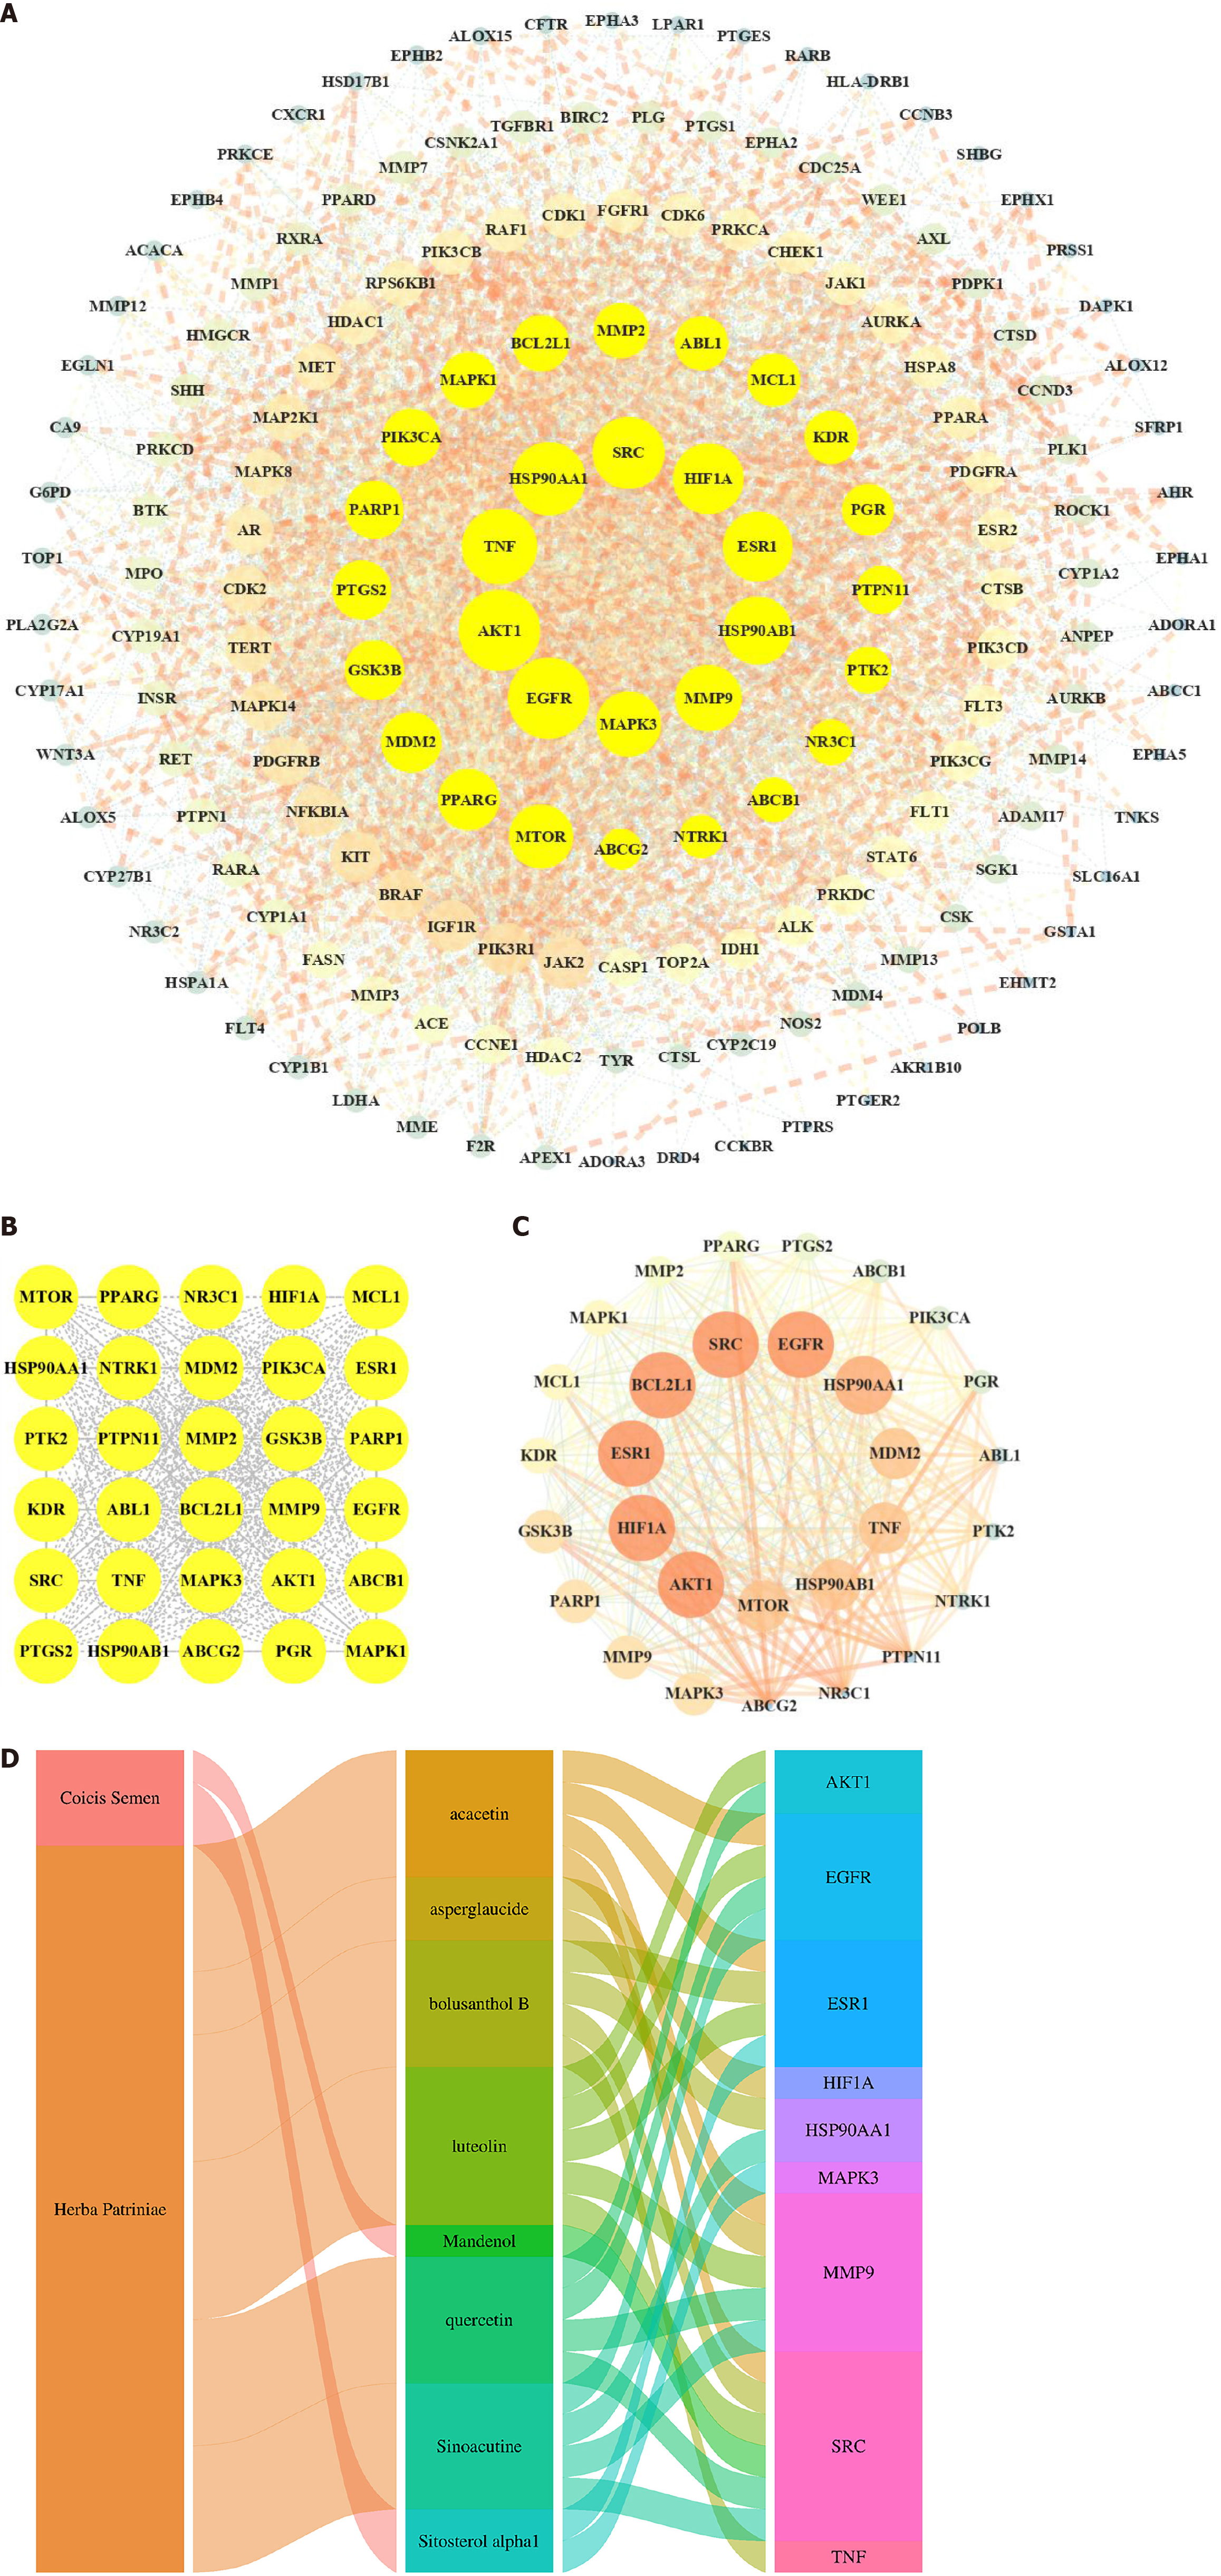
Figure 3 Protein-protein interaction analysis of the intersection targets between Herba Patriniae-Coix seed and colorectal cancer.
A: The protein-protein interaction (PPI) network between the Herba Patriniae-Coix seed and colorectal cancer intersection targets; B and C: The top 30 core targets identified through PPI network analysis; D: The impact map revealing the relationship between traditional Chinese medicine, core components, and core genes.
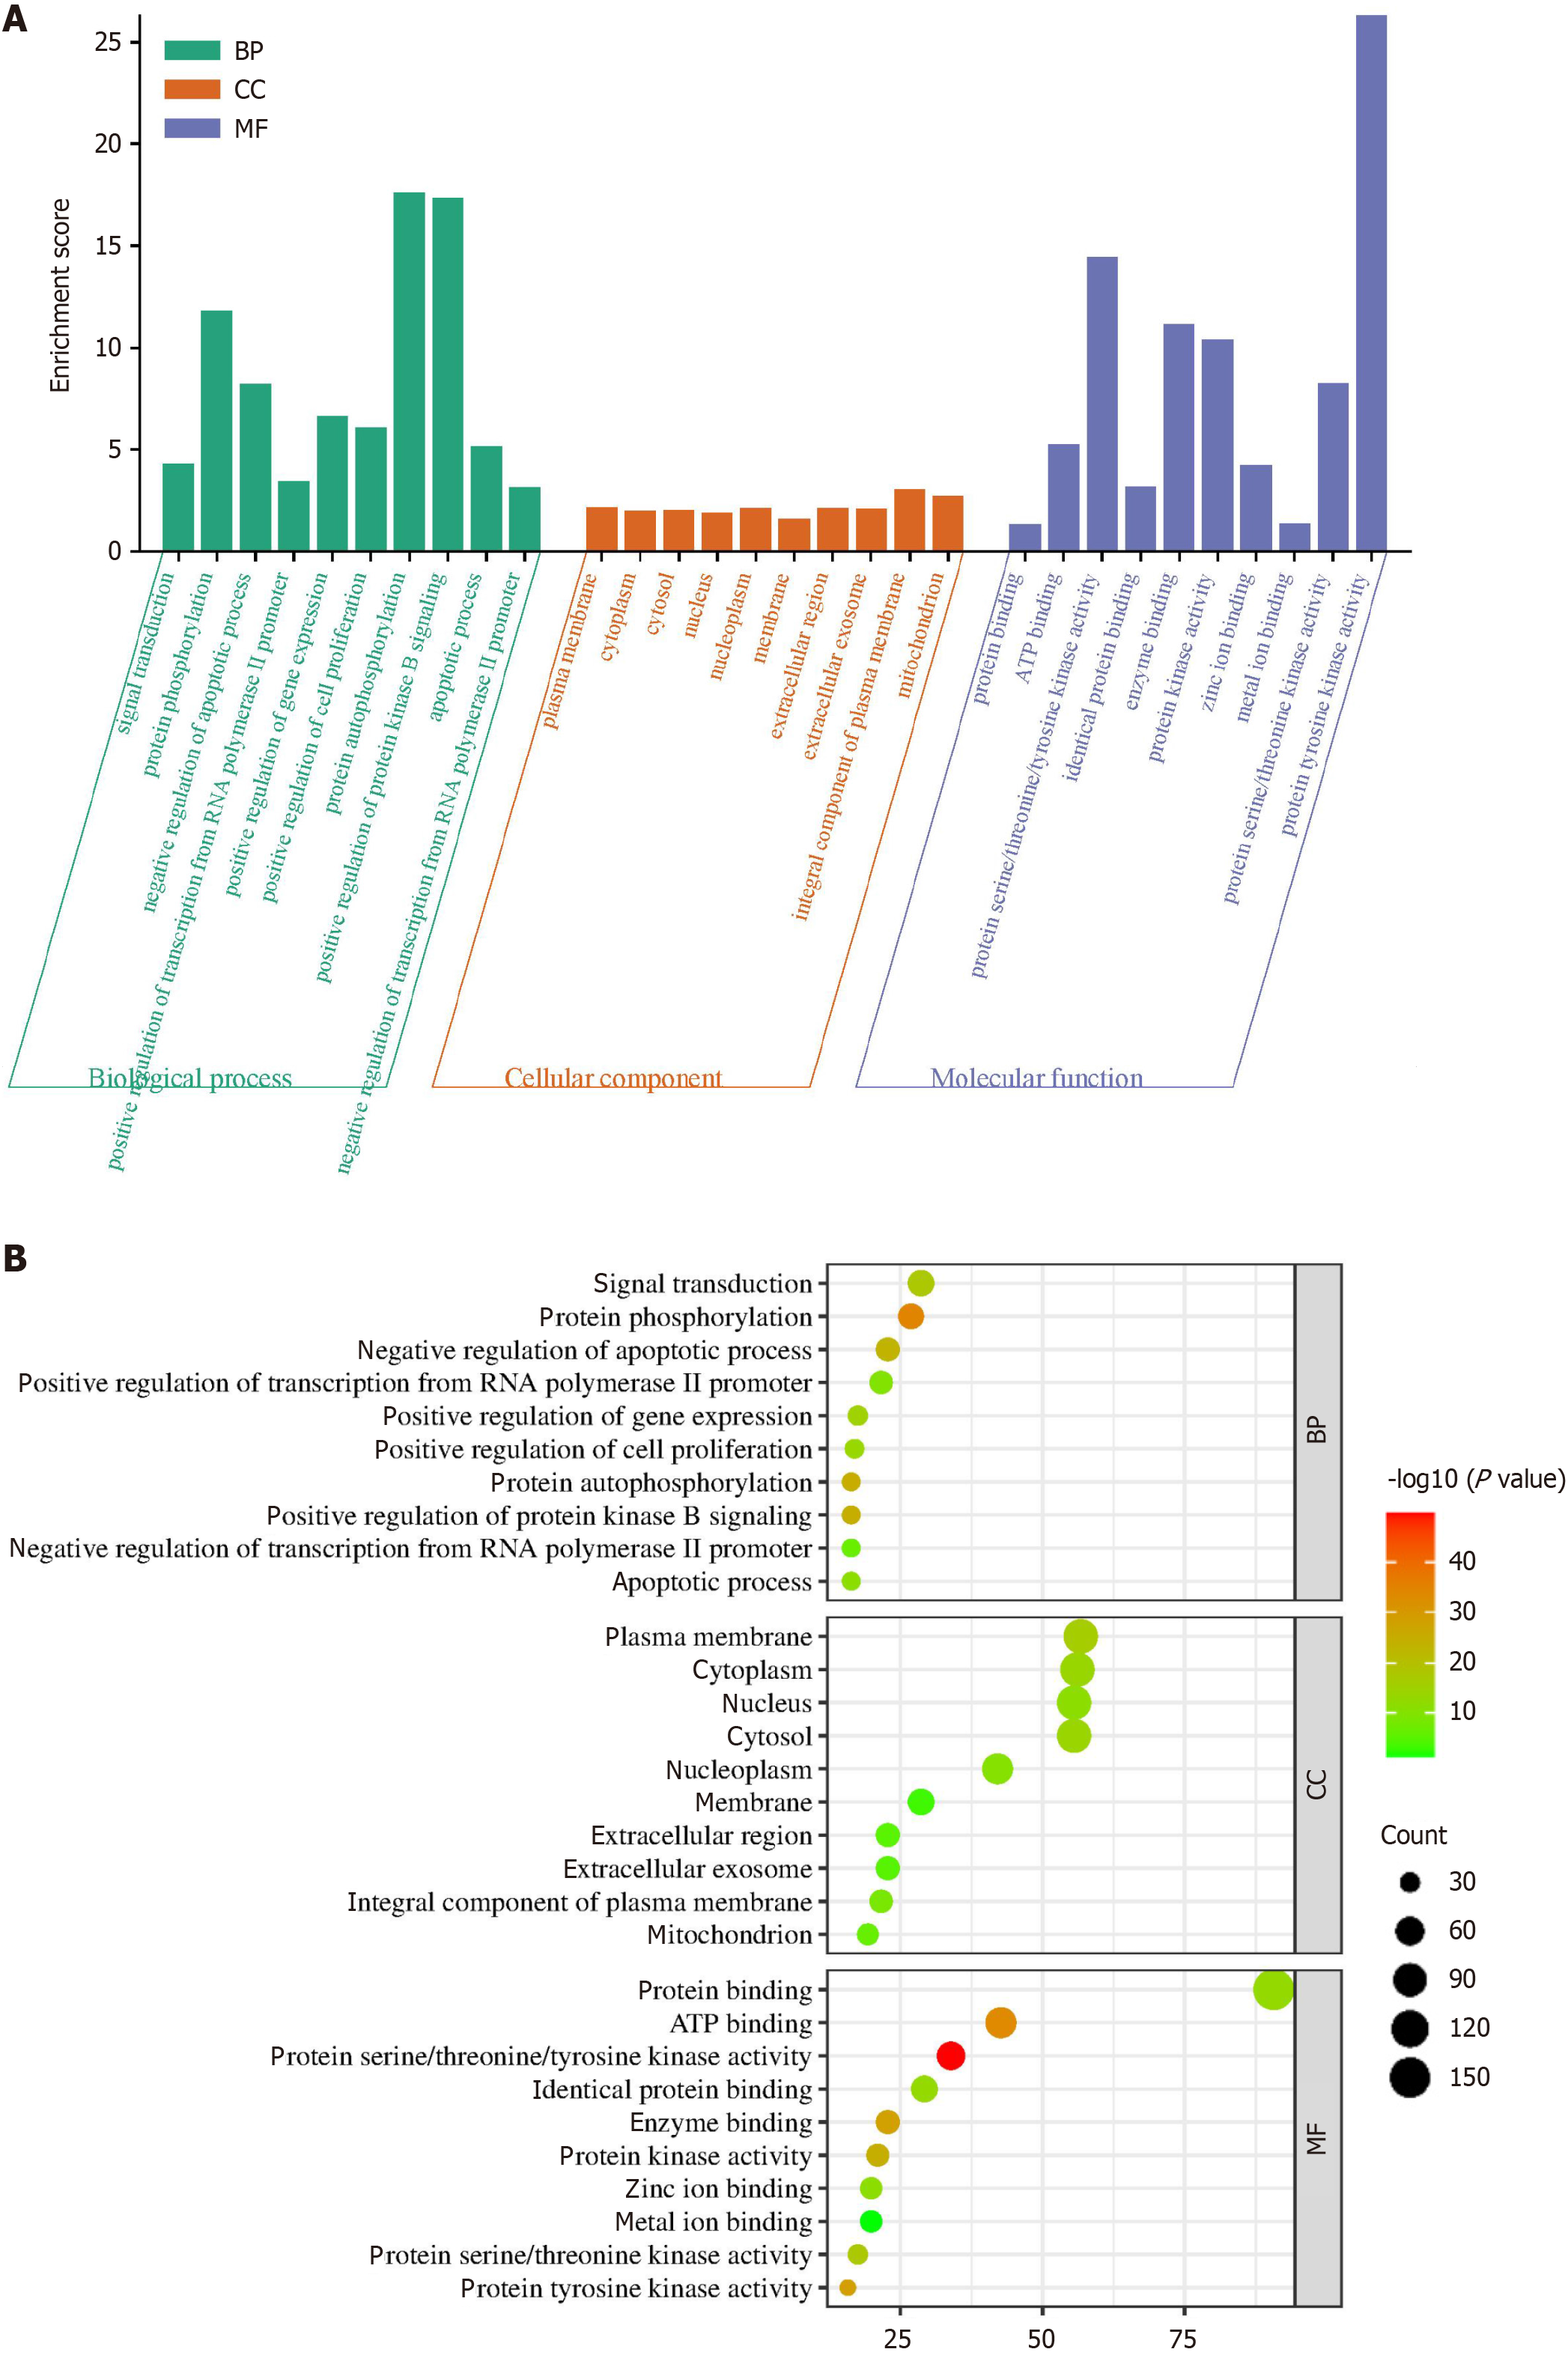
Figure 4 Gene ontology.
A and B: Gene ontology functional enrichment analysis. BP: Biological process; CC: Cell component; MF: Molecular function.
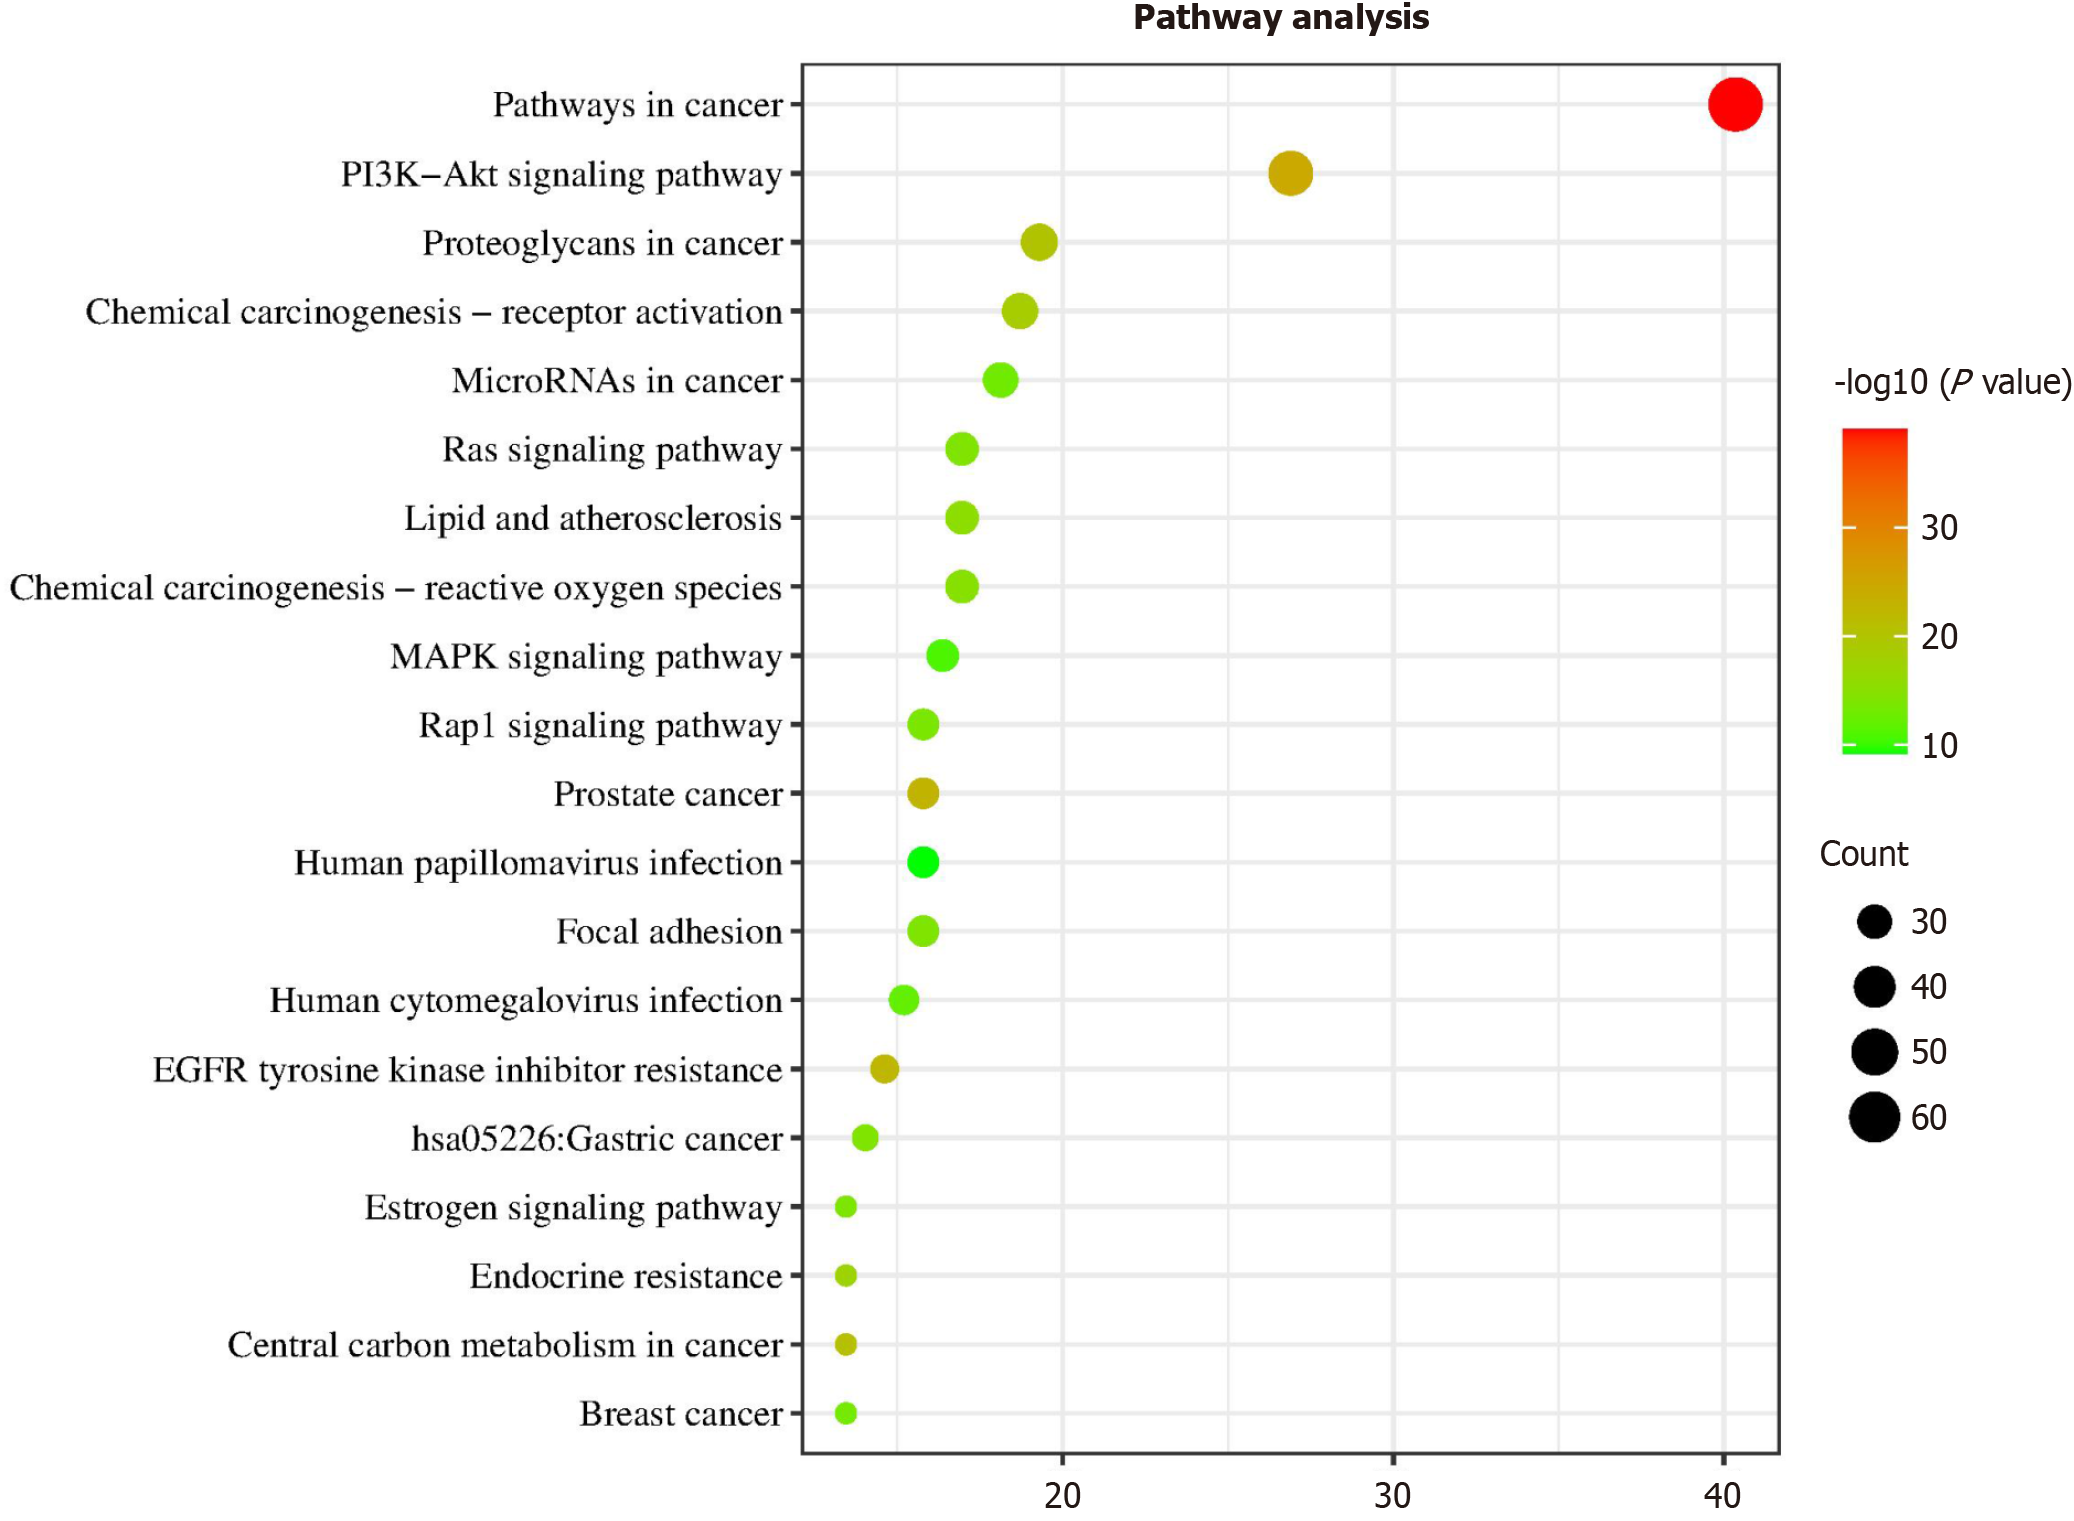
Figure 5 Kyoto Encyclopedia of Genes and Genomes pathway enrichment analysis.
The X-axis denotes the enrichment rate of these genes within the total gene pool, whereas the Y-axis indicates the enrichment pathway of the target gene (P ≤ 0.05). The depth of the color corresponds to the magnitude of the value, whereas the size of the circle reflects the enrichment count of these pathways. The top five signaling pathways are: Pathways in cancer, phosphoinositide 3-kinase-Akt signaling pathway, proteoglycans in cancer, chemical carcinogenesis, receptor activation, and microRNAs in cancer.
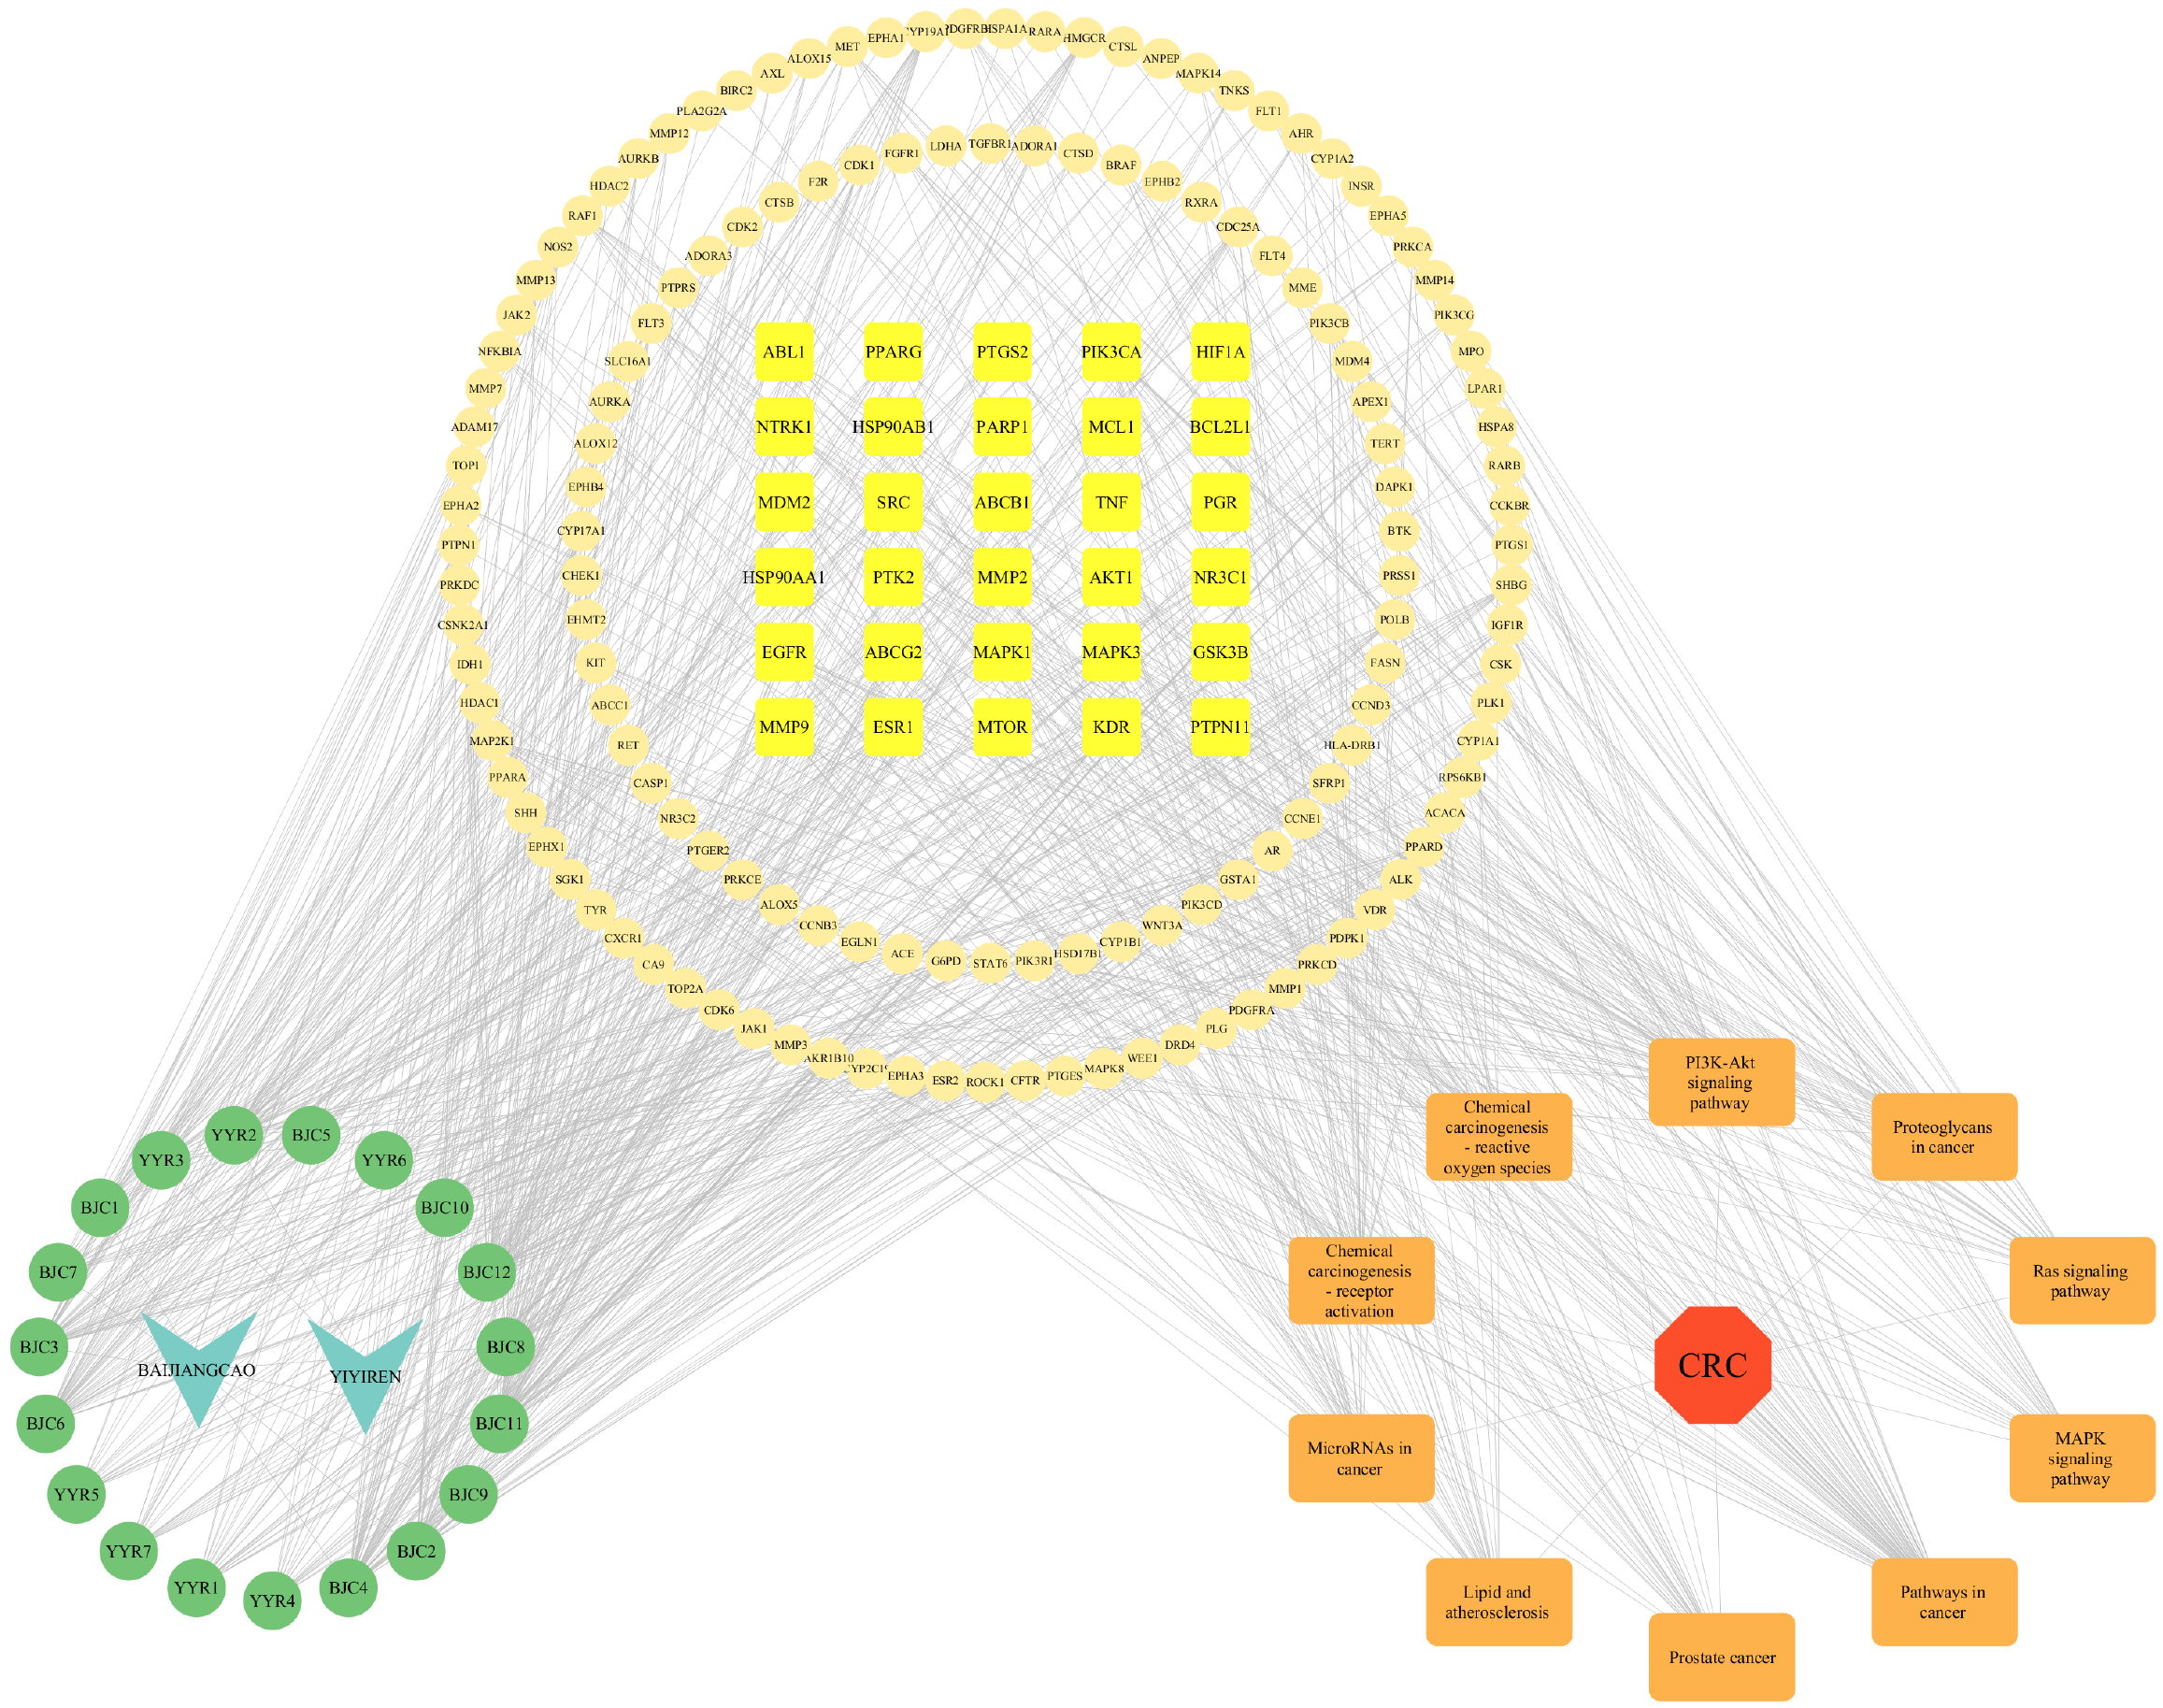
Figure 6 Herbal components-target-pathway-disease network for Herba Patriniae-Coix seed anti-colorectal cancer therapy.
The light-green inverted triangles symbolize herbs, the dark-green circles signify the active ingredients of various herbs, the yellow circles denote general targets, the yellow squares indicate core targets, the orange rectangles correspond to pathways, and the red octagons represent diseases.
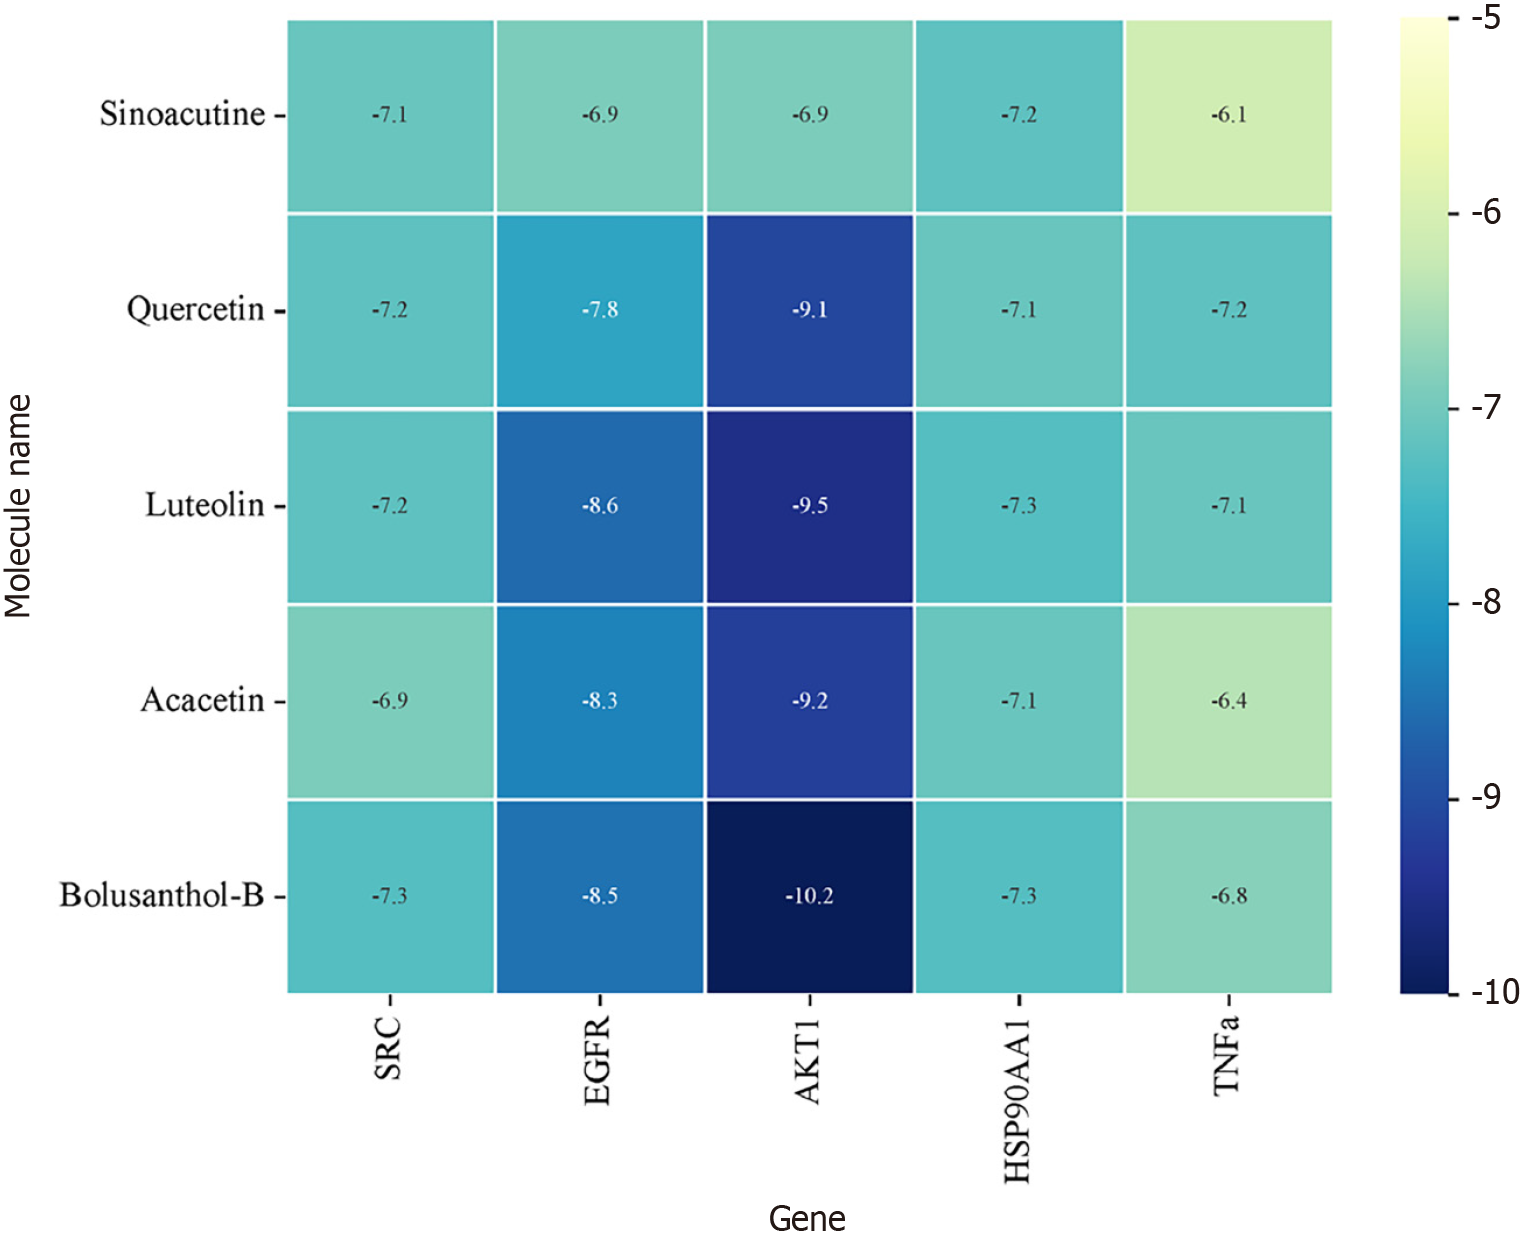
Figure 7 Heat map of molecular docking binding energy between the five core components and targets.
All five active components showed a strong binding affinity for EGFR, AKT1, TNF, HSP90AA1, and SRC. Among them, acacetin, bolusanthol B, luteolin, and quercetin exhibited the best docking effect with AKT1.
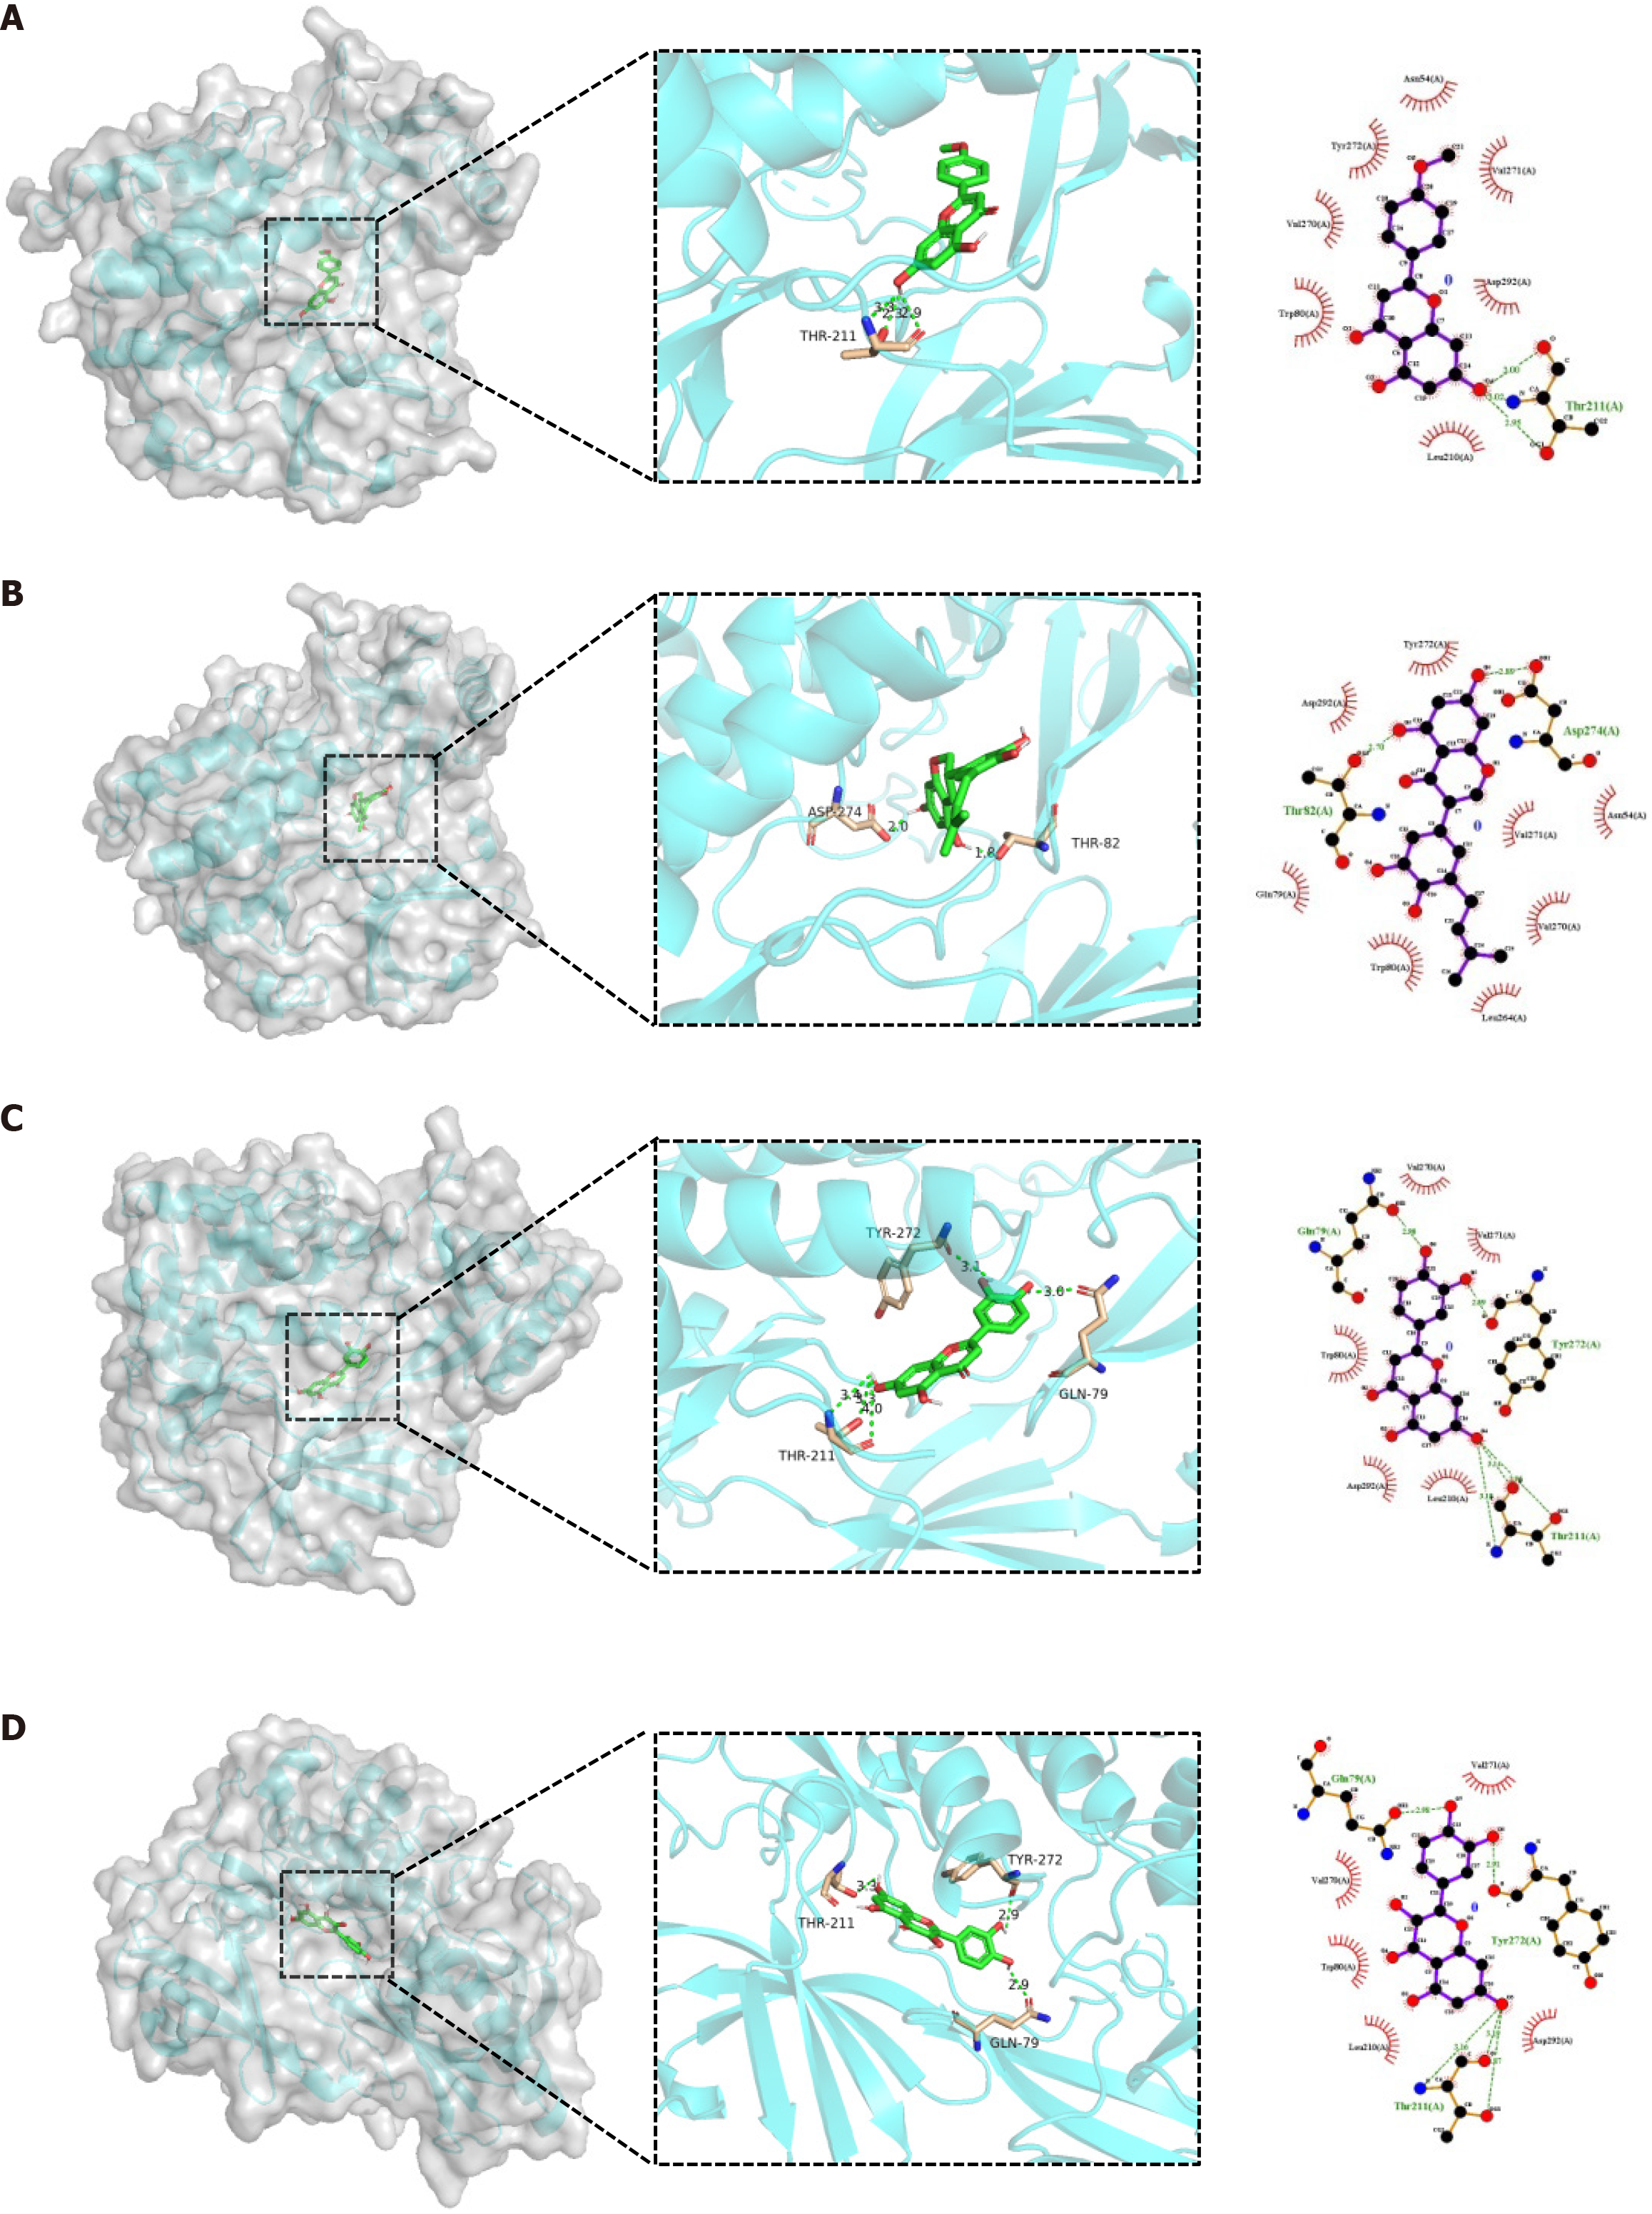
Figure 8 Molecular docking results of the core targets.
A: AKT1-Acacetin; B: AKT1-Bolusanthol B; C: AKT1-Luteolin; D: AKT1-Quercetin. The amino acid residues of the human target protein, AKT1, that interacted with luteolin and quercetin were THR-211, TYR-272, and GLN-79, and those that interacted with acacetin and bolusanthol B were THR-211, ASP-274, and THR-81, where the molecules matched well with the protein cavity. In the two-dimensional diagram of molecular interactions, the green dotted lines indicate hydrogen bonding and the red dashed lines indicate hydrophobic interactions, demonstrating directionality.
Figure 9 Acacetin markedly inhibited HT-29 cell proliferation.
A: Cell viability of HT-29 cells measured with the Cell Counting Kit-8 (CCK-8) assay after treatment with different concentrations of acacetin; B: The CCK-8 assay demonstrated that the IC50 value of HT-29 cells for acacetin was 38 μM. aP < 0.05 and bP < 0.001 compared to control cells.
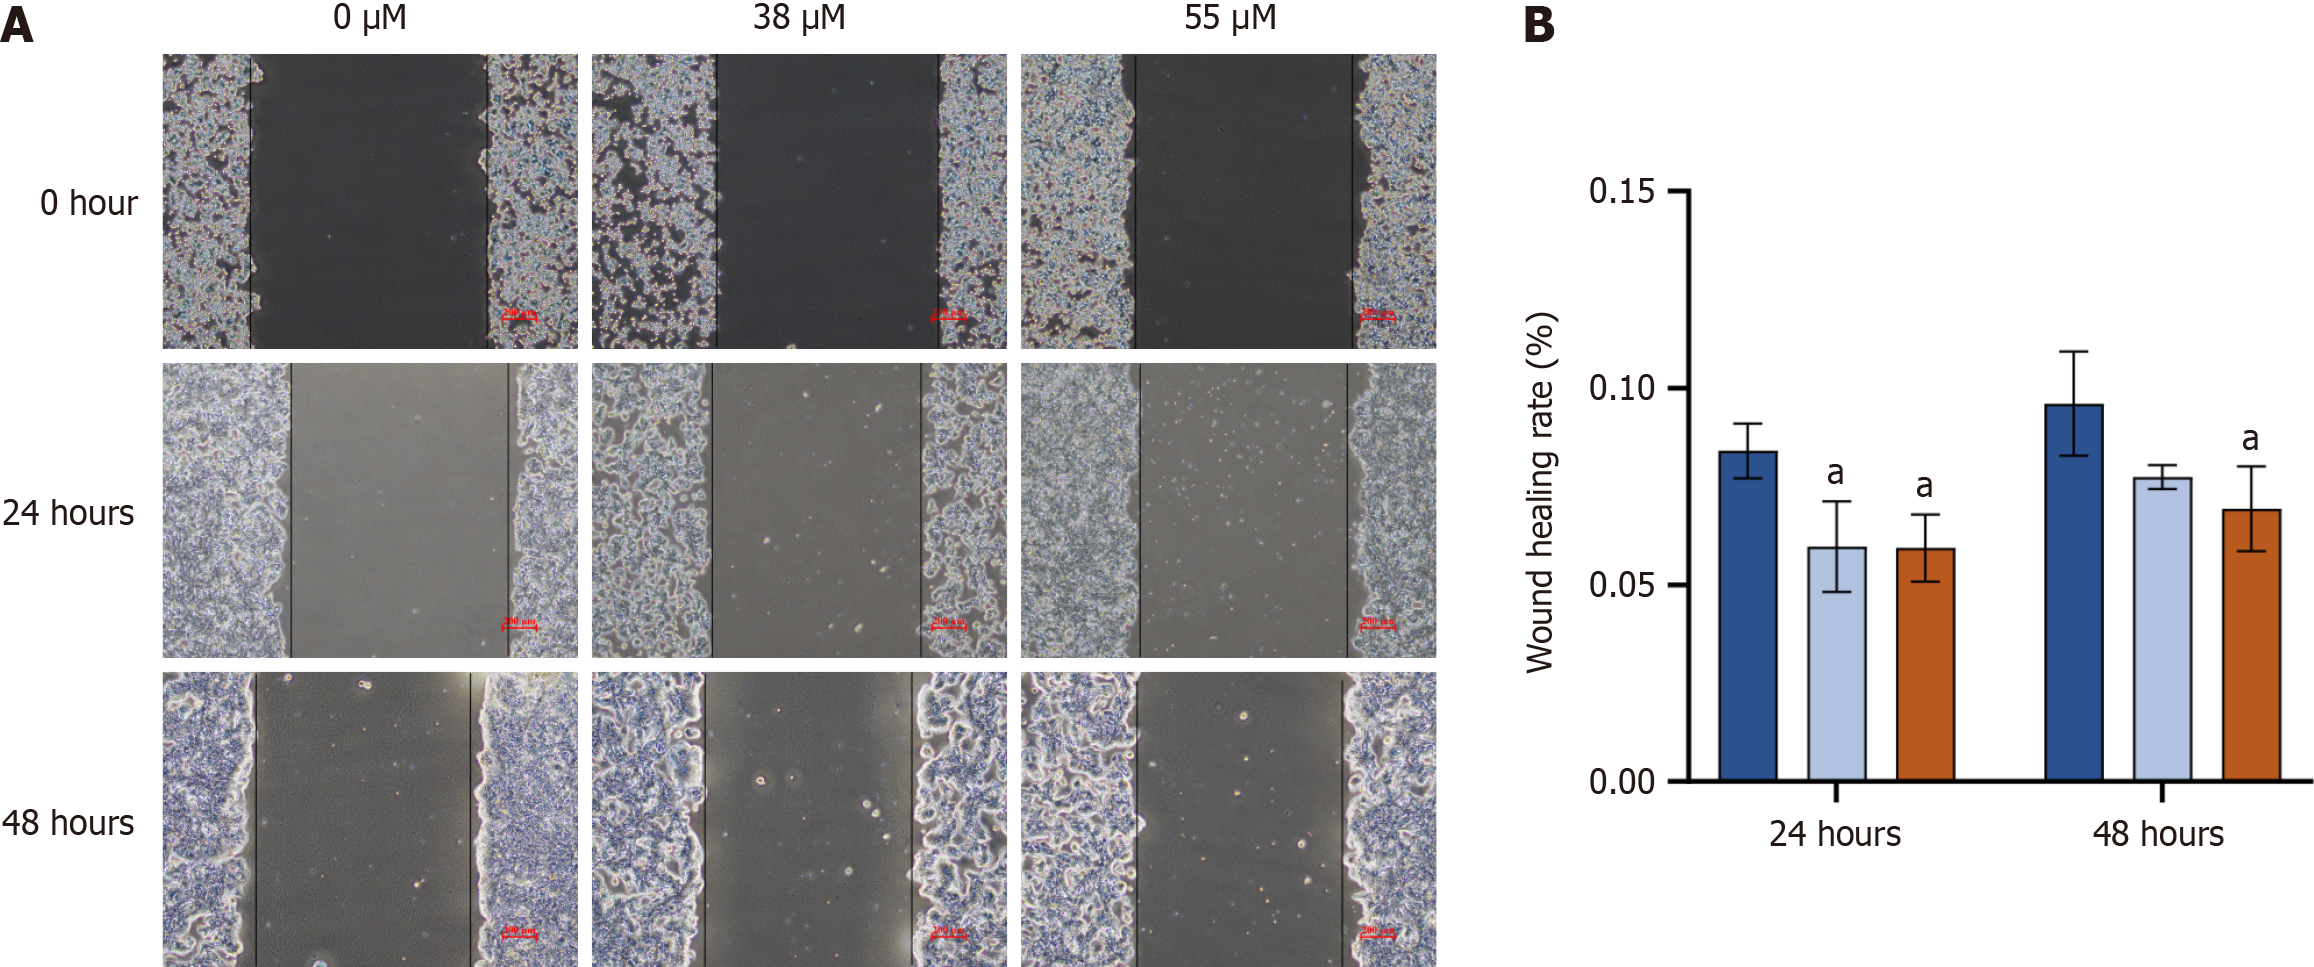
Figure 10 Acacetin suppresses HT-29 cell migration.
A: HT-29 cells were treated with various doses of acacetin (0 μM, 38 μM, and 55 μM) for 24 hours and 48 hours, and their migratory behavior analyzed using wound healing assays; B: aP < 0.05 compared to control cells.
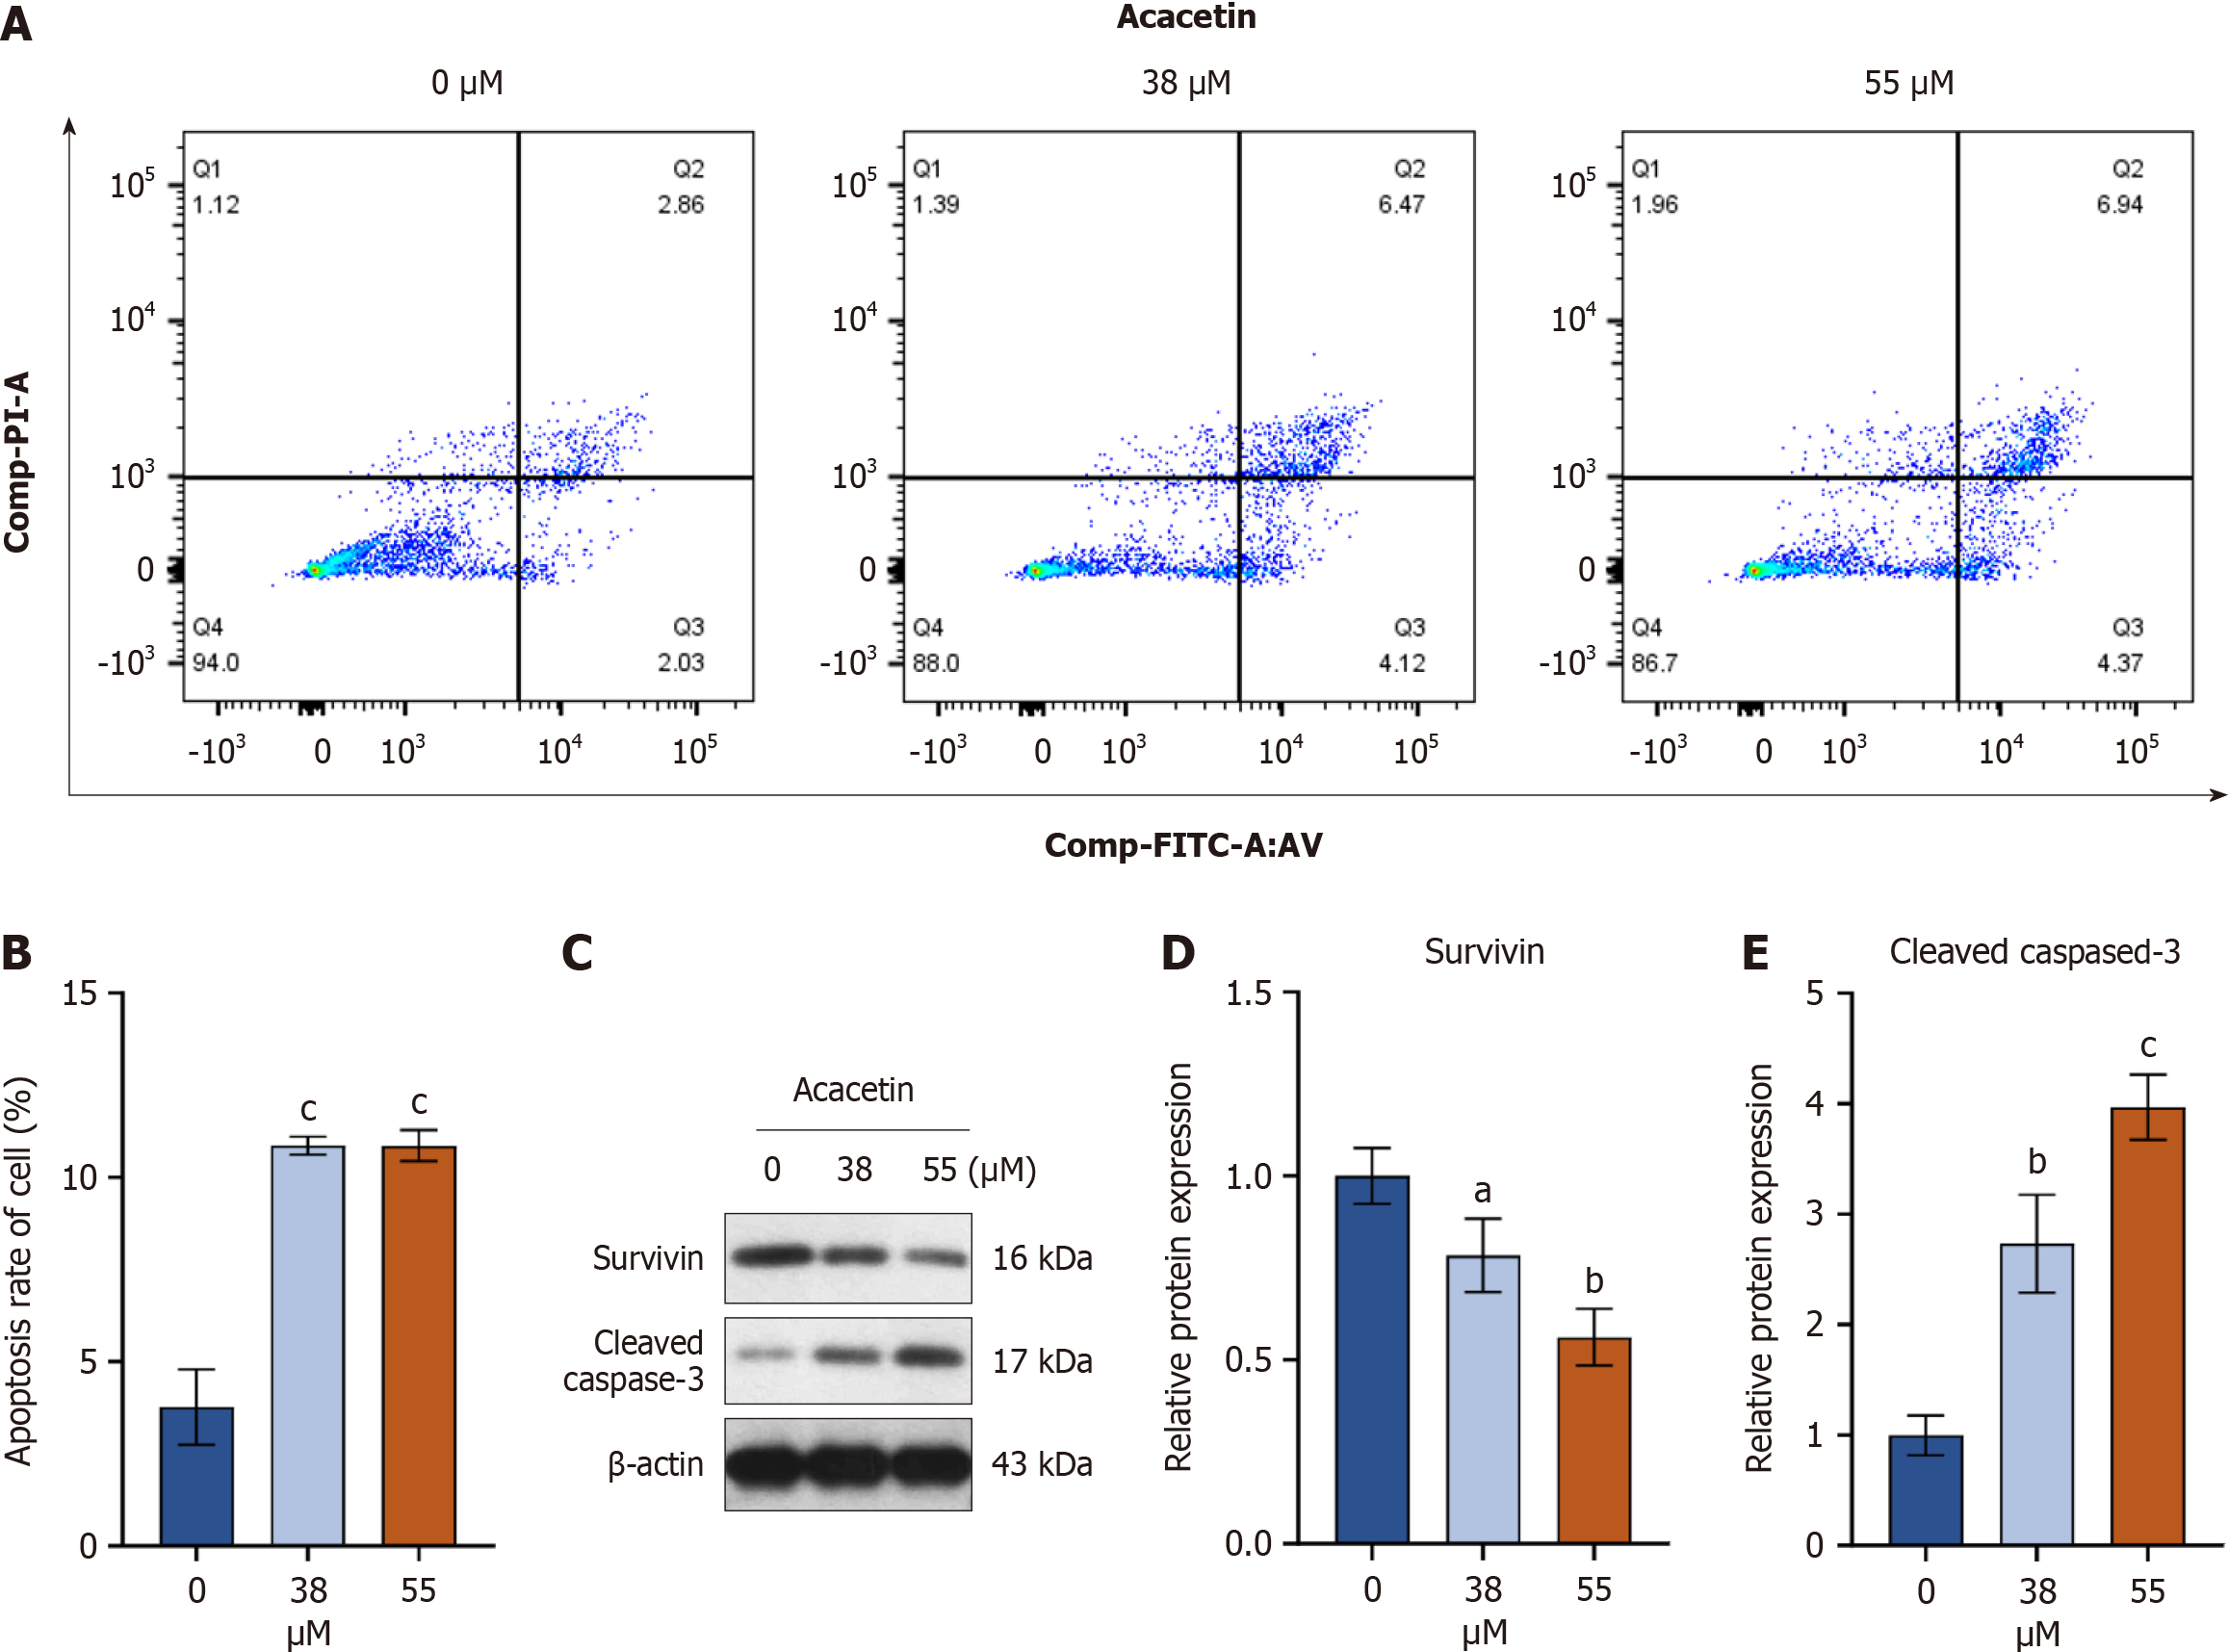
Figure 11 Acacetin promotes apoptosis in HT-29 cells.
A and B: Flow cytometry using Annexin V-FITC staining detected apoptosis in HT-29 cells treated with 38 μM and 55 μM acacetin for 48 hours; C-E: Western blotting analysis evaluating apoptosis in HT-29 cells. The results showed that Acacetin (38 μM, 55 μM) could significantly increase the expression of cleaved caspase-3 protein and inhibited Survivin protein compared with the control group. The histograms indicating statistical significance levels. aP < 0.05, bP < 0.01, cP < 0.001.
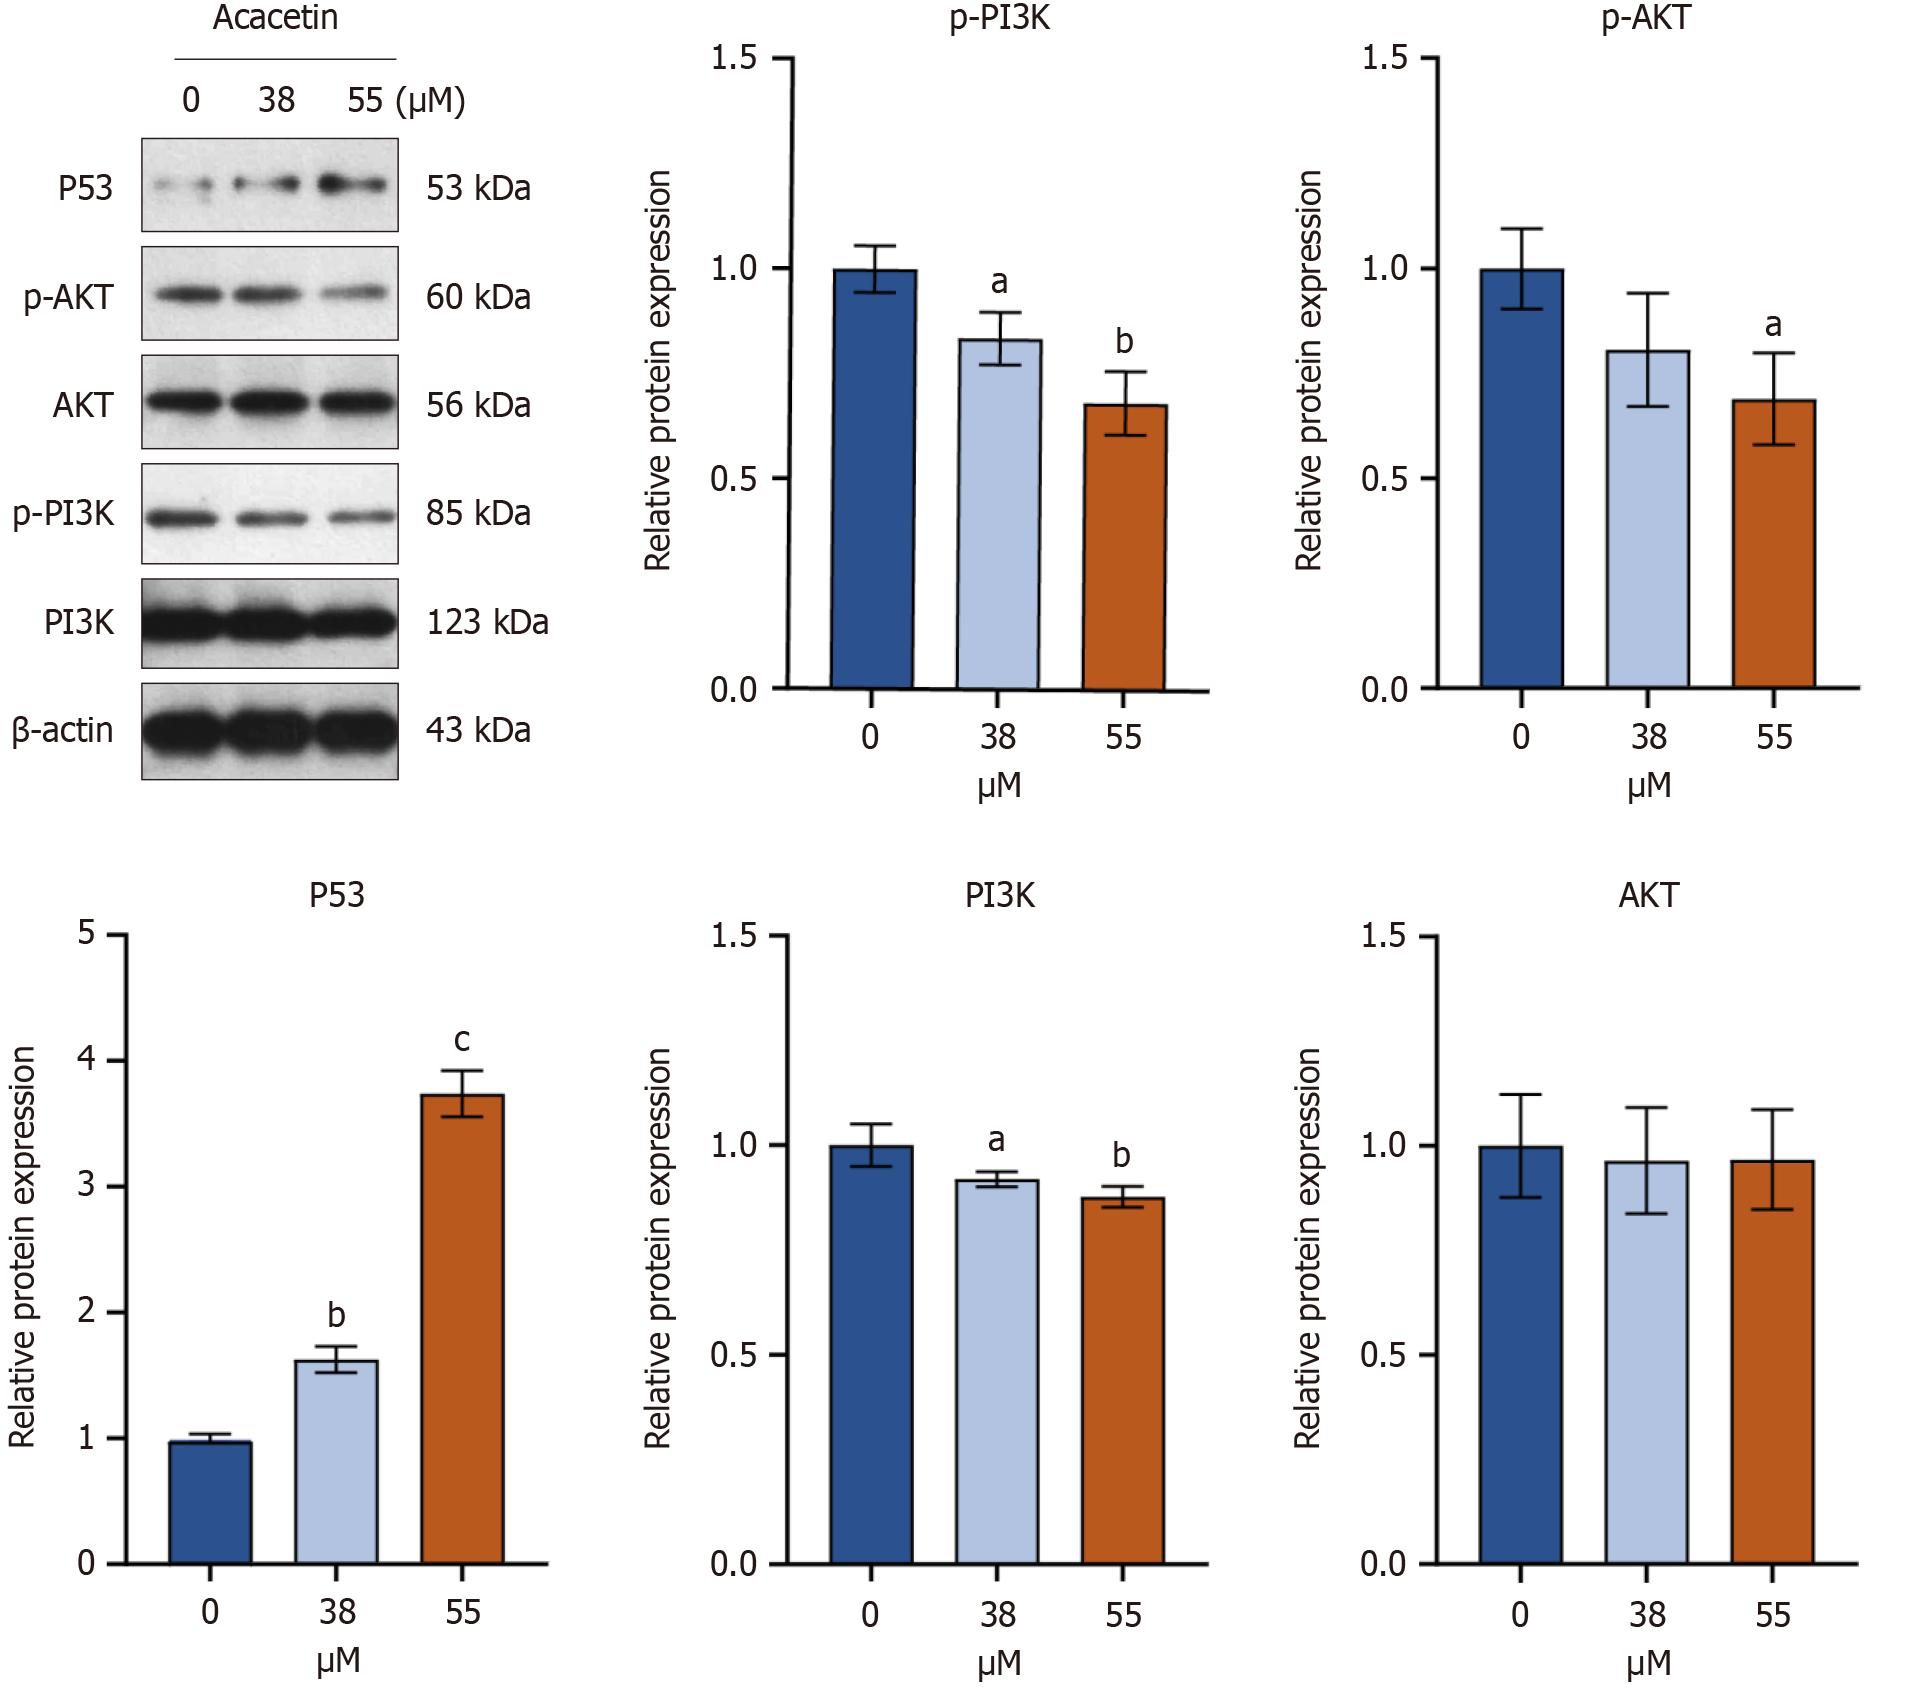
Figure 12 Acacetin inhibits HT-29 cell progression by targeting the phosphoinositide 3-kinase/Akt/p53 pathway.
Western blotting analysis was conducted on HT-29 cells treated with 38 μM and 55 μM acacetin for 48 hours, with β-actin serving as the internal reference. Data quantification was performed using ImageJ software. Statistical significance was denoted as aP < 0.05, bP < 0.01, and cP < 0.001. PI3K: Phosphoinositide 3-kinase.
- Citation: Wang CL, Yang BW, Wang XY, Chen X, Li WD, Zhai HY, Wu Y, Cui MY, Wu JH, Meng QH, Zhang N. Targeting colorectal cancer with Herba Patriniae and Coix seed: Network pharmacology, molecular docking, and in vitro validation. World J Gastrointest Oncol 2024; 16(8): 3539-3558
- URL: https://www.wjgnet.com/1948-5204/full/v16/i8/3539.htm
- DOI: https://dx.doi.org/10.4251/wjgo.v16.i8.3539


