Copyright
©The Author(s) 2024.
World J Gastrointest Oncol. Apr 15, 2024; 16(4): 1465-1478
Published online Apr 15, 2024. doi: 10.4251/wjgo.v16.i4.1465
Published online Apr 15, 2024. doi: 10.4251/wjgo.v16.i4.1465
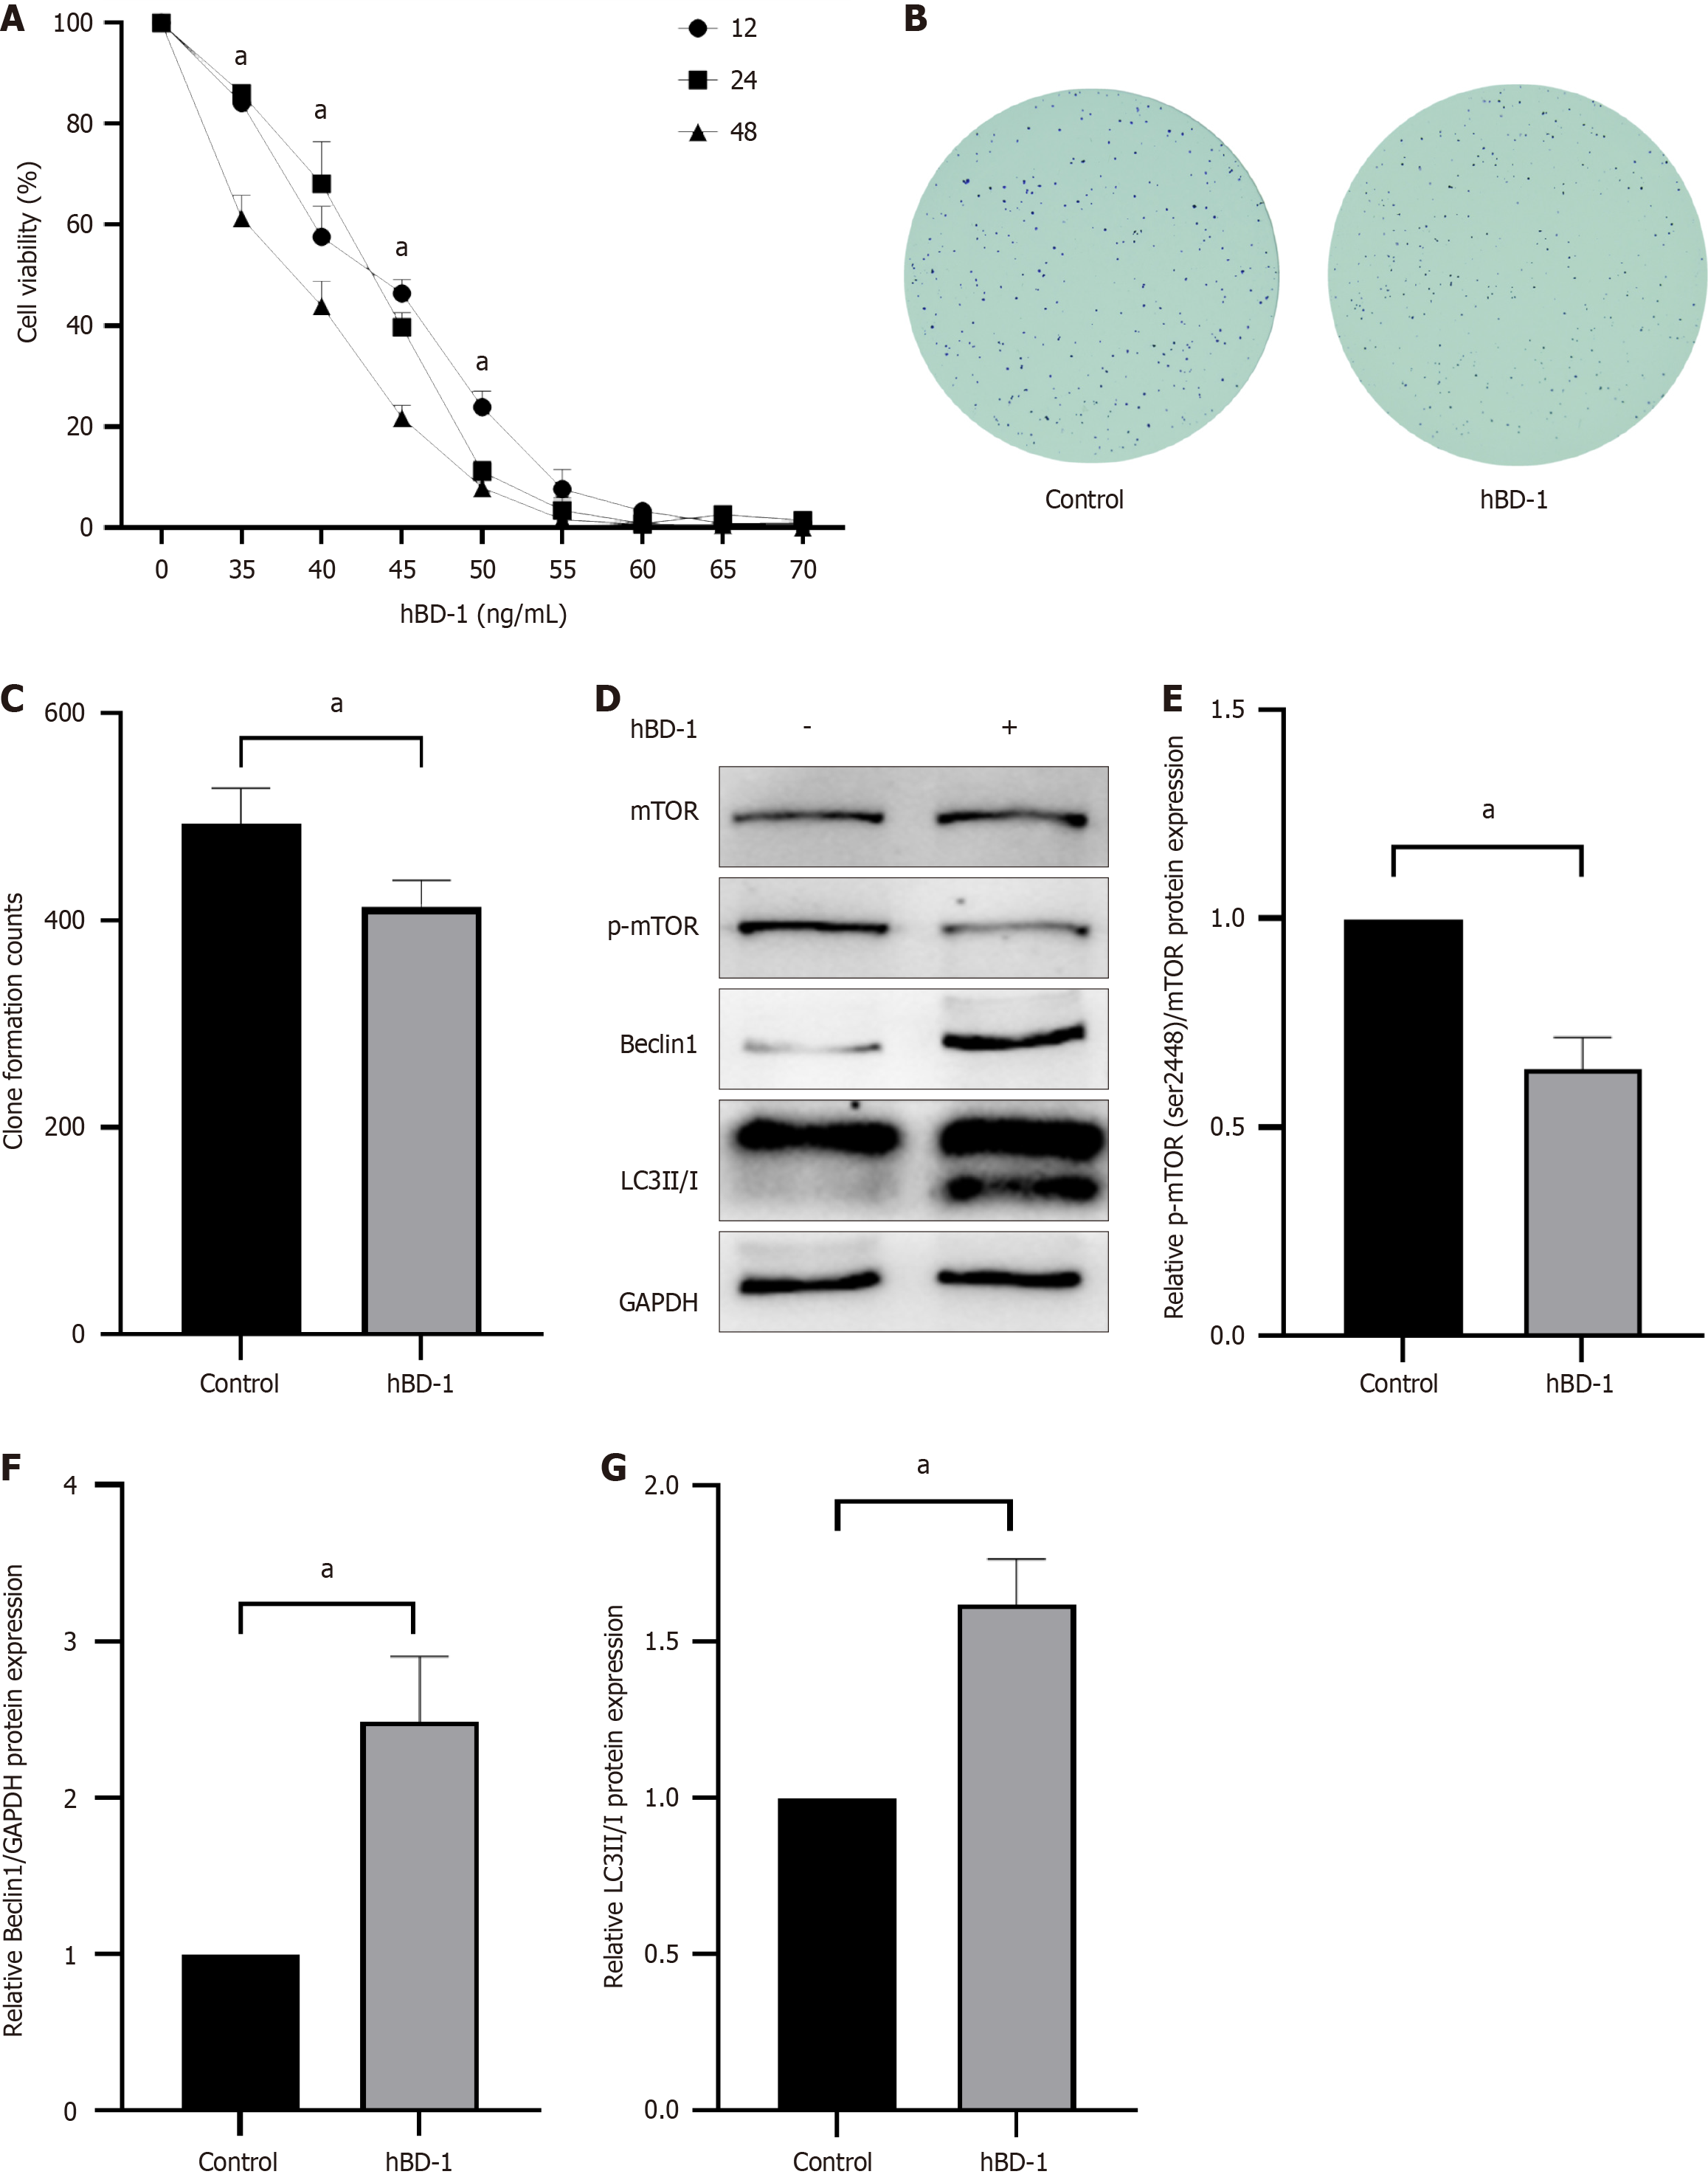
Figure 1 Human β-defensin-1 affects the viability, clonogenesis, and autophagy of SW620 cells.
A: Human β-defensin-1 (hBD-1) suppresses cell viability; B: hBD-1 inhibits clonal formation; C: Clonal formation count; D: hBD-1 inhibits phosphorylation of mTOR and promotes expression of Beclin-1 and LC3II/I; E-G: Relative expression of p-mTOR, Beclin-1, and LC3II/I. aP < 0.05 vs control group. hBD-1: Human β-defensin-1.
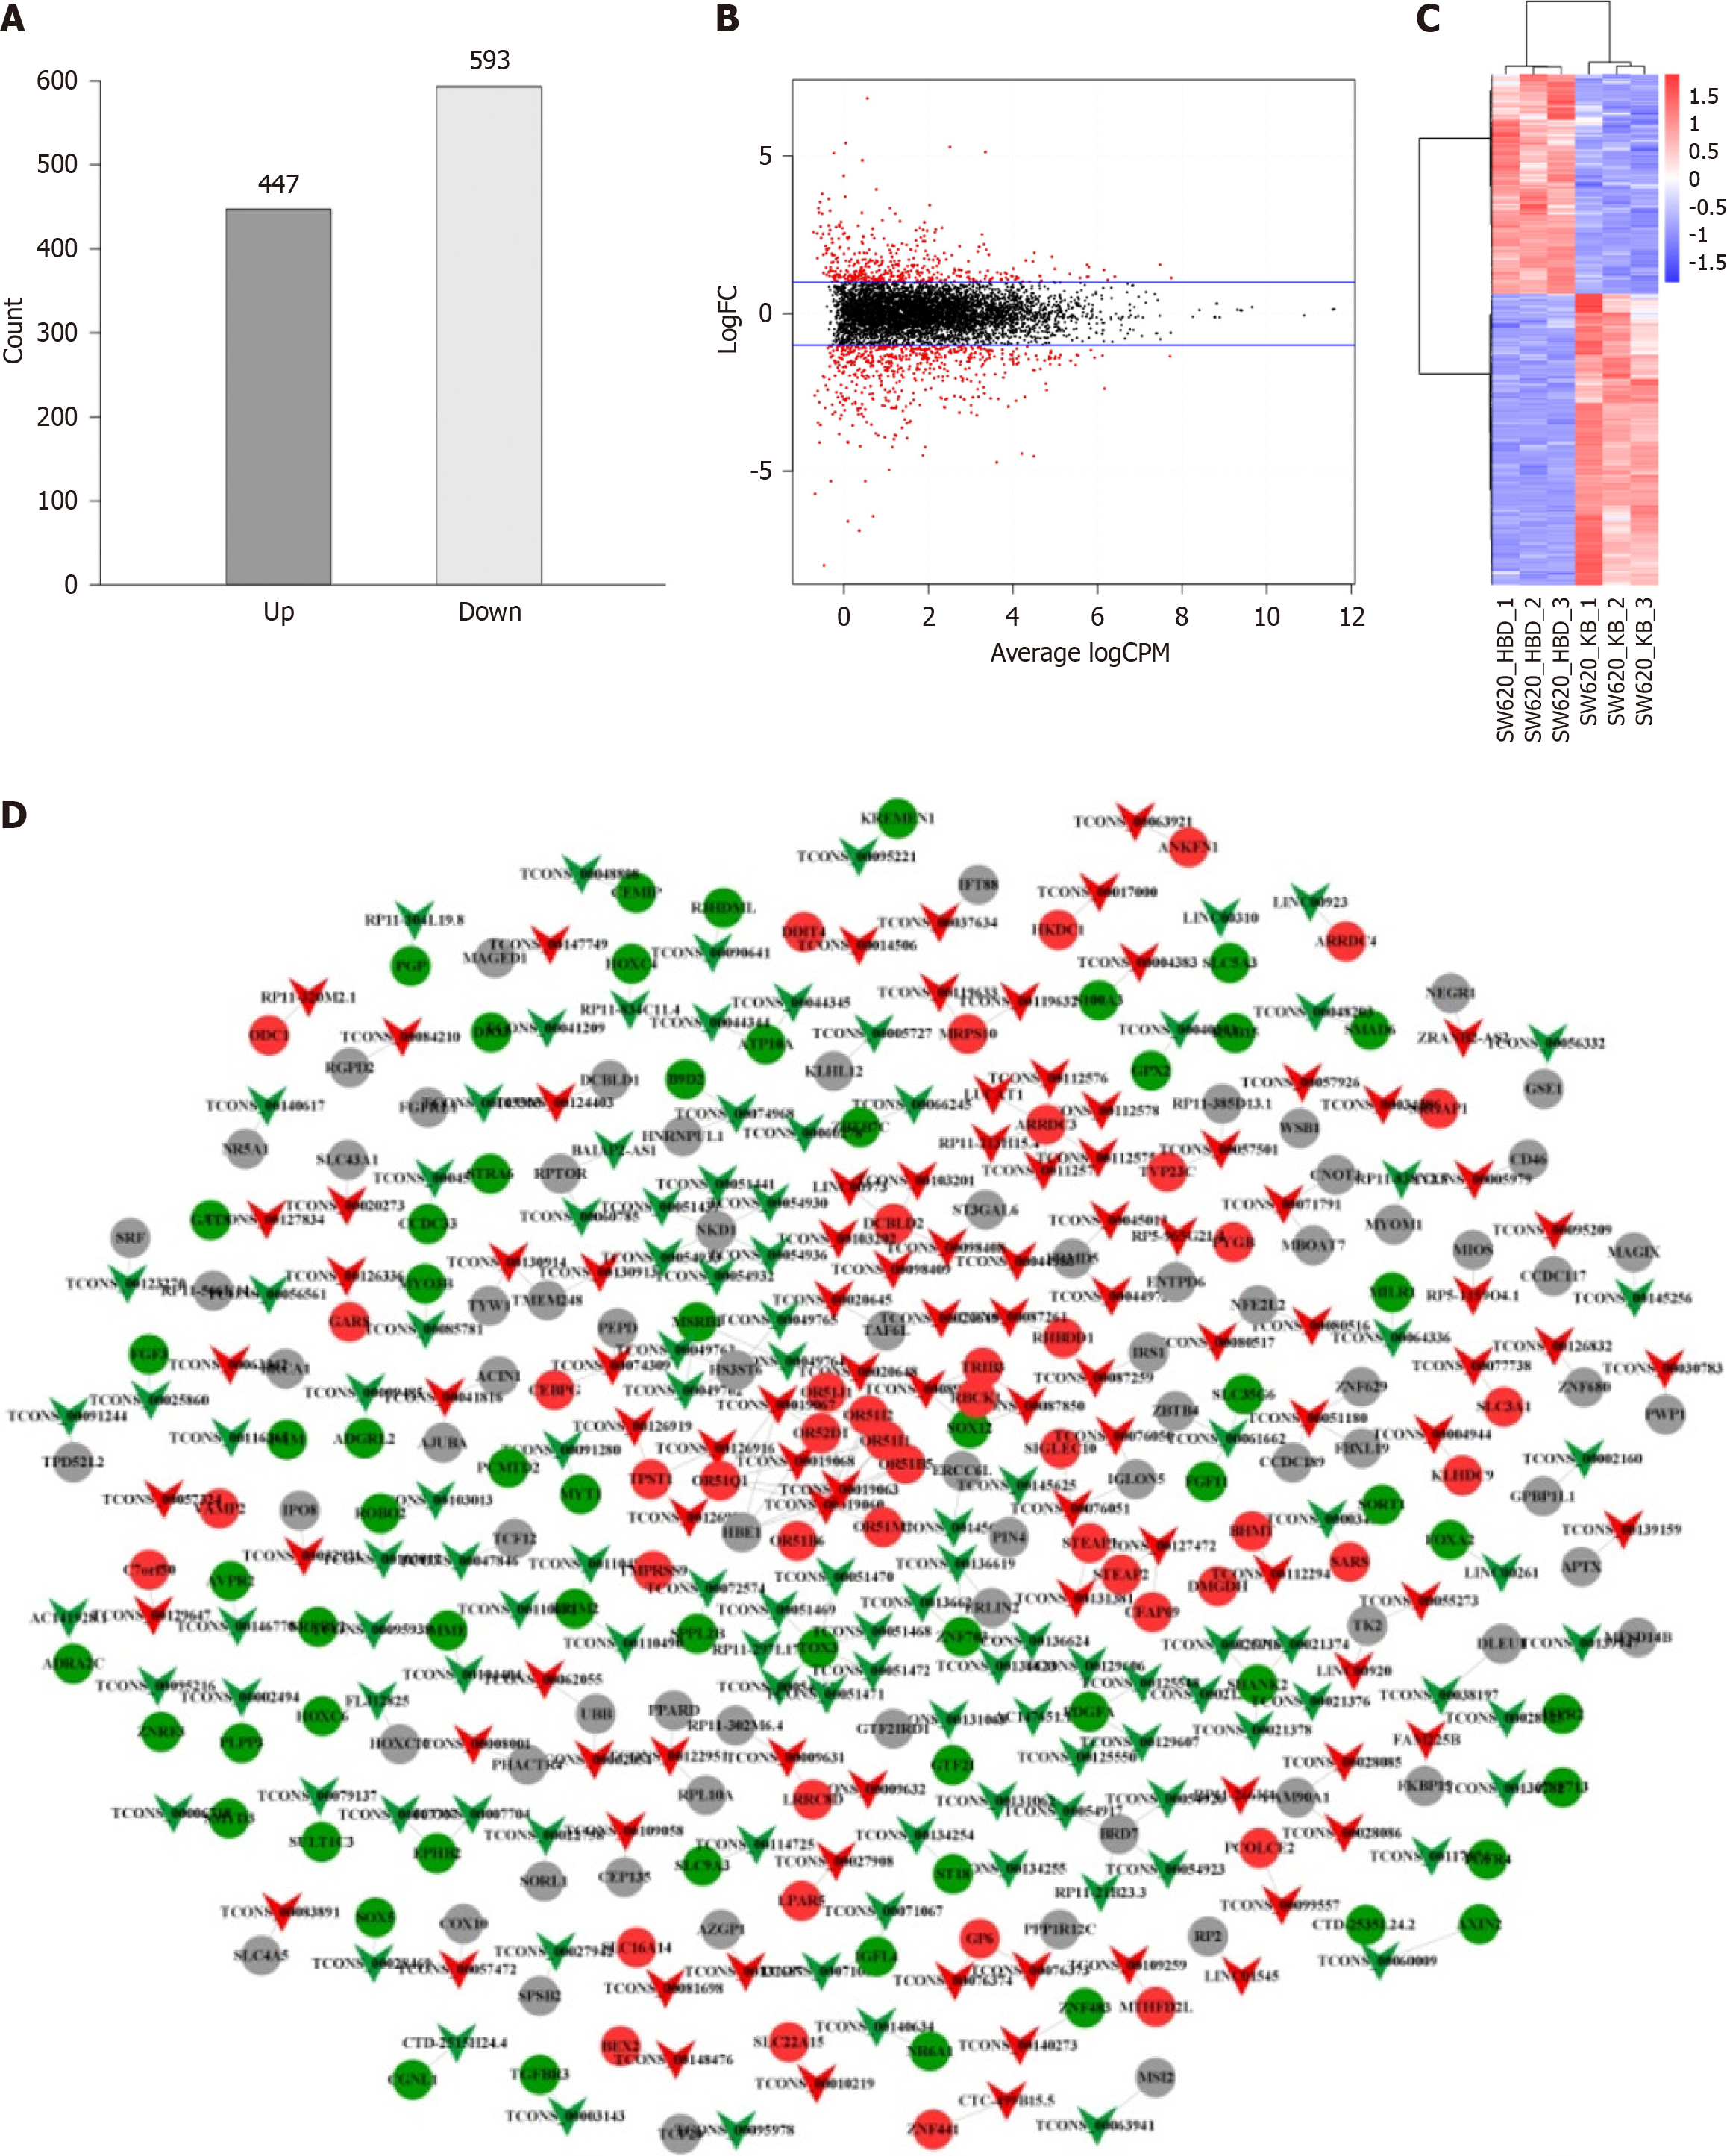
Figure 2 Differential expression analysis of long non-coding RNAs.
A: Histogram of differentially expressed long non-coding RNAs (lncRNAs); B: Volcano plot of differentially expressed lncRNAs. The two blue lines in the figure signify the threshold for downregulating genes with differential expression on the upper panel (logFC > 1 indicates upregulation and logFC < -1 indicates downregulation), where black represents no differentially expressed lncRNAs and red represents differentially expressed lncRNAs; C: Cluster analysis of differentially expressed lncRNAs. The horizontal axis denotes lncRNAs from different samples, each listed as a sample, red denotes highly expressed lncRNAs, and blue denotes lncRNAs with decreased expression. The vertical axis corresponds to gene names, where each row denotes an individual gene. The color scale is used to indicate the abundance of gene expression, with red denoting significant upregulation and blue denoting significant downregulation; D: Relationship between differentially expressed lncRNAs and mRNAs targeted. Inverted triangles denote lncRNAs, circles denote mRNAs, red denotes upregulated expression, green denotes downregulated expression, and gray denotes no difference in expression.
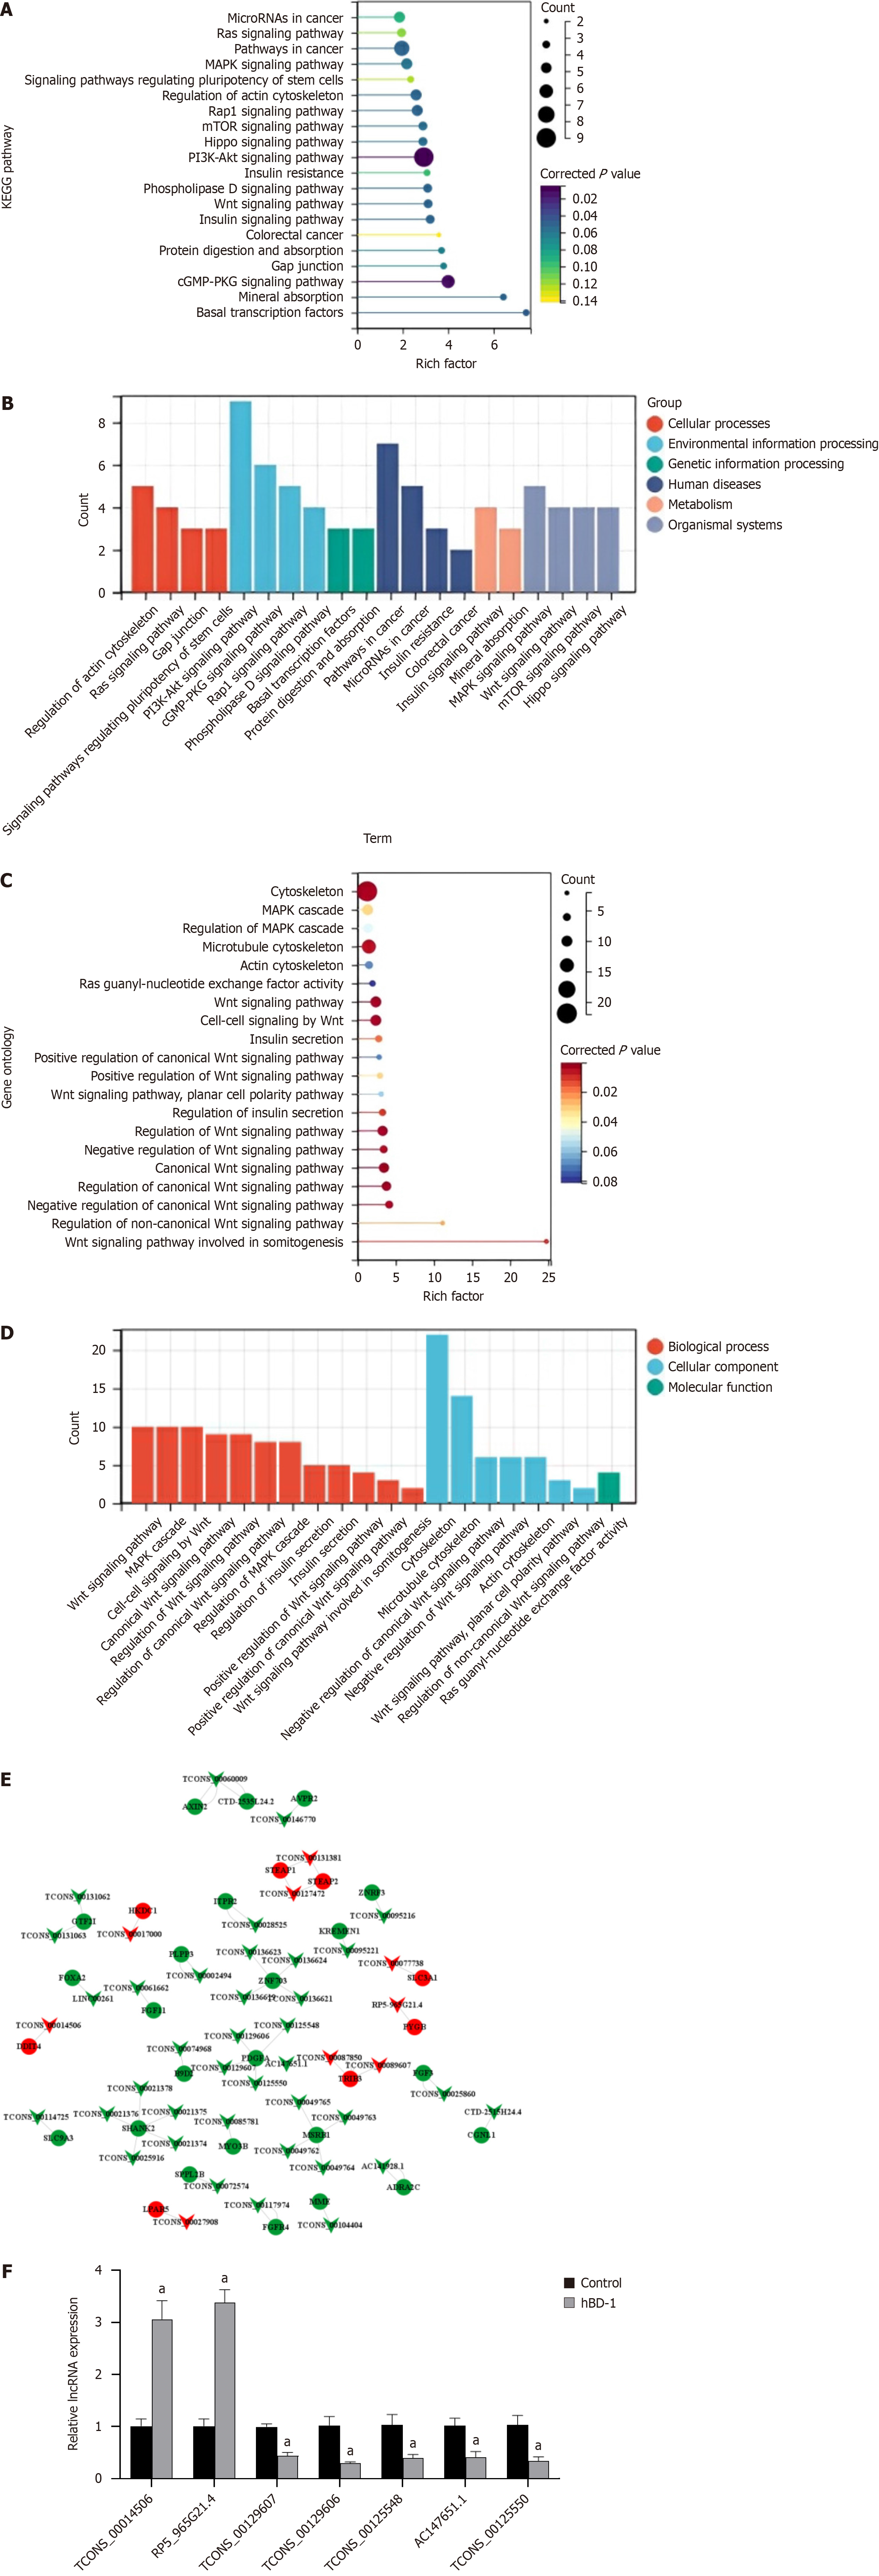
Figure 3 Bioinformatics analysis of differentially expressed long non-coding RNAs and selection of the target long non-coding RNA.
A: KEGG pathway enrichment analysis. The bubble size denotes the number of long non-coding RNAs (lncRNAs) target genes enriched in this pathway. Larger bubbles denote a higher number of target genes associated with the pathway. Darker color indicates more significant enrichment. The abscissa count indicates the number of genes in this pathway, and the ordinate signifies the KEGG pathway; B: GO pathway enrichment analysis. Bubble size signifies the number of lncRNA target genes enriched in this pathway, with a larger bubble indicating a larger number of target genes. Darker color indicates more significant enrichment. The abscissa count denotes the number of target genes, and the ordinate denotes a GO term; C: Co-expression analysis of differentially expressed lncRNAs and differentially expressed mRNAs. Inverted triangles indicate lncRNAs, circles indicate mRNAs, red color indicates upregulated expression, and green color indicates downregulated expression; D: KEGG pathways classification analysis. From left to right are cellular processes, environmental information processing, genetic information processing, and human diseases, metabolism, organismal systems; E: GO pathways classification analysis. Red parts indicate biological processes, blue parts indicate cellular components, and green parts indicate molecular function; F: LncRNA expression was detected via qRT-PCR. aP < 0.05 vs control group. hBD-1: Human β-defensin-1.
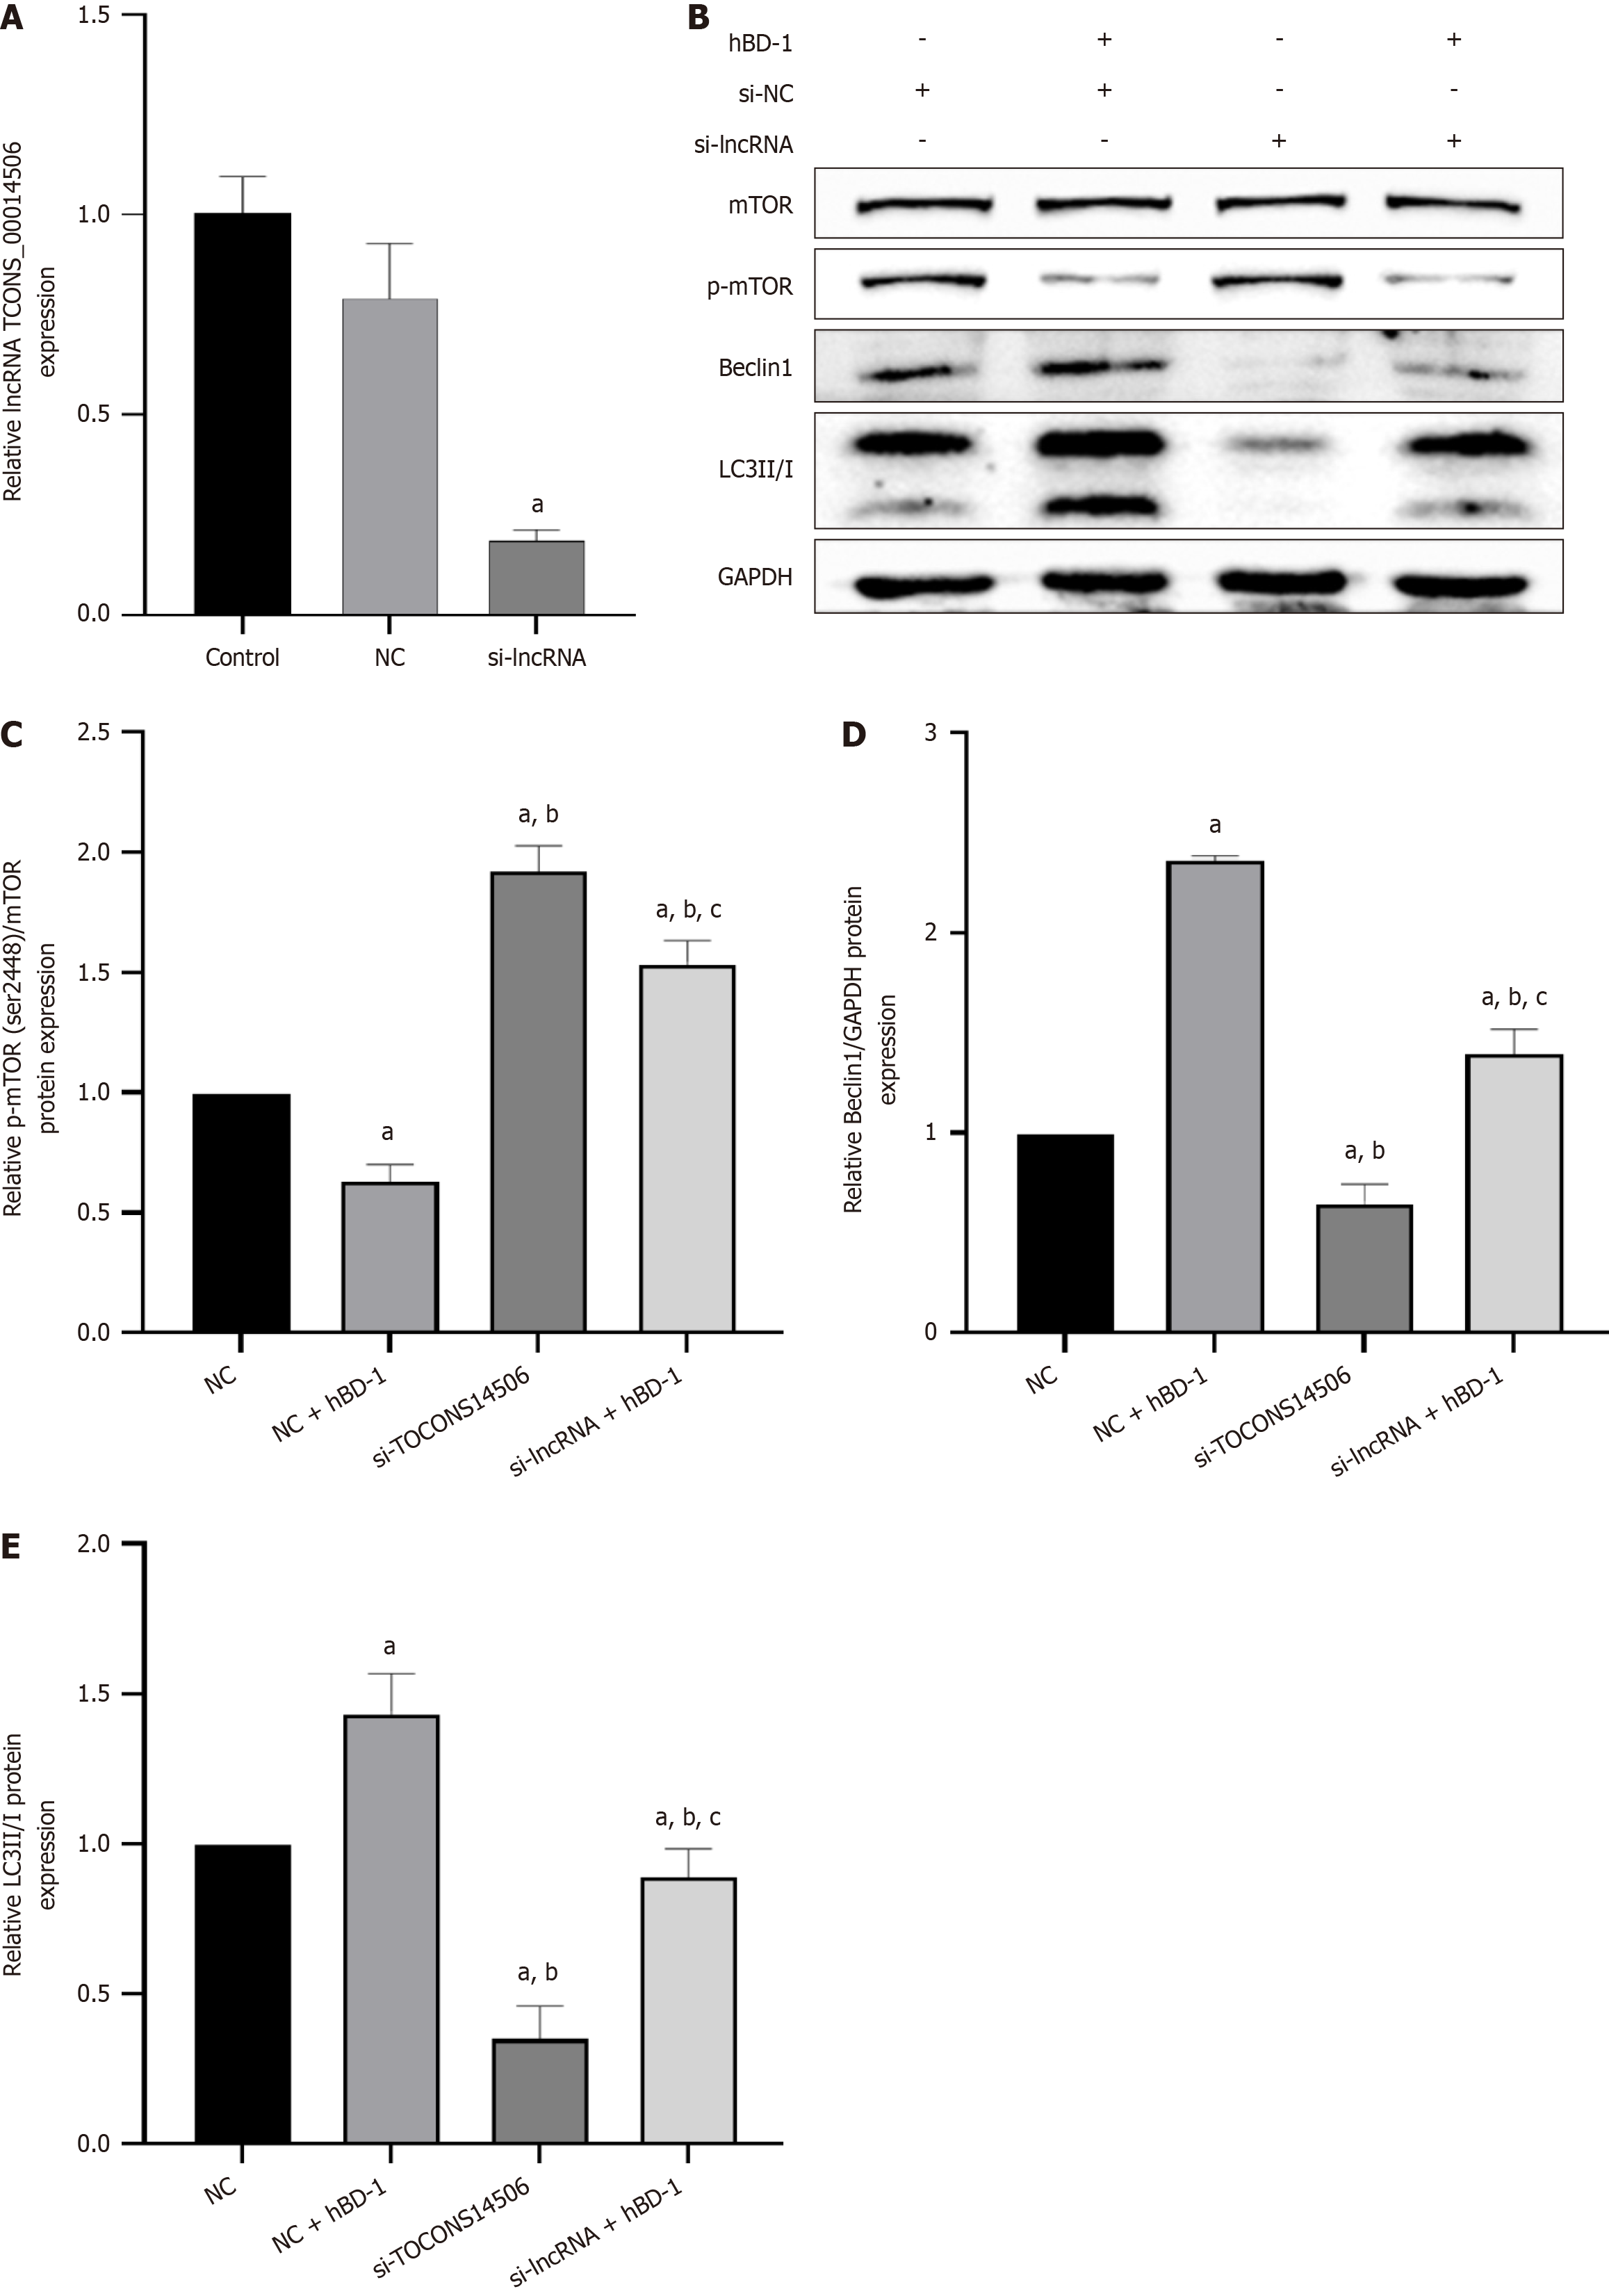
Figure 4 Human β-defensin-1 inhibits phosphorylation of mTOR and promotes autophagy in SW620 cells through long non-coding RNA TCONS_14506.
A: Long non-coding RNA (lncRNA) TCONS_00014506 expression at RNA level; B: Western blot analysis demonstrated the protein expression levels of p-mTOR (Ser2448), Beclin-1, and LC3II/I; C-E: Relative expression of p-mTOR, Beclin-1, and LC3II/I. aP < 0.05 vs control group; bP < 0.05 vs human β-defensin-1 group; cP < 0.05 vs si-lncRNA group. P < 0.05 was considered statistically significant. hBD-1: Human β-defensin-1; lncRNA: Long non-coding RNA.
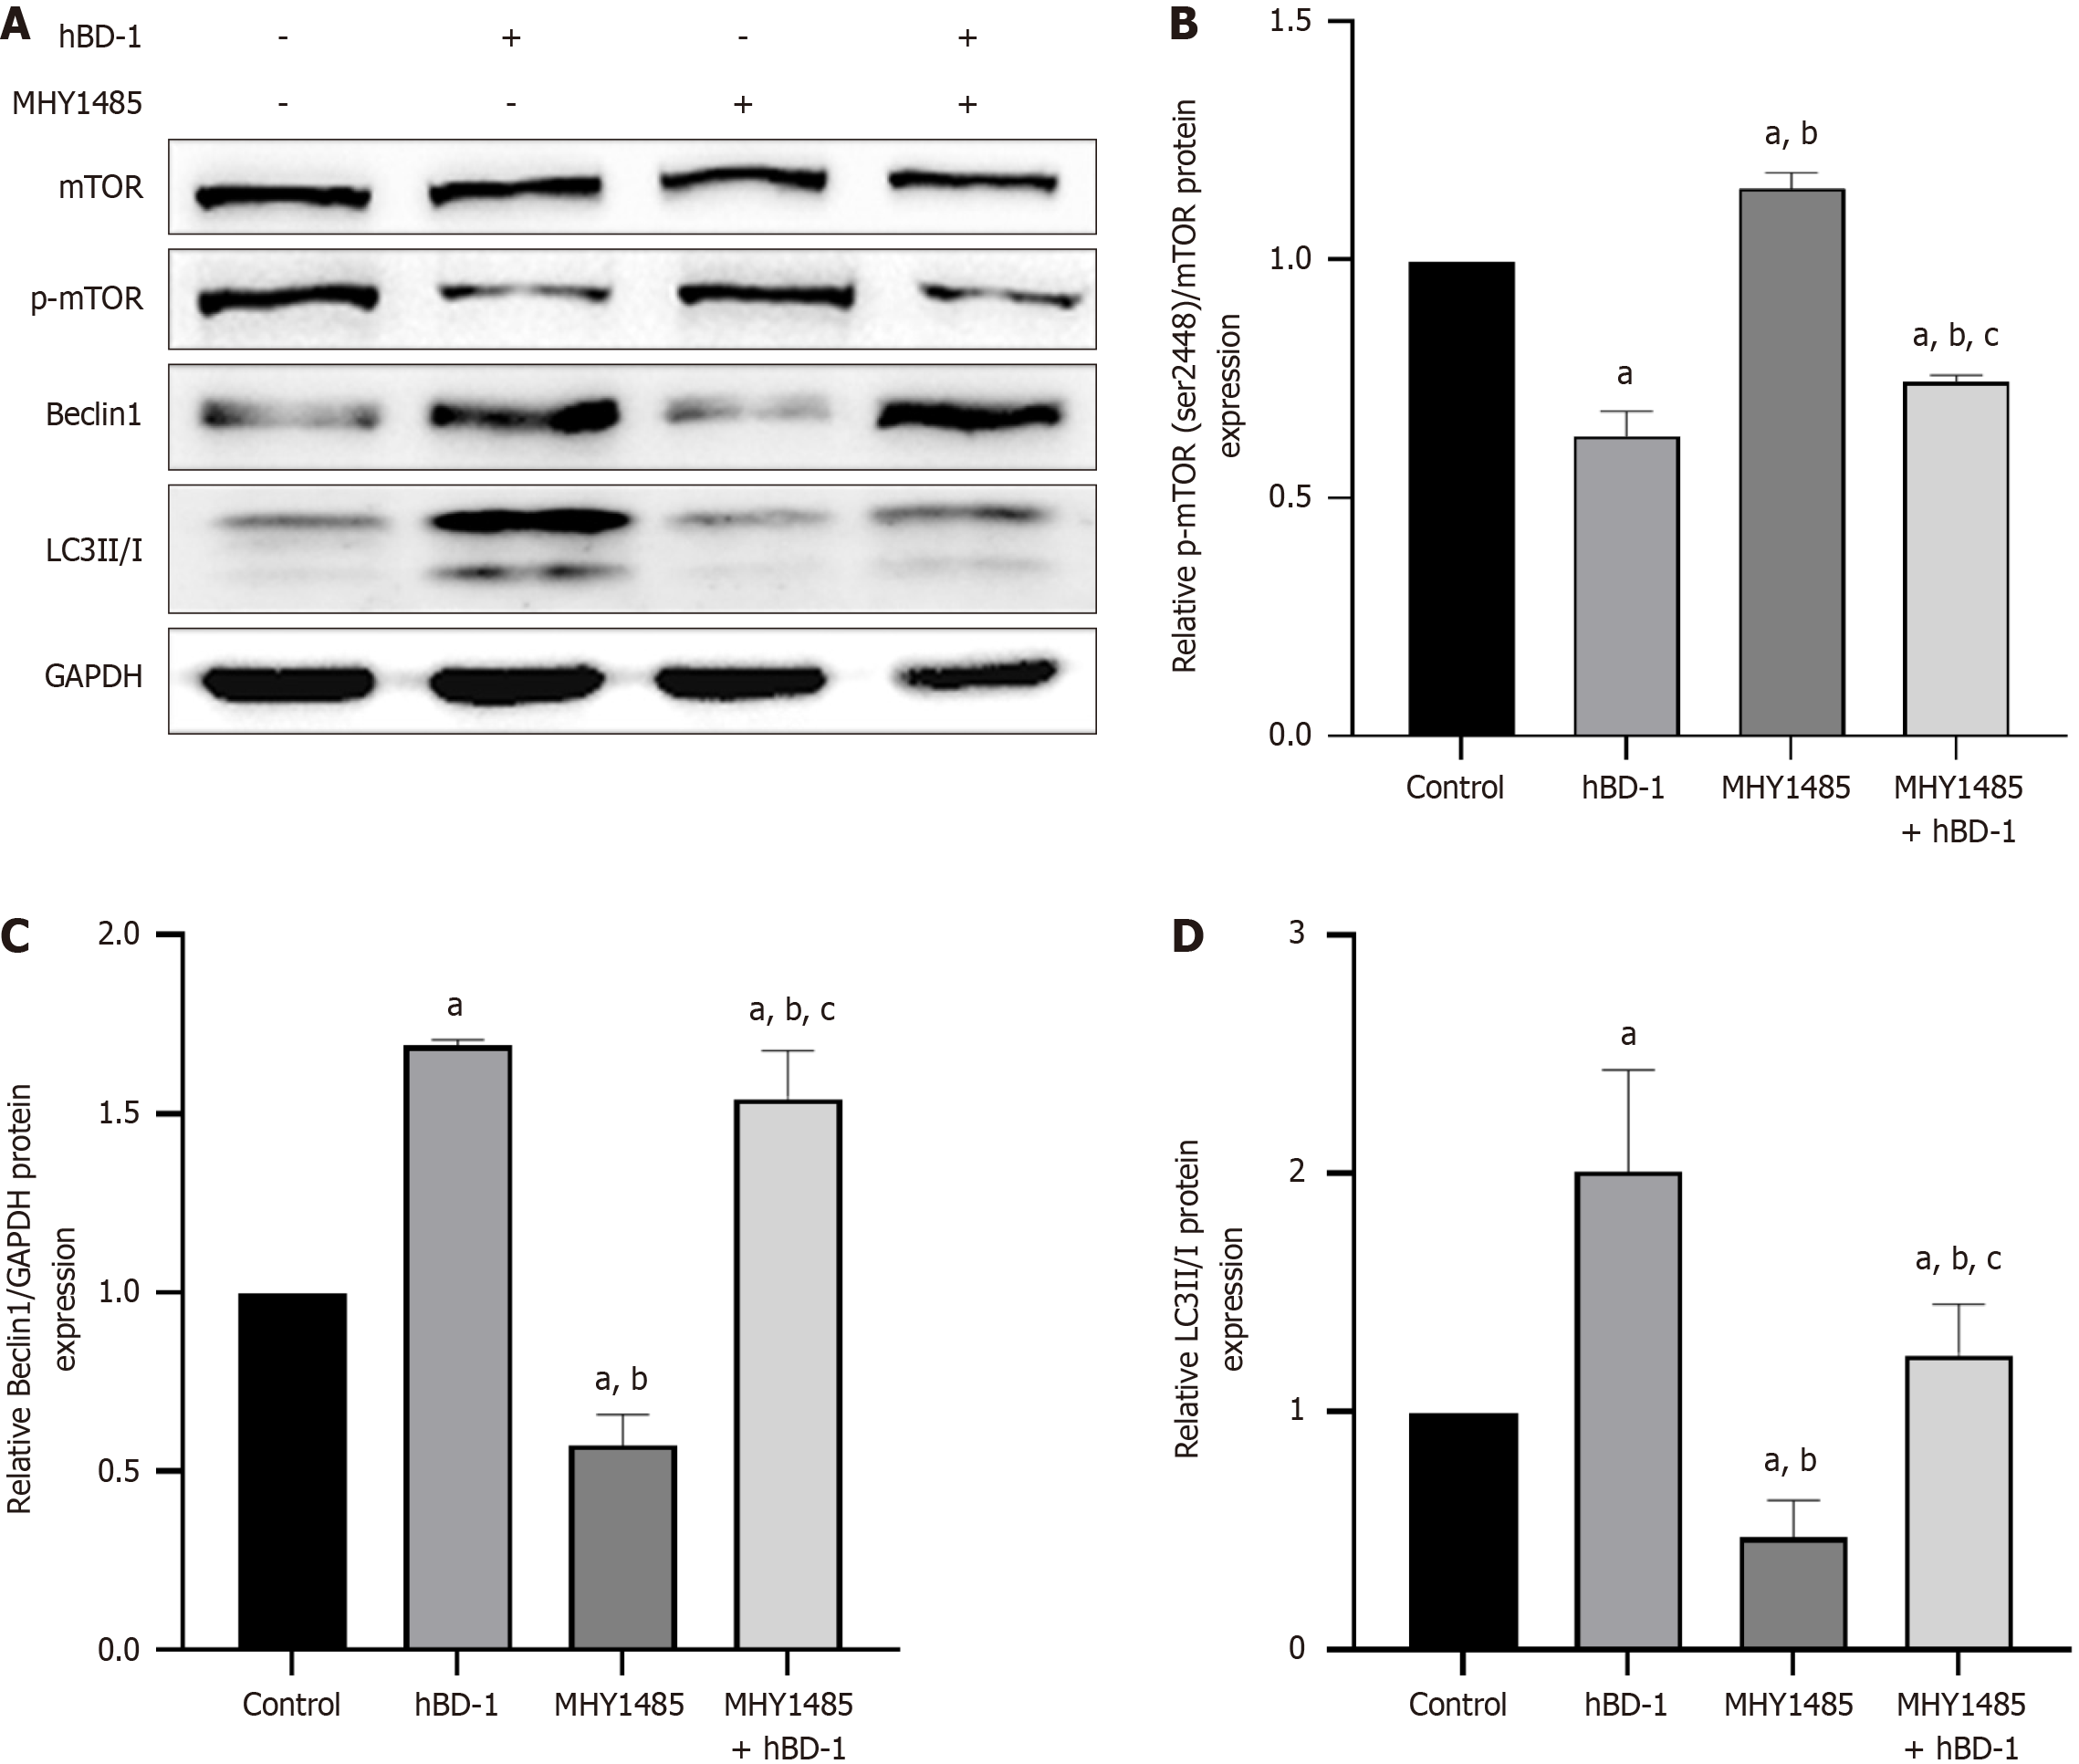
Figure 5 Human β-defensin-1 inhibits phosphorylated mTOR expression in SW620 cells.
A: Western blot analysis demonstrated that the addition of MHY1485 (mTOR activator) increased p-mTOR (Ser2448) expression and reduced Beclin-1 and LC3II/I expression in SW620 cells; B-D: Relative expression of p-mTOR, Beclin-1, and LC3II/I. aP < 0.05 vs control group; bP < 0.05 vs human β-defensin-1 group; cP < 0.05 vs MHY1485 group. P < 0.05 was considered statistically significant.
- Citation: Zhao YX, Cui Y, Li XH, Yang WH, An SX, Cui JX, Zhang MY, Lu JK, Zhang X, Wang XM, Bao LL, Zhao PW. Human β-defensin-1 affects the mammalian target of rapamycin pathway and autophagy in colon cancer cells through long non-coding RNA TCONS_00014506. World J Gastrointest Oncol 2024; 16(4): 1465-1478
- URL: https://www.wjgnet.com/1948-5204/full/v16/i4/1465.htm
- DOI: https://dx.doi.org/10.4251/wjgo.v16.i4.1465


