Copyright
©The Author(s) 2024.
World J Gastrointest Oncol. Apr 15, 2024; 16(4): 1384-1420
Published online Apr 15, 2024. doi: 10.4251/wjgo.v16.i4.1384
Published online Apr 15, 2024. doi: 10.4251/wjgo.v16.i4.1384
Figure 1 Construction and validation of a diagnostic nomogram.
A: A nomogram to estimate the risk of distant metastasis in duodenal carcinoma patients; B: The receiver operating characteristic curve of the training set; C: The calibration curve of the training set; D: The decision curve analysis of the training set; E: The receiver operating characteristic curve of the validation set; F: The calibration curve of the validation set; G: The decision curve analysis of the validation set. AUC: Area under the curve.
Figure 2 Comparison of area under the receiver operating characteristic curves between nomogram and all independent factors, including Grade, T stage, N stage, Size and Sex.
A: In the training set; B: In the validation set.
Figure 3 Validating the diagnostic nomogram in the expanded testing set.
A: The receiver operating characteristic curve of the expanded testing set; B: The calibration curve of the expanded testing set; C: The decision curve analysis of the expanded testing set; D: Comparison of area under the receiver operating characteristic curves between nomogram and all independent factors, including sex, T stage, tumor size, grade stage.
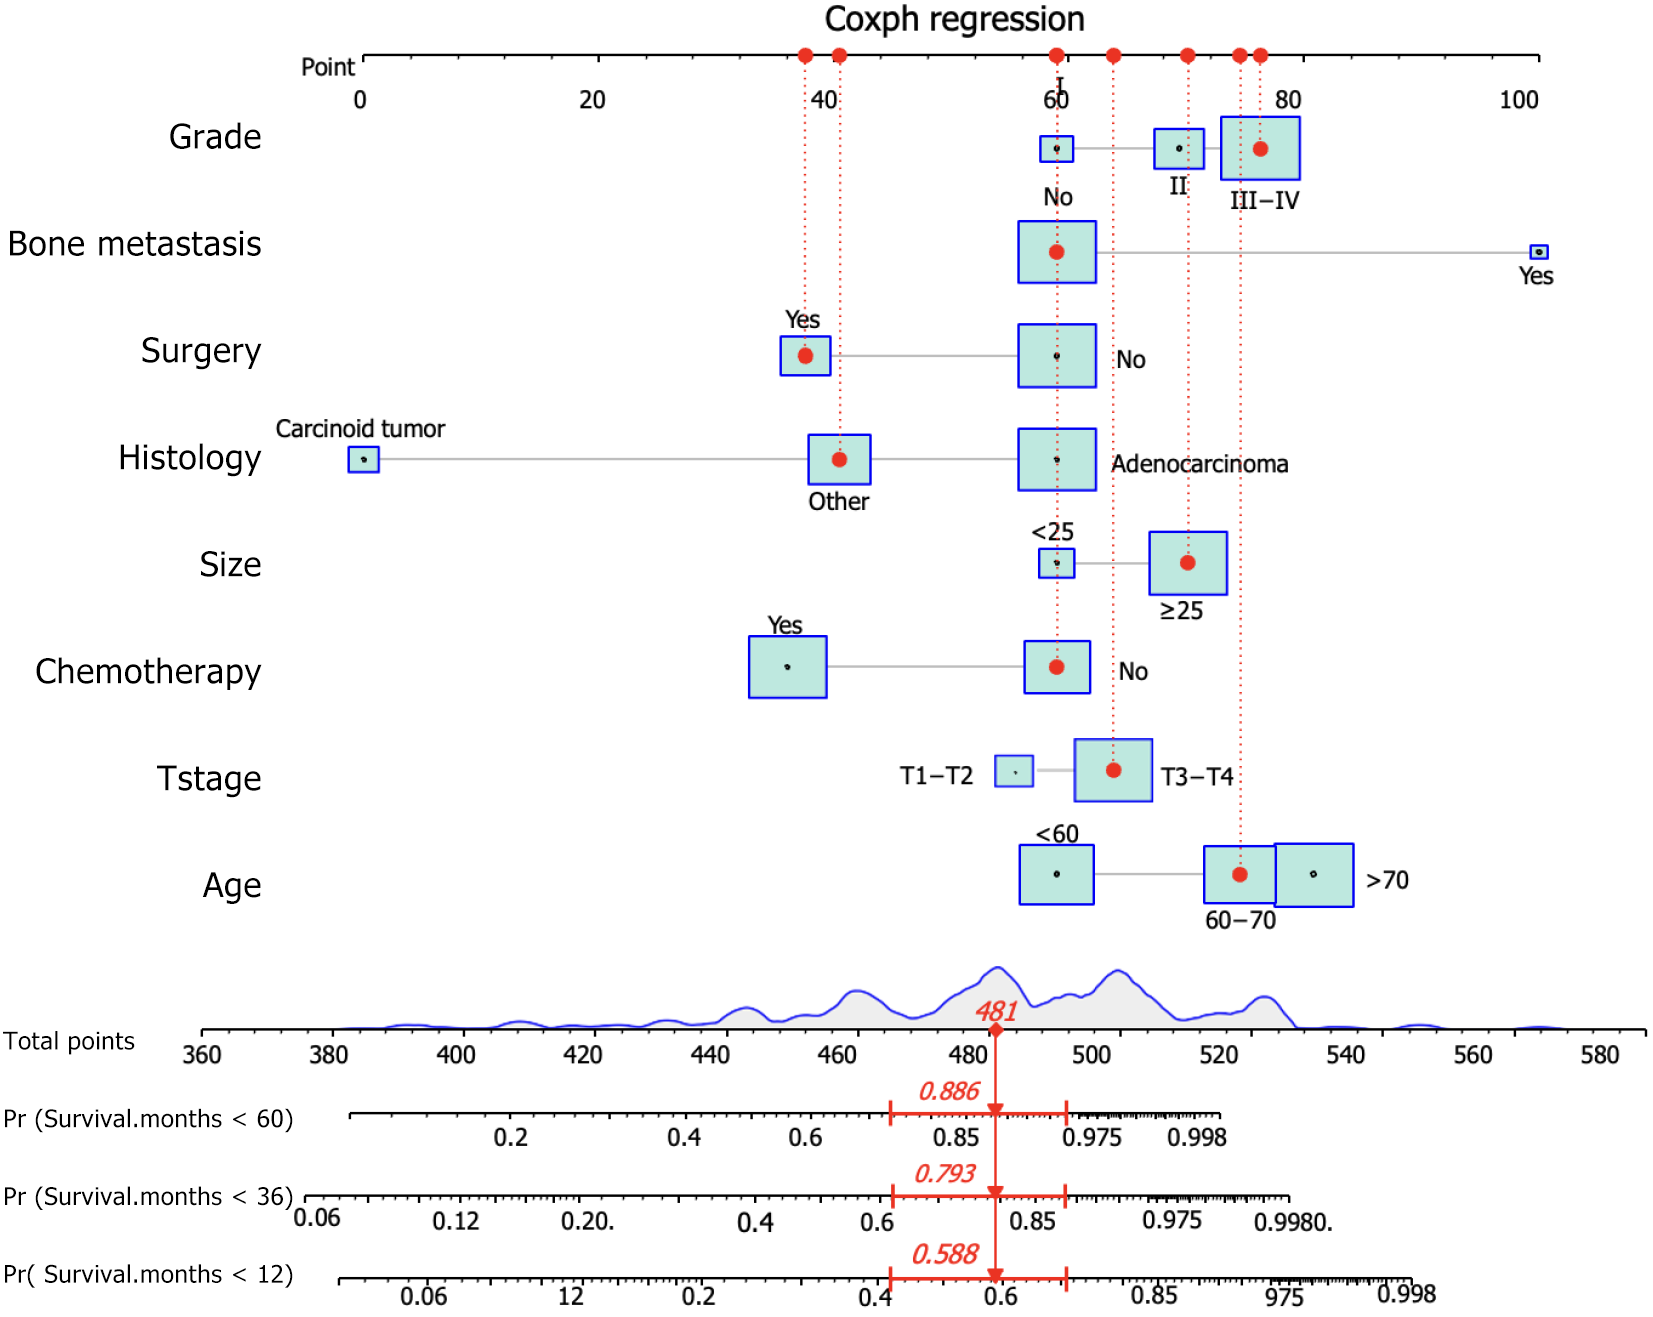
Figure 4 A prognostic nomogram for predicting the overall survival of duodenal carcinoma patients with distant metastasis for the 12, 36, and 60 months.
Figure 5 Calibration and decision curves for 12, 36, and 60 months in the training set.
A: The calibration curves of the nomogram for the 12 months in the training set; B: The calibration curves of the nomogram for the 36 months in the training set; C: The calibration curves of the nomogram for the 60 months in the training set; D: The decision curve analysis of the nomogram for the 12 months in the training set; E: The decision curve analysis of the nomogram for the 36 months in the training set; F: The decision curve analysis of the nomogram for the 60 months in the training set.
Figure 6 Calibration and decision curve analysis for nomogram at 12, 36, and 60 months in the validation set.
A: The calibration curves of the nomogram for the 12 months in the validation set; B: The calibration curves of the nomogram for the 36 months in the validation set; C: The calibration curves of the nomogram for the 60 months in the validation set; D: The decision curve analysis of the nomogram for the 12 months in the validation set; E: The decision curve analysis of the nomogram for the 36 months in the validation set; F: The decision curve analysis of the nomogram for the 60 months in the validation set.
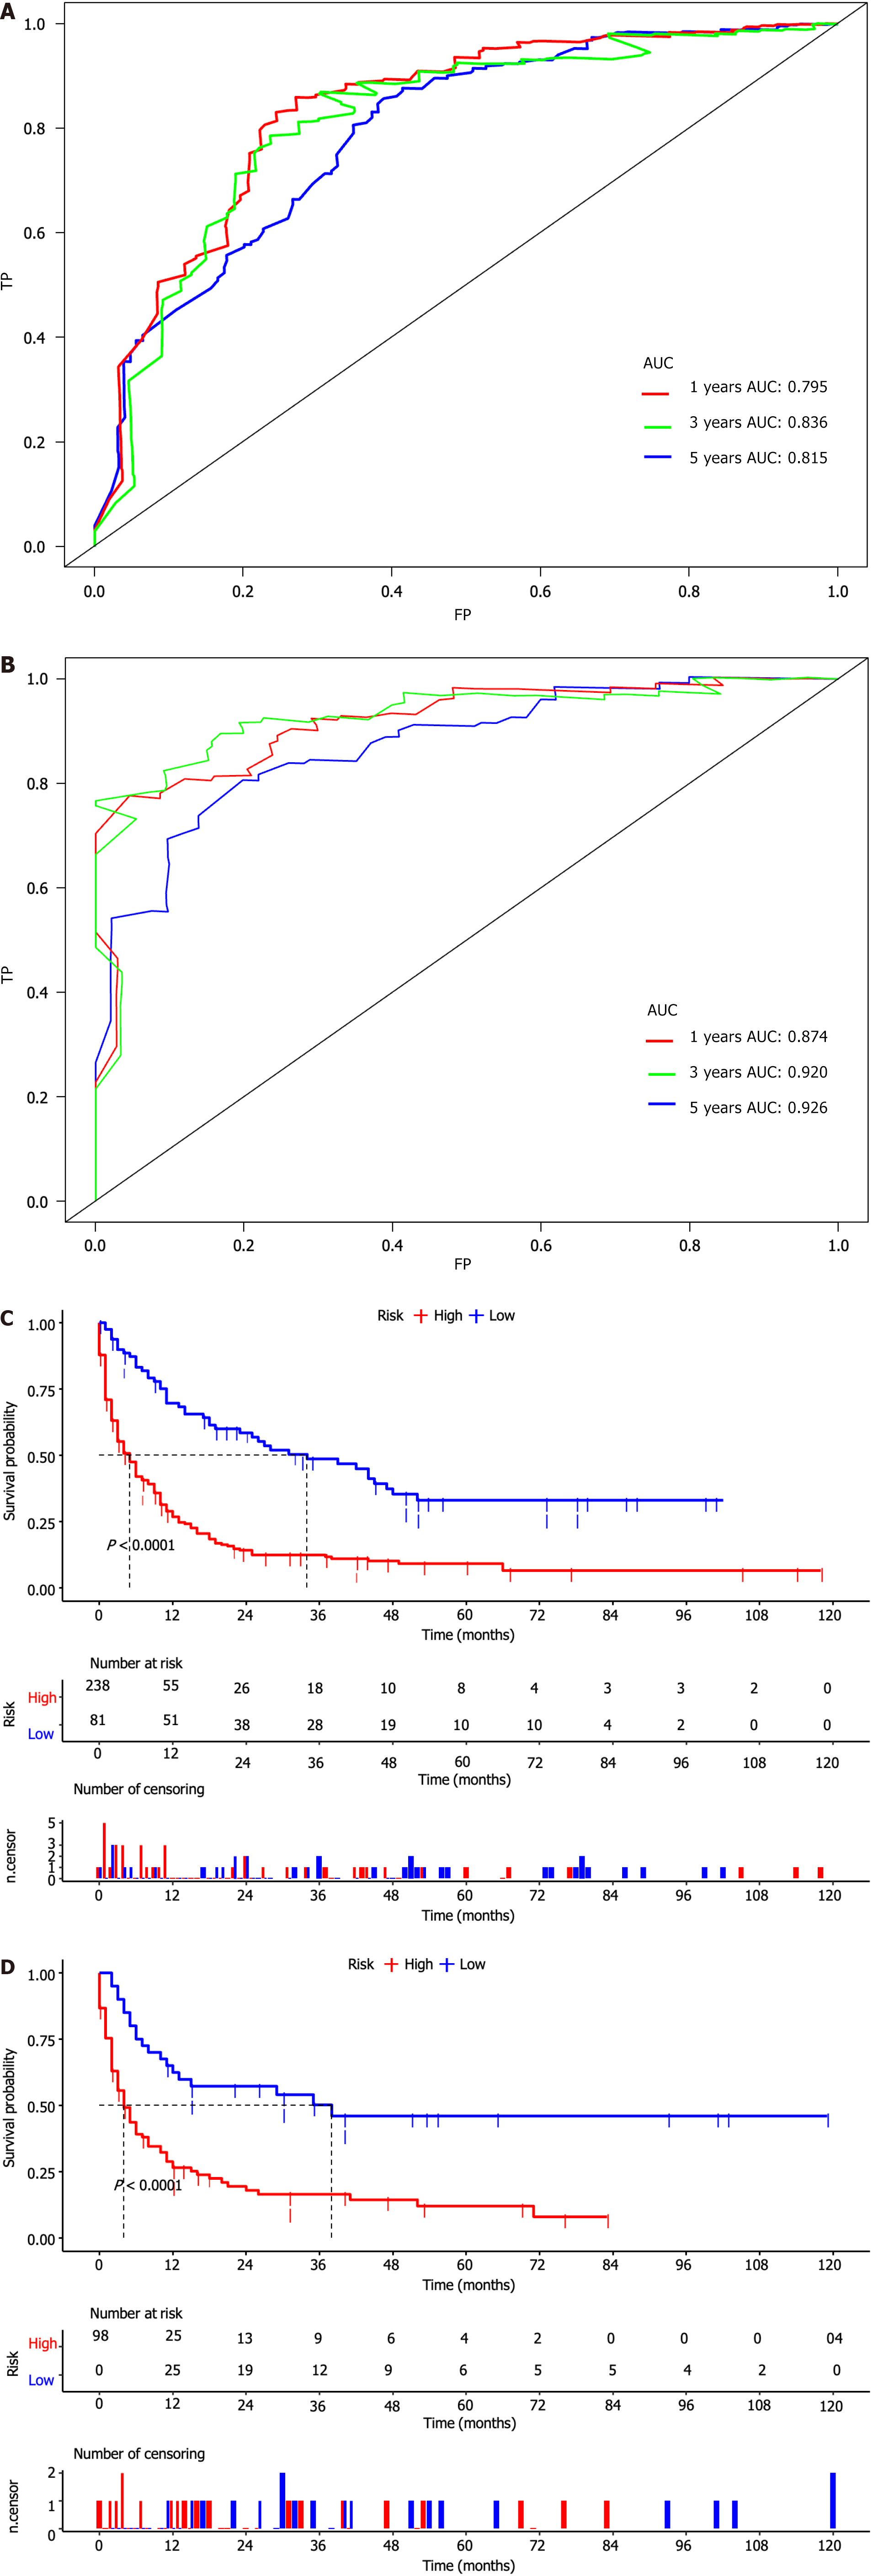
Figure 7 Time-dependent receiver operating characteristic curve analysis and kaplan-meier survival curves in the training and validation sets.
A: Time-dependent receiver operating characteristic curve analysis of the nomogram for the 12, 36, and 60 months in the training set; B: Time-dependent receiver operating characteristic curve analysis of the nomogram for the 12, 36, and 60 months in the validation set; C: The Kaplan-Meier (K-M) survival curves of the patients in the training set; D: The K-M survival curves of the patients in the validation set.
Figure 8 Comparison of area under the receiver operating characteristic curves between nomogram and all independent factors, including age, T stage, tumor size, grade stage, bone metastasis, surgery, and chemotherapy.
A: 12 months in the training set; B: 36 months in the training set; C: 60 months in the training set; D: 12 months in the validation set; E: 36 months in the validation set; F: 60 months in the validation set.
Figure 9 Validating the prognostic nomogram in the expanded testing set.
A: The calibration curves of the nomogram for the 12 months in the expanded testing set; B: The calibration curves of the nomogram for the 36 months in the expanded testing set; C: The calibration curves of the nomogram for the 60 months in the expanded testing set; D: The decision curve analysis of the nomogram for the 12 months in the expanded testing set; E: The decision curve analysis of the nomogram for the 36 months in the expanded testing set; F: The decision curve analysis of the nomogram for the 60 months in the expanded testing set; G: Comparison of area under the receiver operating characteristic curves between nomogram and all independent factors for the 12 months in the expanded testing set; H: Comparison of area under the receiver operating characteristic curves between nomogram and all independent factors for the 36 months in the expanded testing set; I: Comparison of area under the receiver operating characteristic curves between nomogram and all independent factors for the 60 months in the expanded testing set; J: Time-dependent receiver operating characteristic curve analysis of the nomogram for the 12, 36, and 60 months in the expanded testing set; K: The Kapla-Meier survival curve of the patients in the expanded testing set. AUC: Area under the curve.
- Citation: Shang JR, Xu CY, Zhai XX, Xu Z, Qian J. Risk factors, prognostic factors, and nomograms for distant metastasis in patients with diagnosed duodenal cancer: A population-based study. World J Gastrointest Oncol 2024; 16(4): 1384-1420
- URL: https://www.wjgnet.com/1948-5204/full/v16/i4/1384.htm
- DOI: https://dx.doi.org/10.4251/wjgo.v16.i4.1384


