Copyright
©The Author(s) 2024.
World J Gastrointest Oncol. Mar 15, 2024; 16(3): 919-932
Published online Mar 15, 2024. doi: 10.4251/wjgo.v16.i3.919
Published online Mar 15, 2024. doi: 10.4251/wjgo.v16.i3.919
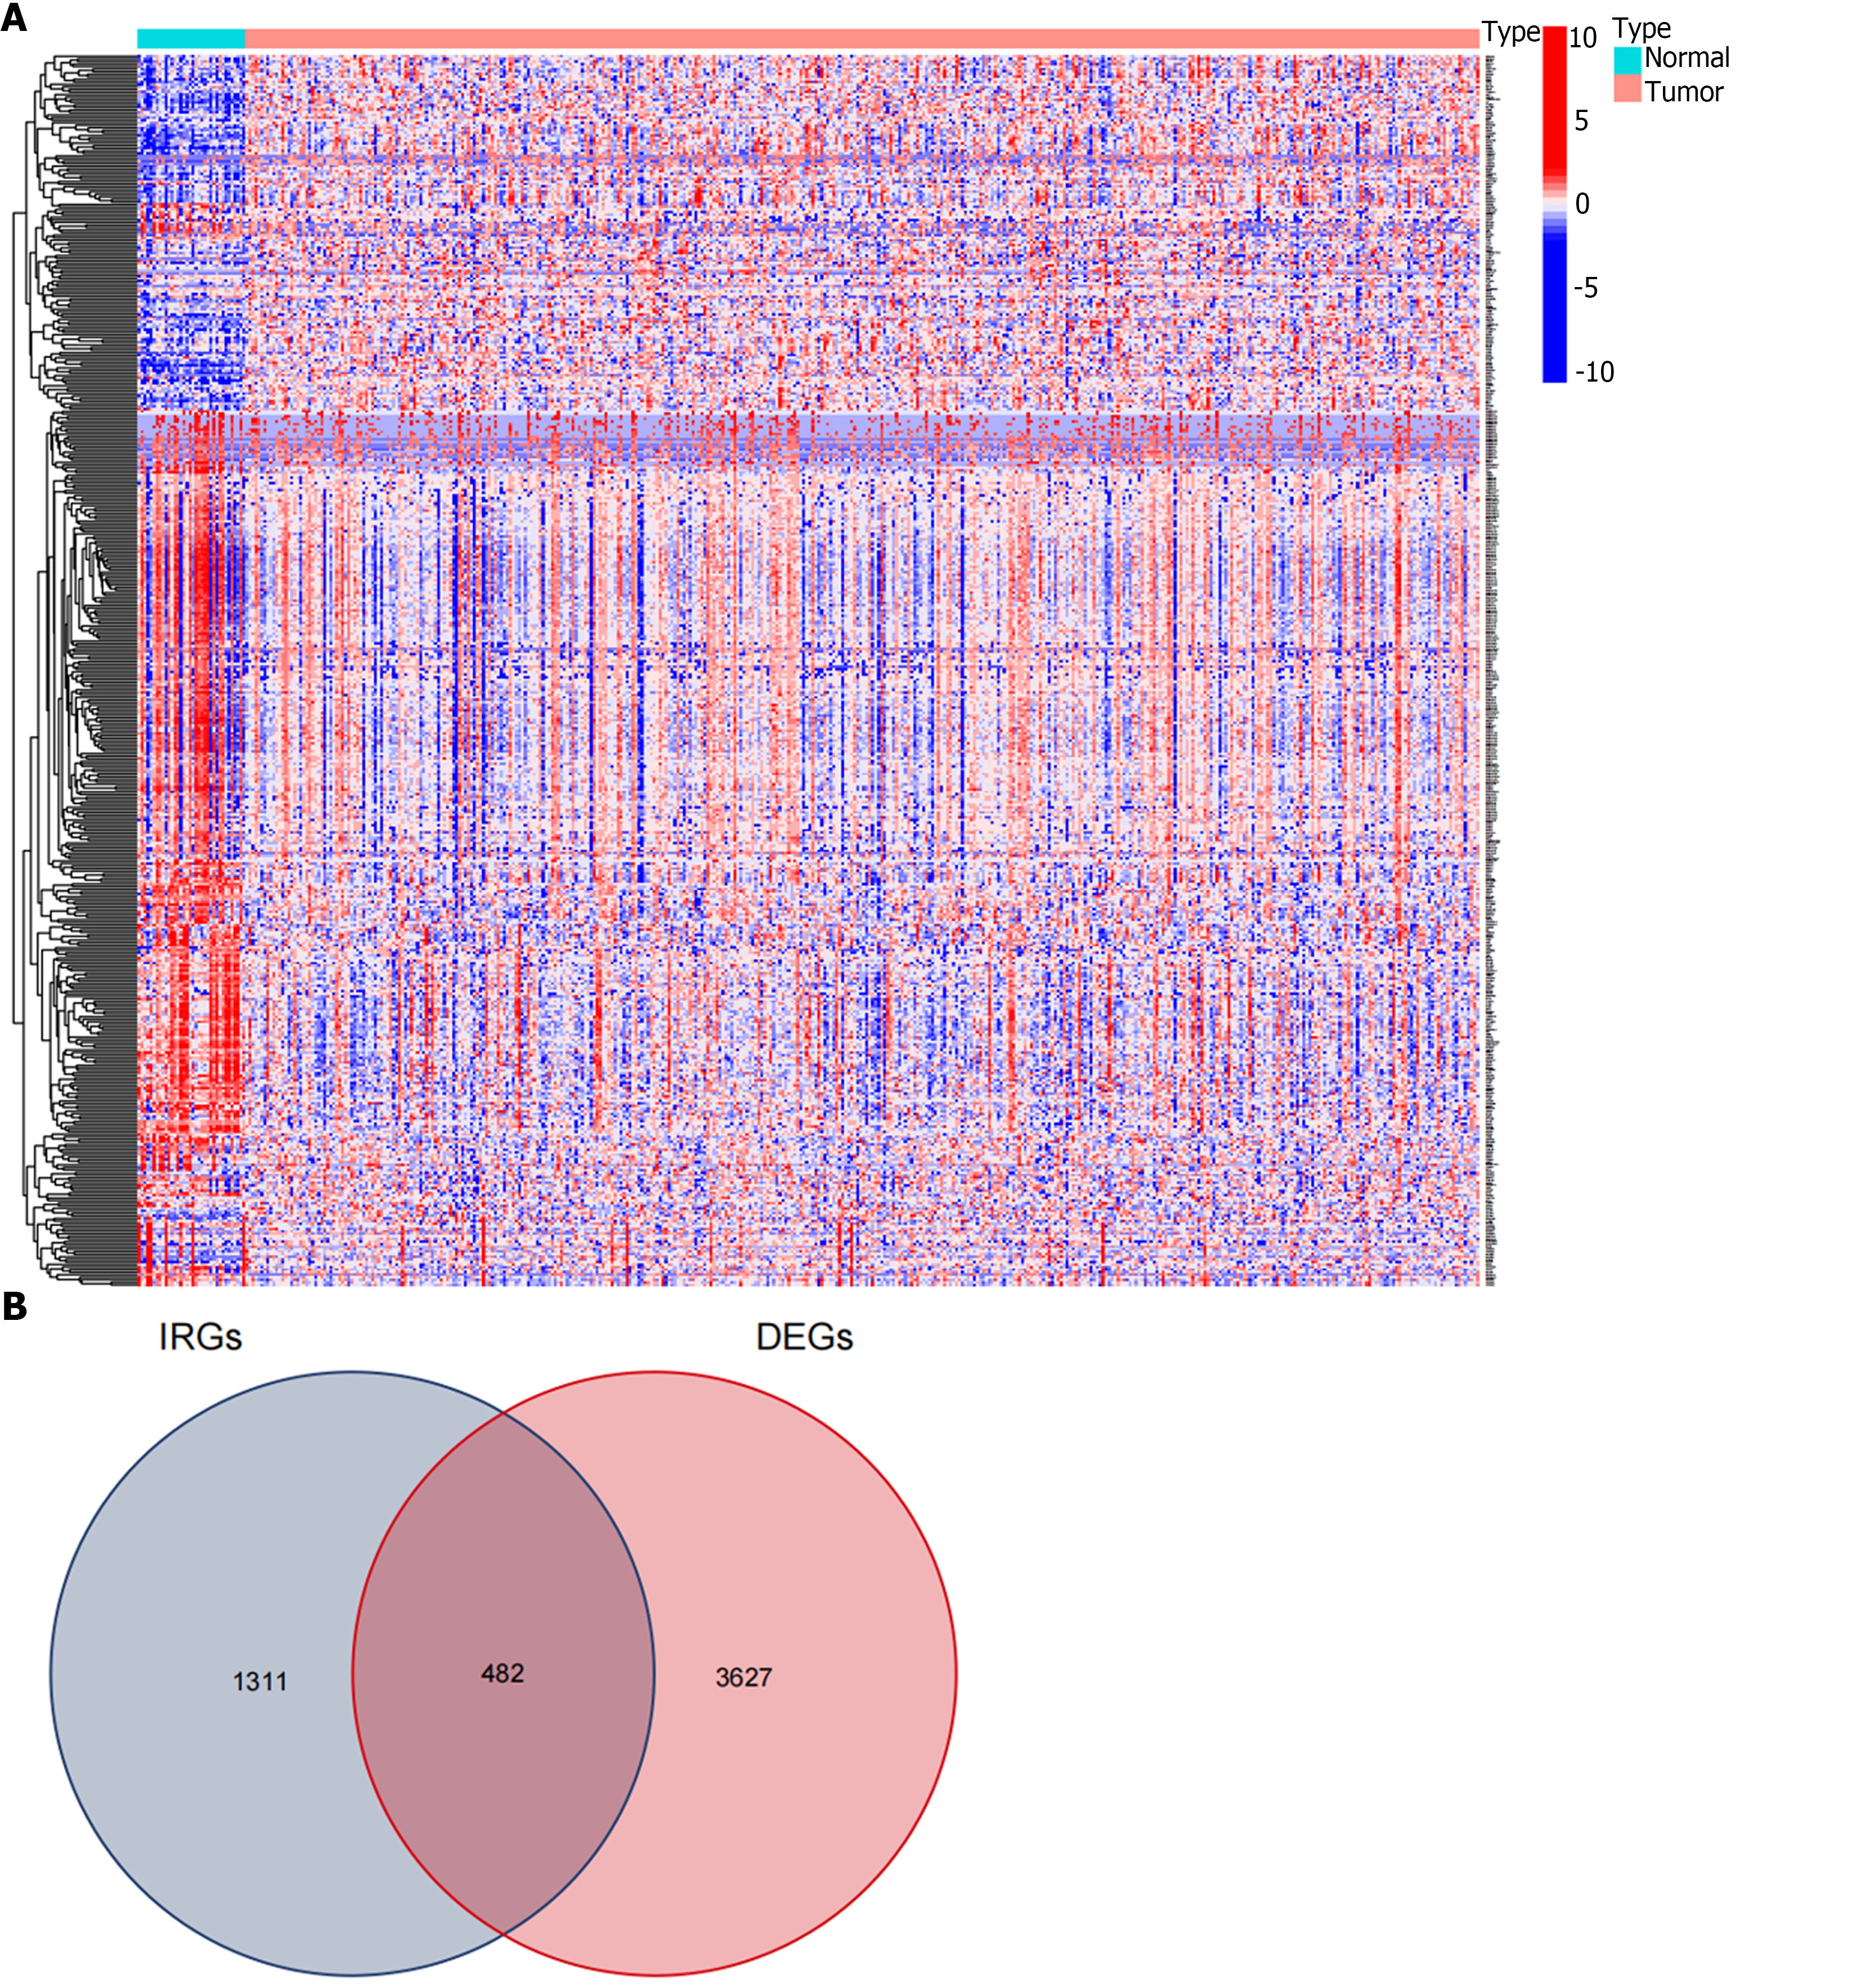
Figure 1 Procedure for obtaining differentially expressed immune related genes.
A: The heatmap showed 3627 differentially expressed genes (DEGs) screened from the Cancer Genome Atlas-stomach adenocarcinoma dataset; B: 482 differentially expressed immune related genes (IRGs) were extracted from the intersection of the DEGs and immune related genes lists. DEGs: Differentially expressed genes; IRGs: Immune related genes.
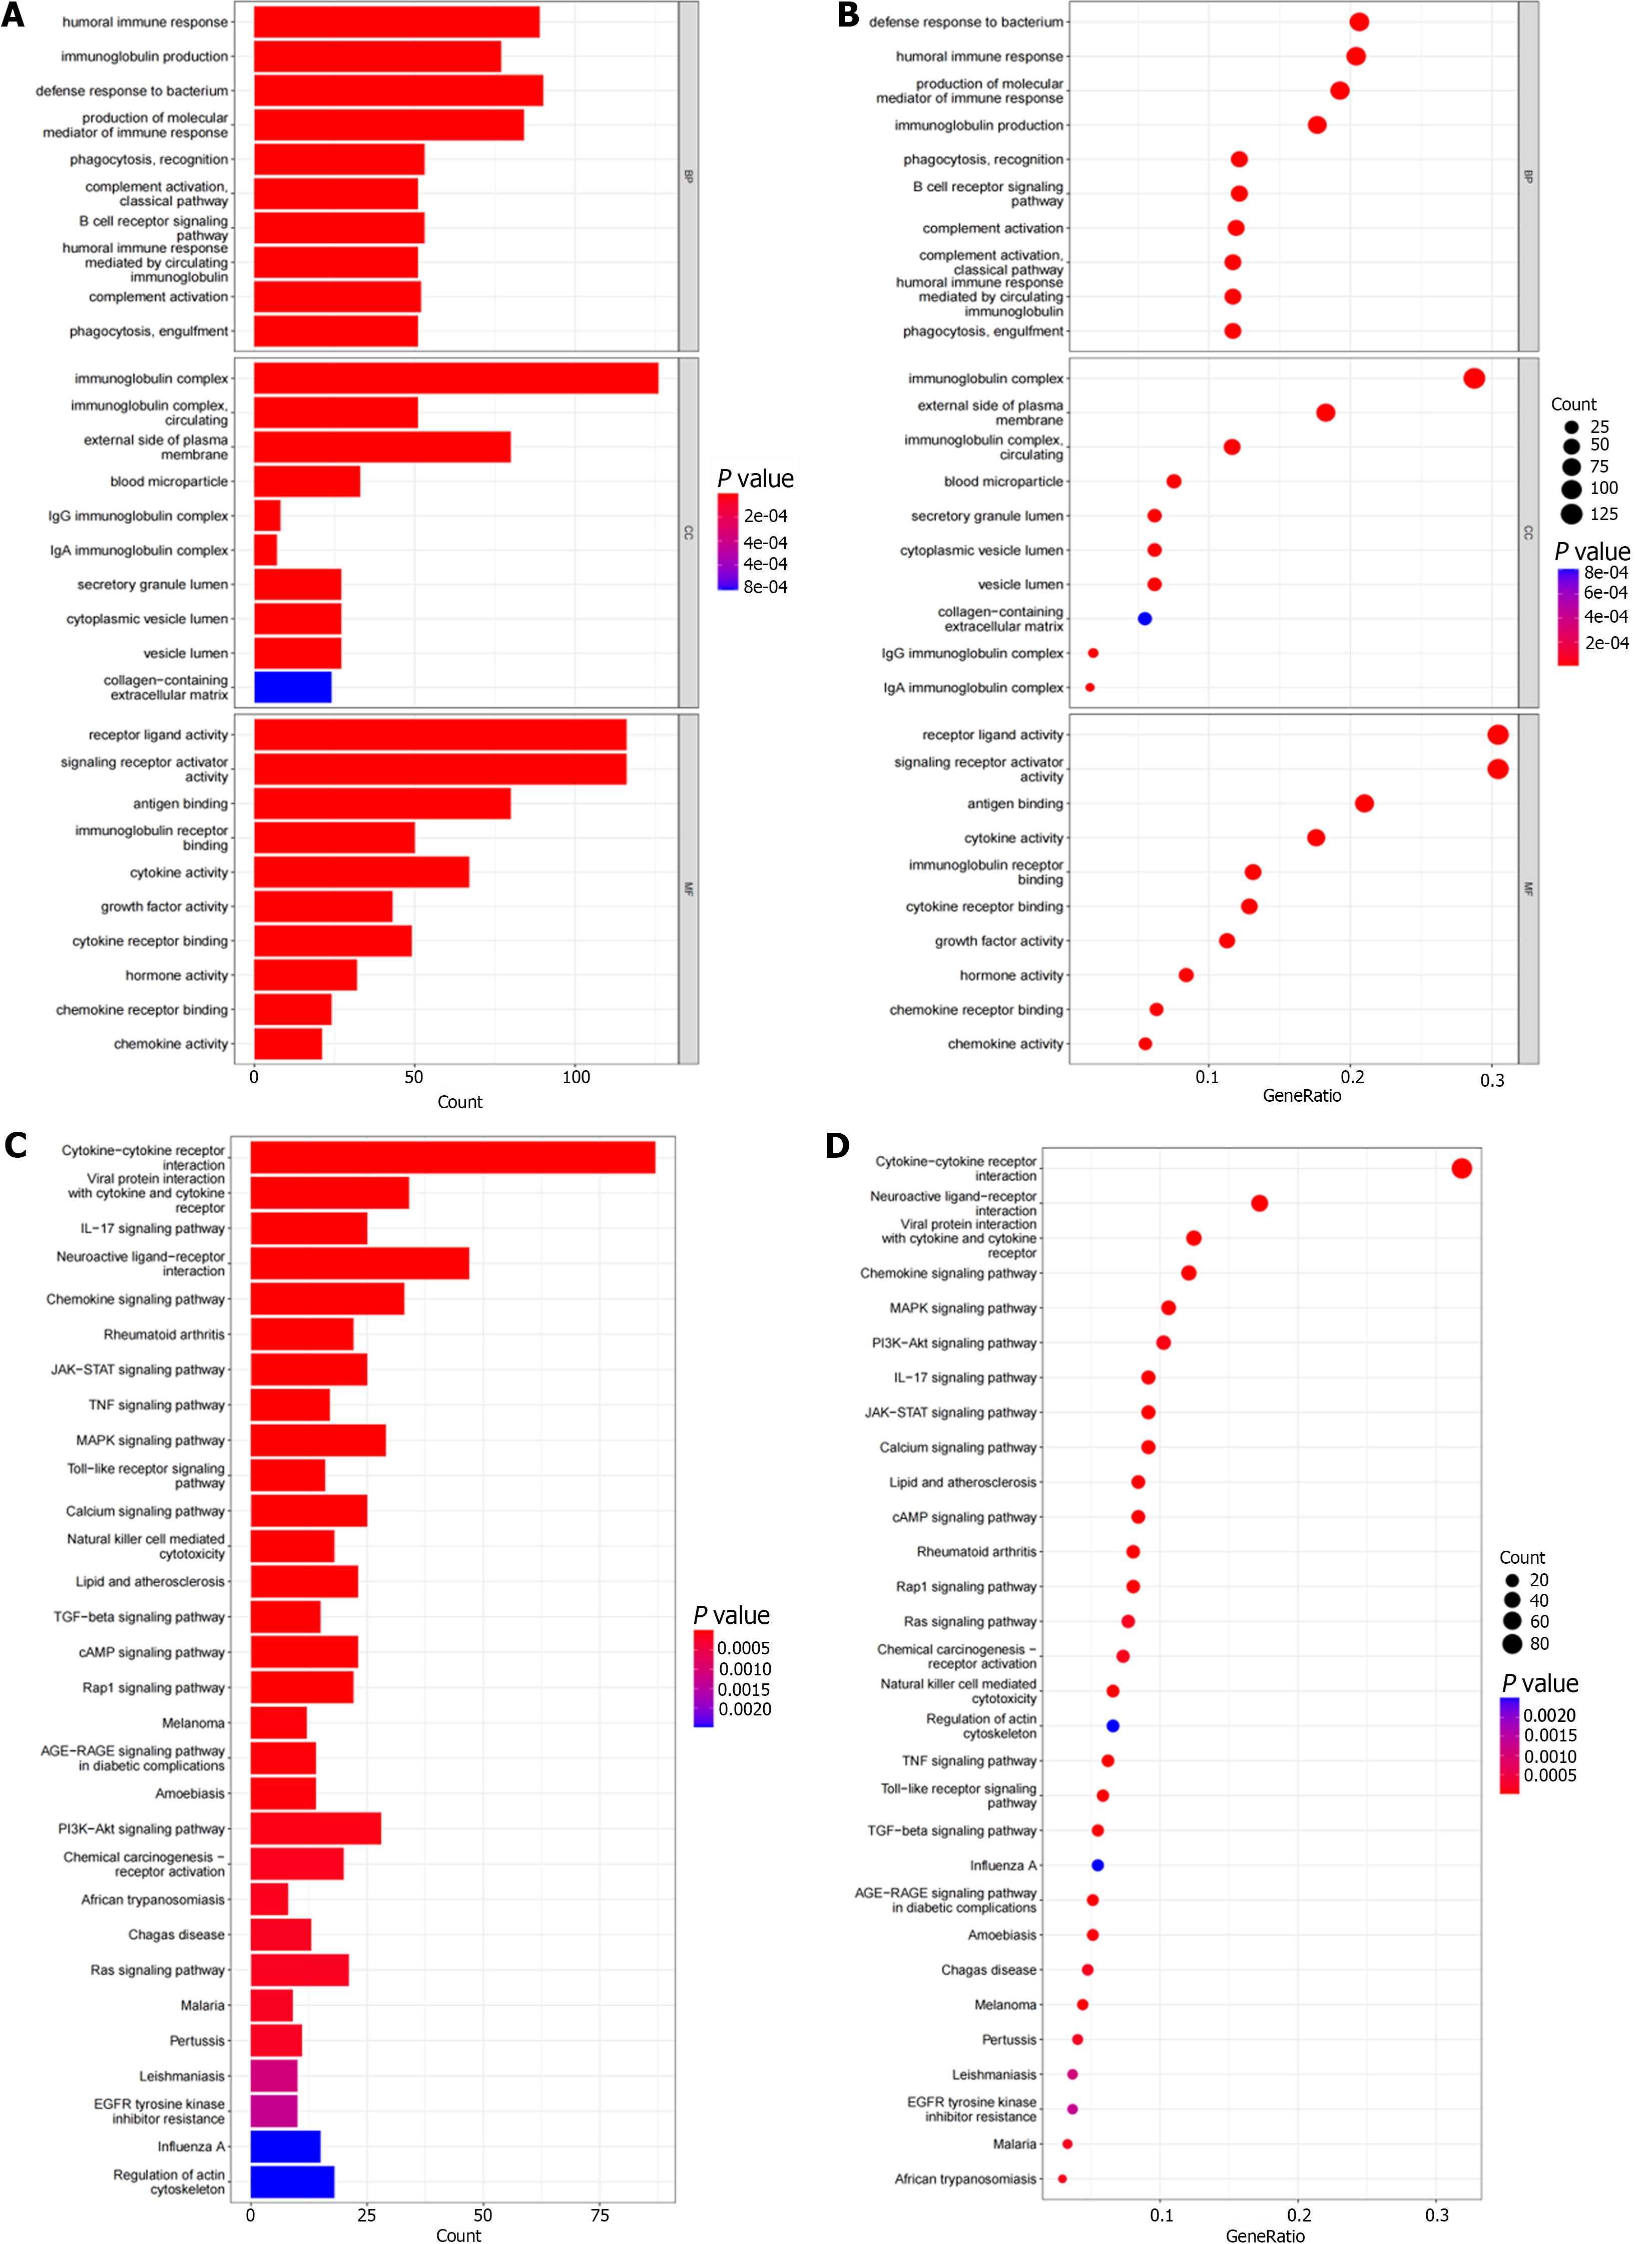
Figure 2 Functional enrichment pathways.
A: The bar chart shows the top 10 functional enrichment pathways in Gene Ontology (GO) analysis; B: The bubble chart showed the top 10 functional enrichment pathways in GO analysis; C: The bar chart showed the top 10 functional enrichment pathways in the Kyoto Encyclopedia of Genes and Genomes (KEGGs) analysis; D: The bubble chart showed the top 10 functional enrichment pathways in the KEGGs analysis.
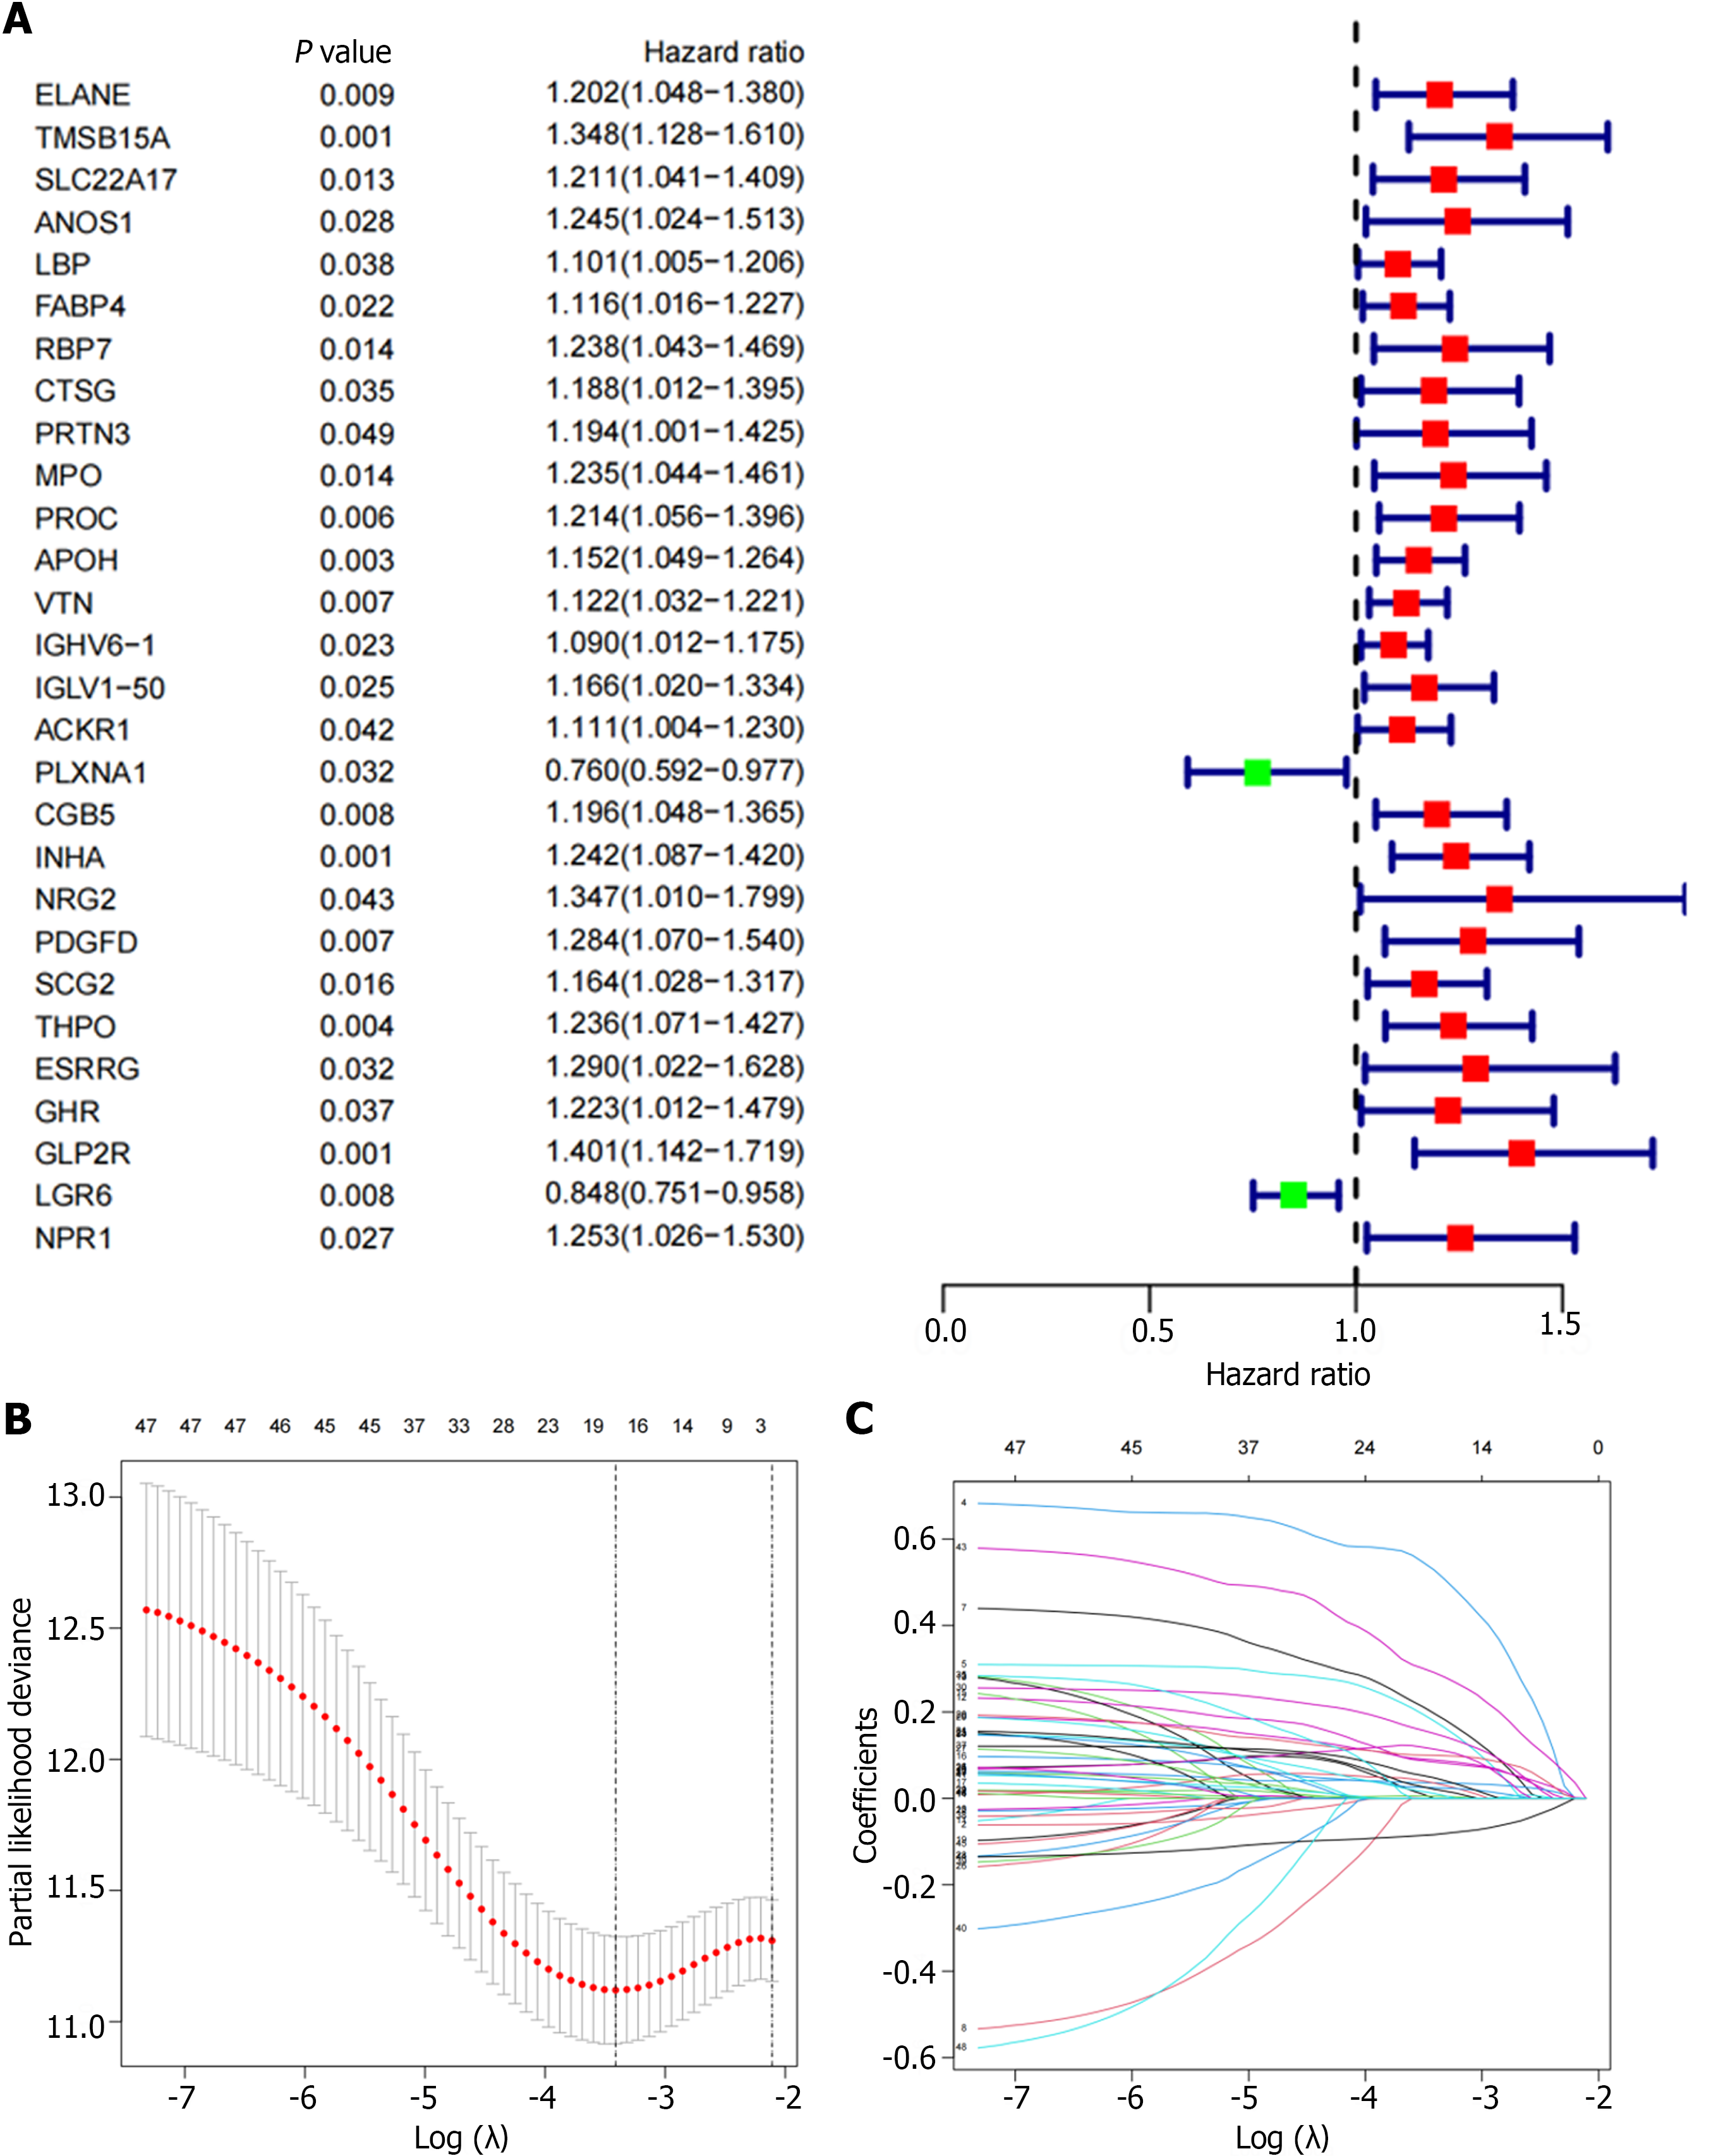
Figure 3 Verification by differentially expressed immune related genes.
A: The forest plot shows 48 differentially-expressed immune-related genes obtained by univariate Cox regression analysis; B and C: Least Absolute Shrinkage and Selection Operator algorithm was used to screen variables and eliminate genes with high correlation to reduce the number of genes in the risk model and prevent over-fitting of the model.
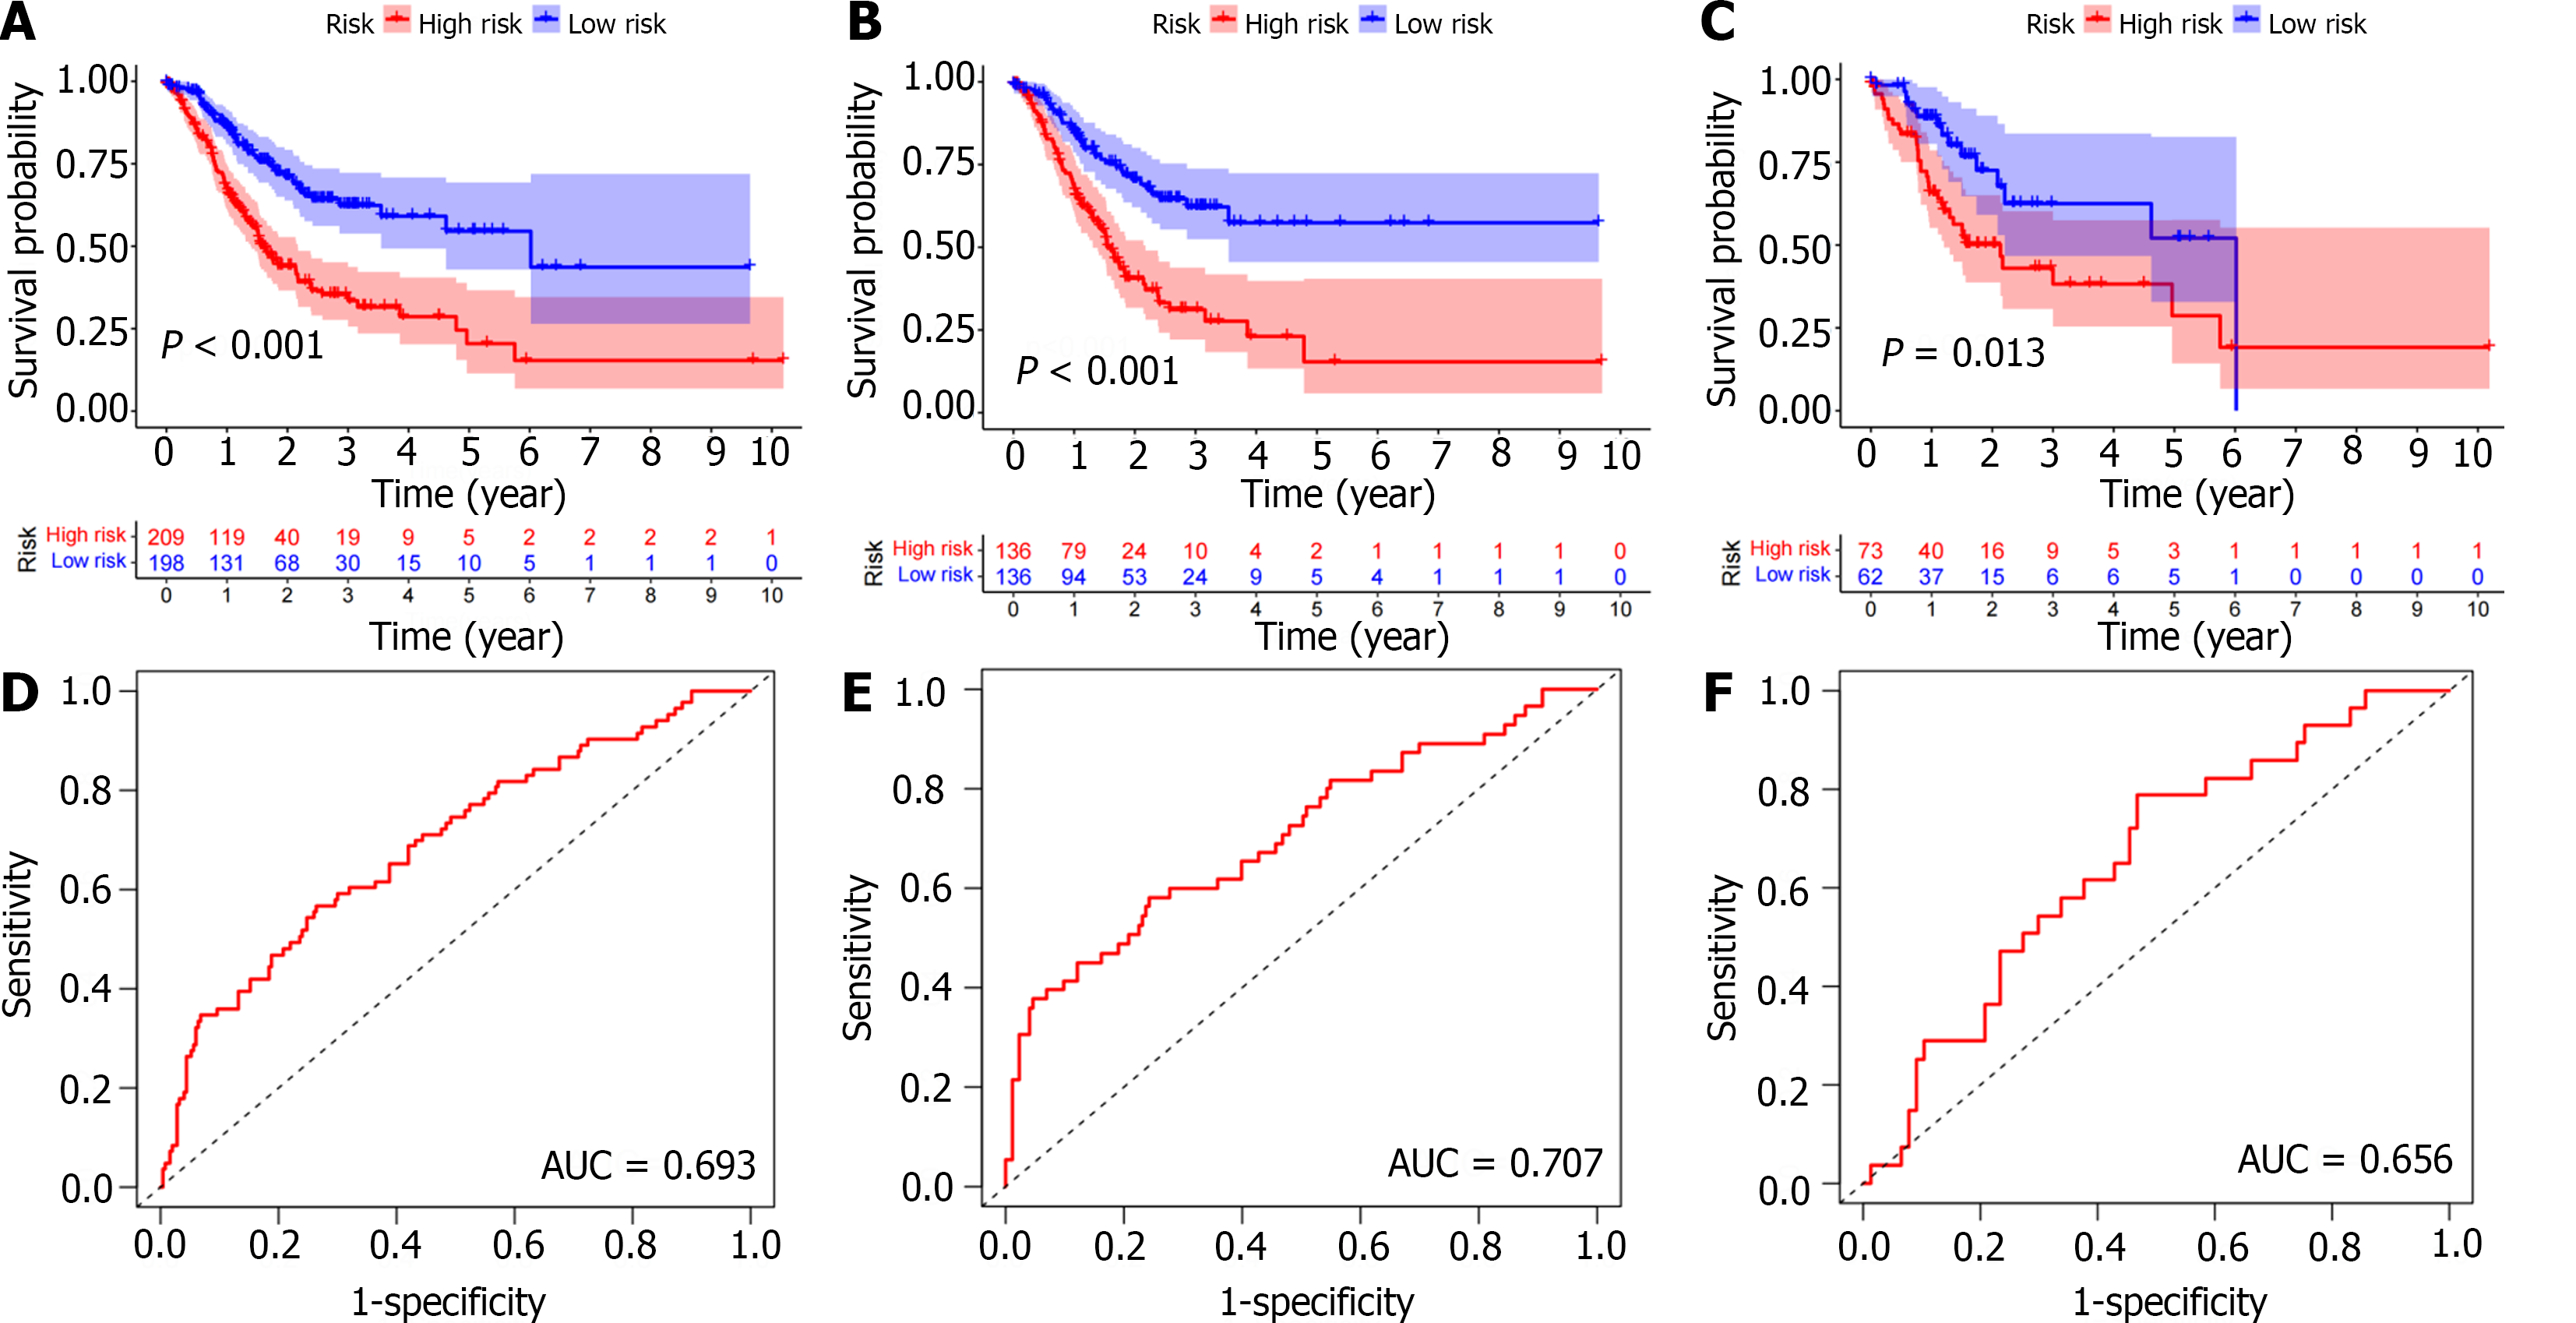
Figure 4 Survival analysis.
A-C: Kaplan Meier survival analysis showed that the overall survival of the low-risk group was significantly longer in the entire population, training cohort, and test cohort; D-F: The area under curve of the total population, training cohort, and test cohort were 0.693, 0.707, and 0.656, respectively. AUC: Area under the receiver operating characteristic curve.
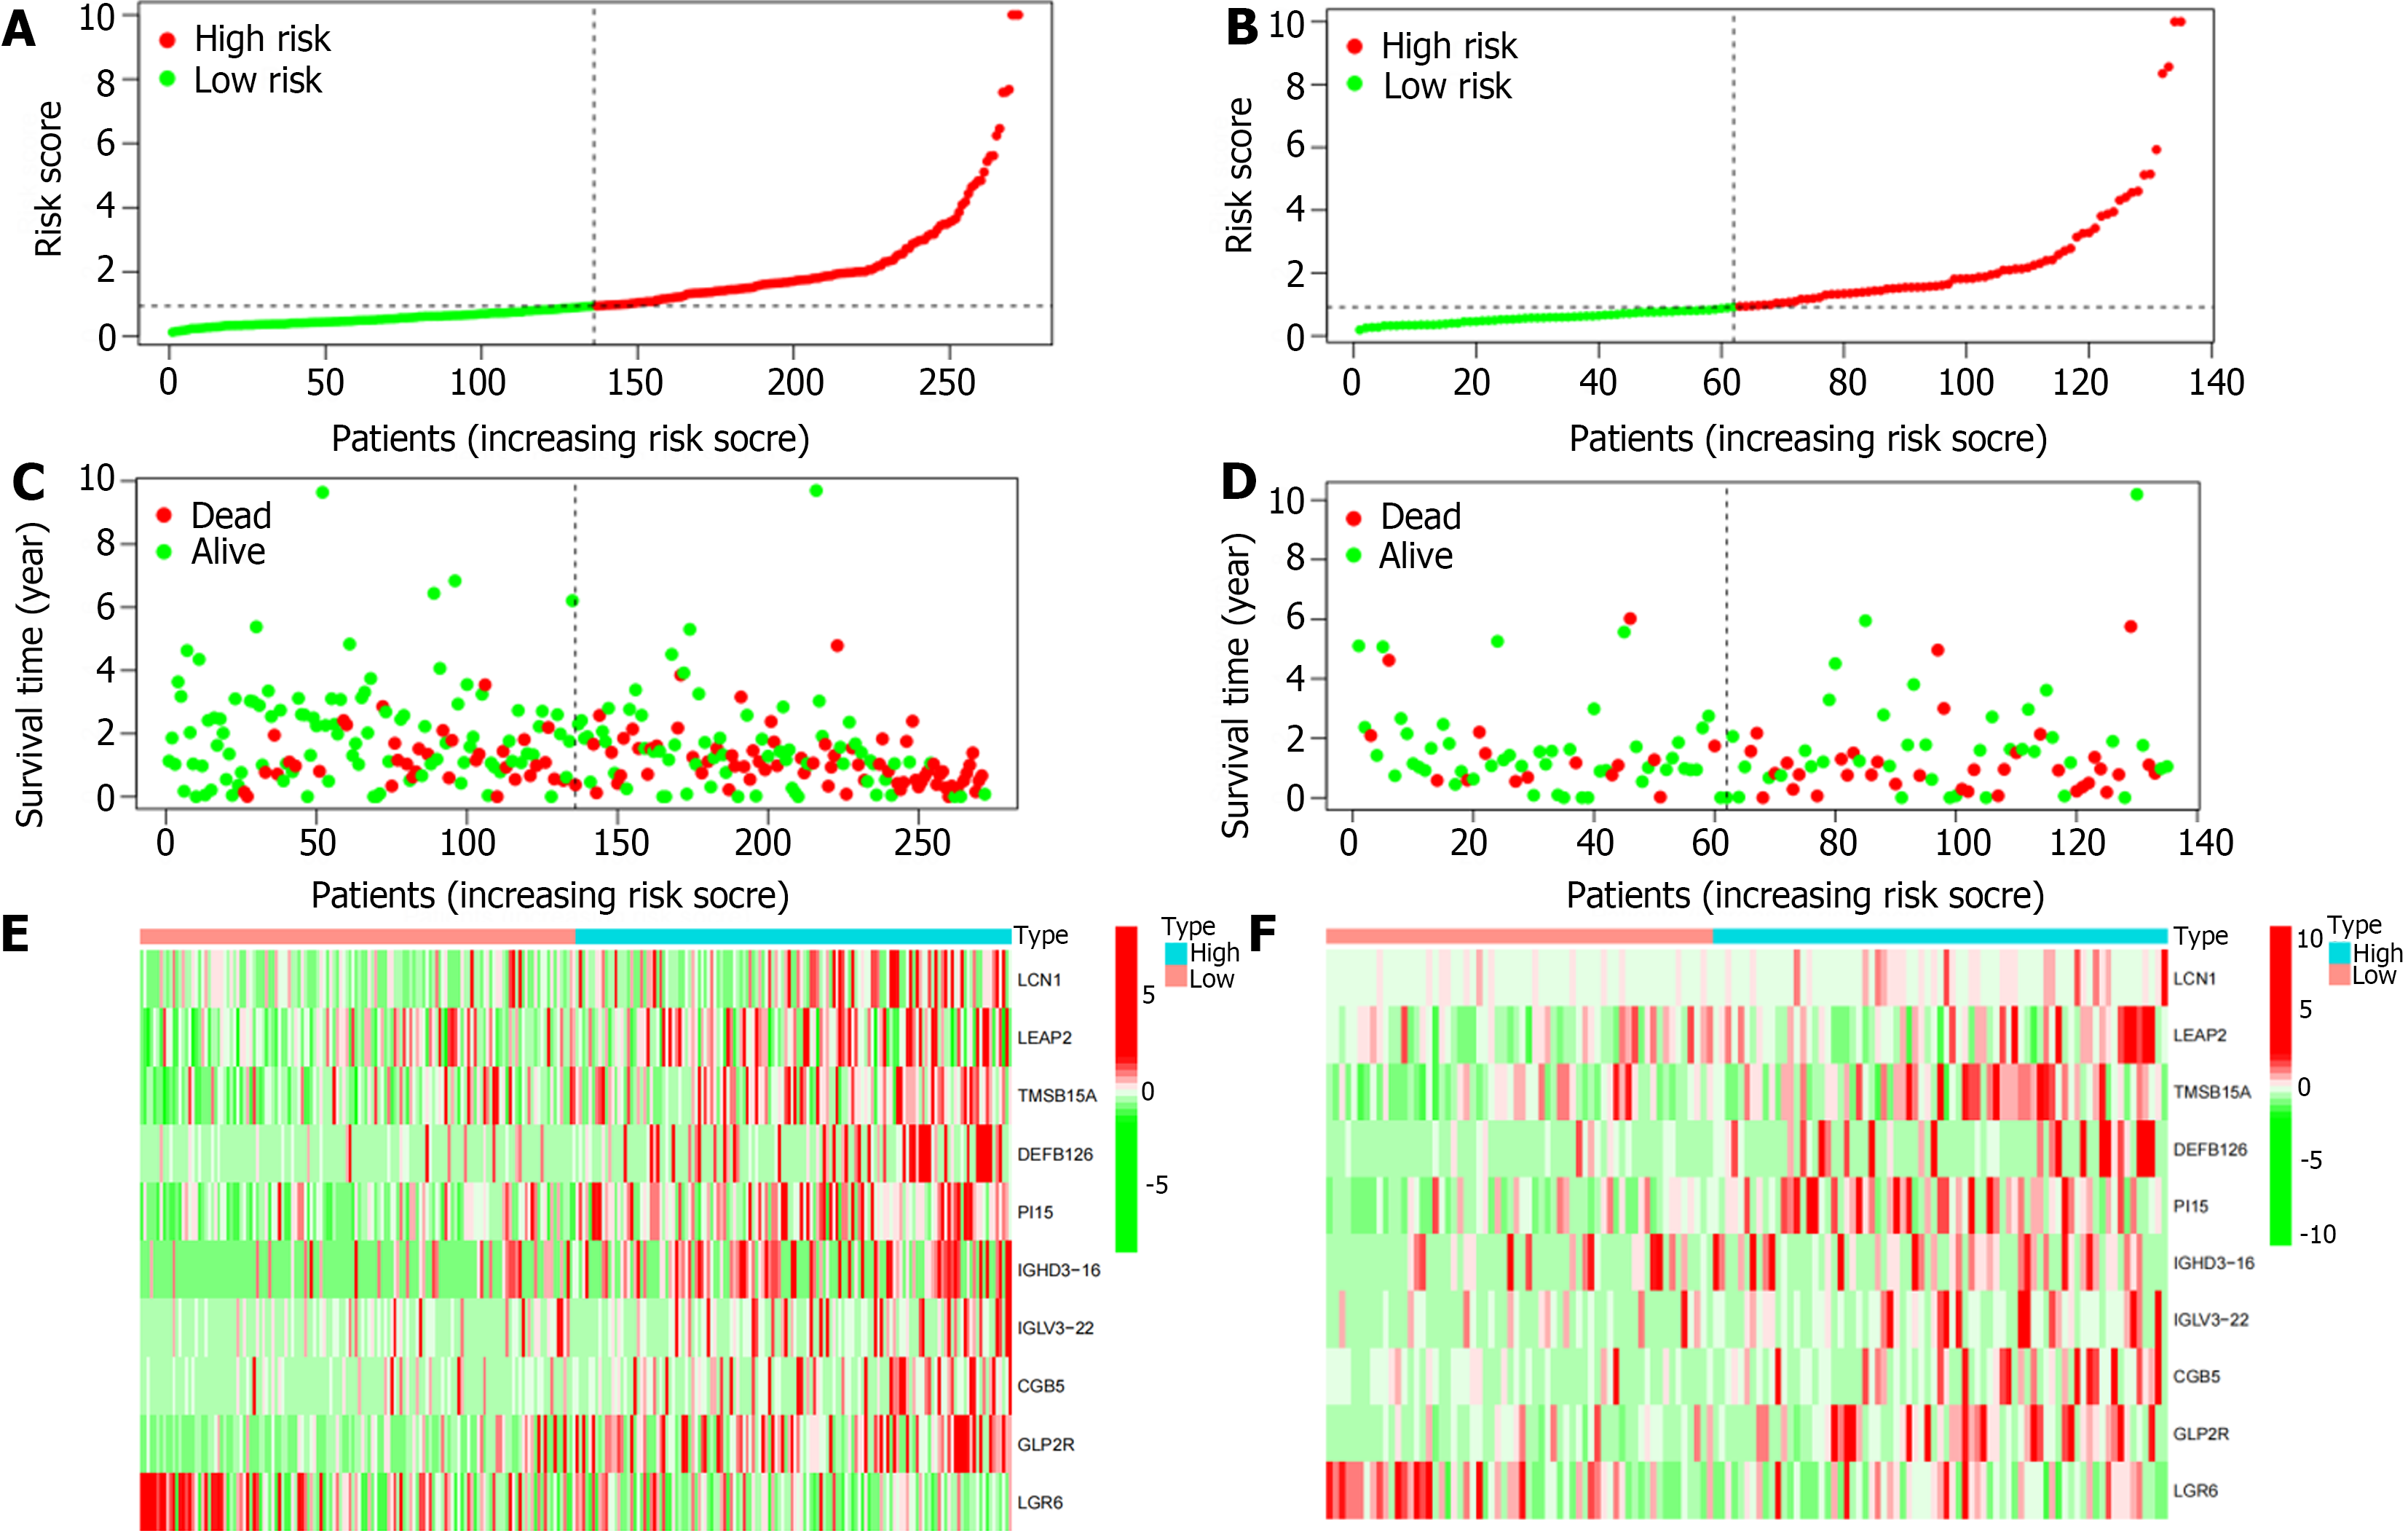
Figure 5 Correlation analysis of survival time and risk scores.
A: In the training cohort, there was a correlation between the patient’s risk score and gastric cancer (GC) mortality, with a higher score indicating a greater risk; B: In the test cohort, there was a correlation between the patient’s risk score and GC mortality, with a higher score indicating a greater risk; C: The scatter plot shows the correlation between survival time and risk score in GC patients in training cohort; D: The scatter plot shows the correlation between survival time and risk score in GC patients in training cohort; E: The heatmap showed that in the training cohort, LCN1, LEAP2, TMSB15A, DEFB126, PI15, IGHD3-16, IGLV3-22, CGB5, and GLP2R were highly expressed in the high-risk group, while LGR6 was highly expressed in the low-risk; F: The heatmap showed that in the test cohort, LCN1, LEAP2, TMSB15A, DEFB126, PI15, IGHD3-16, IGLV3-22, CGB5, and GLP2R were highly expressed in the high-risk group, while LGR6 was highly expressed in the low-risk.
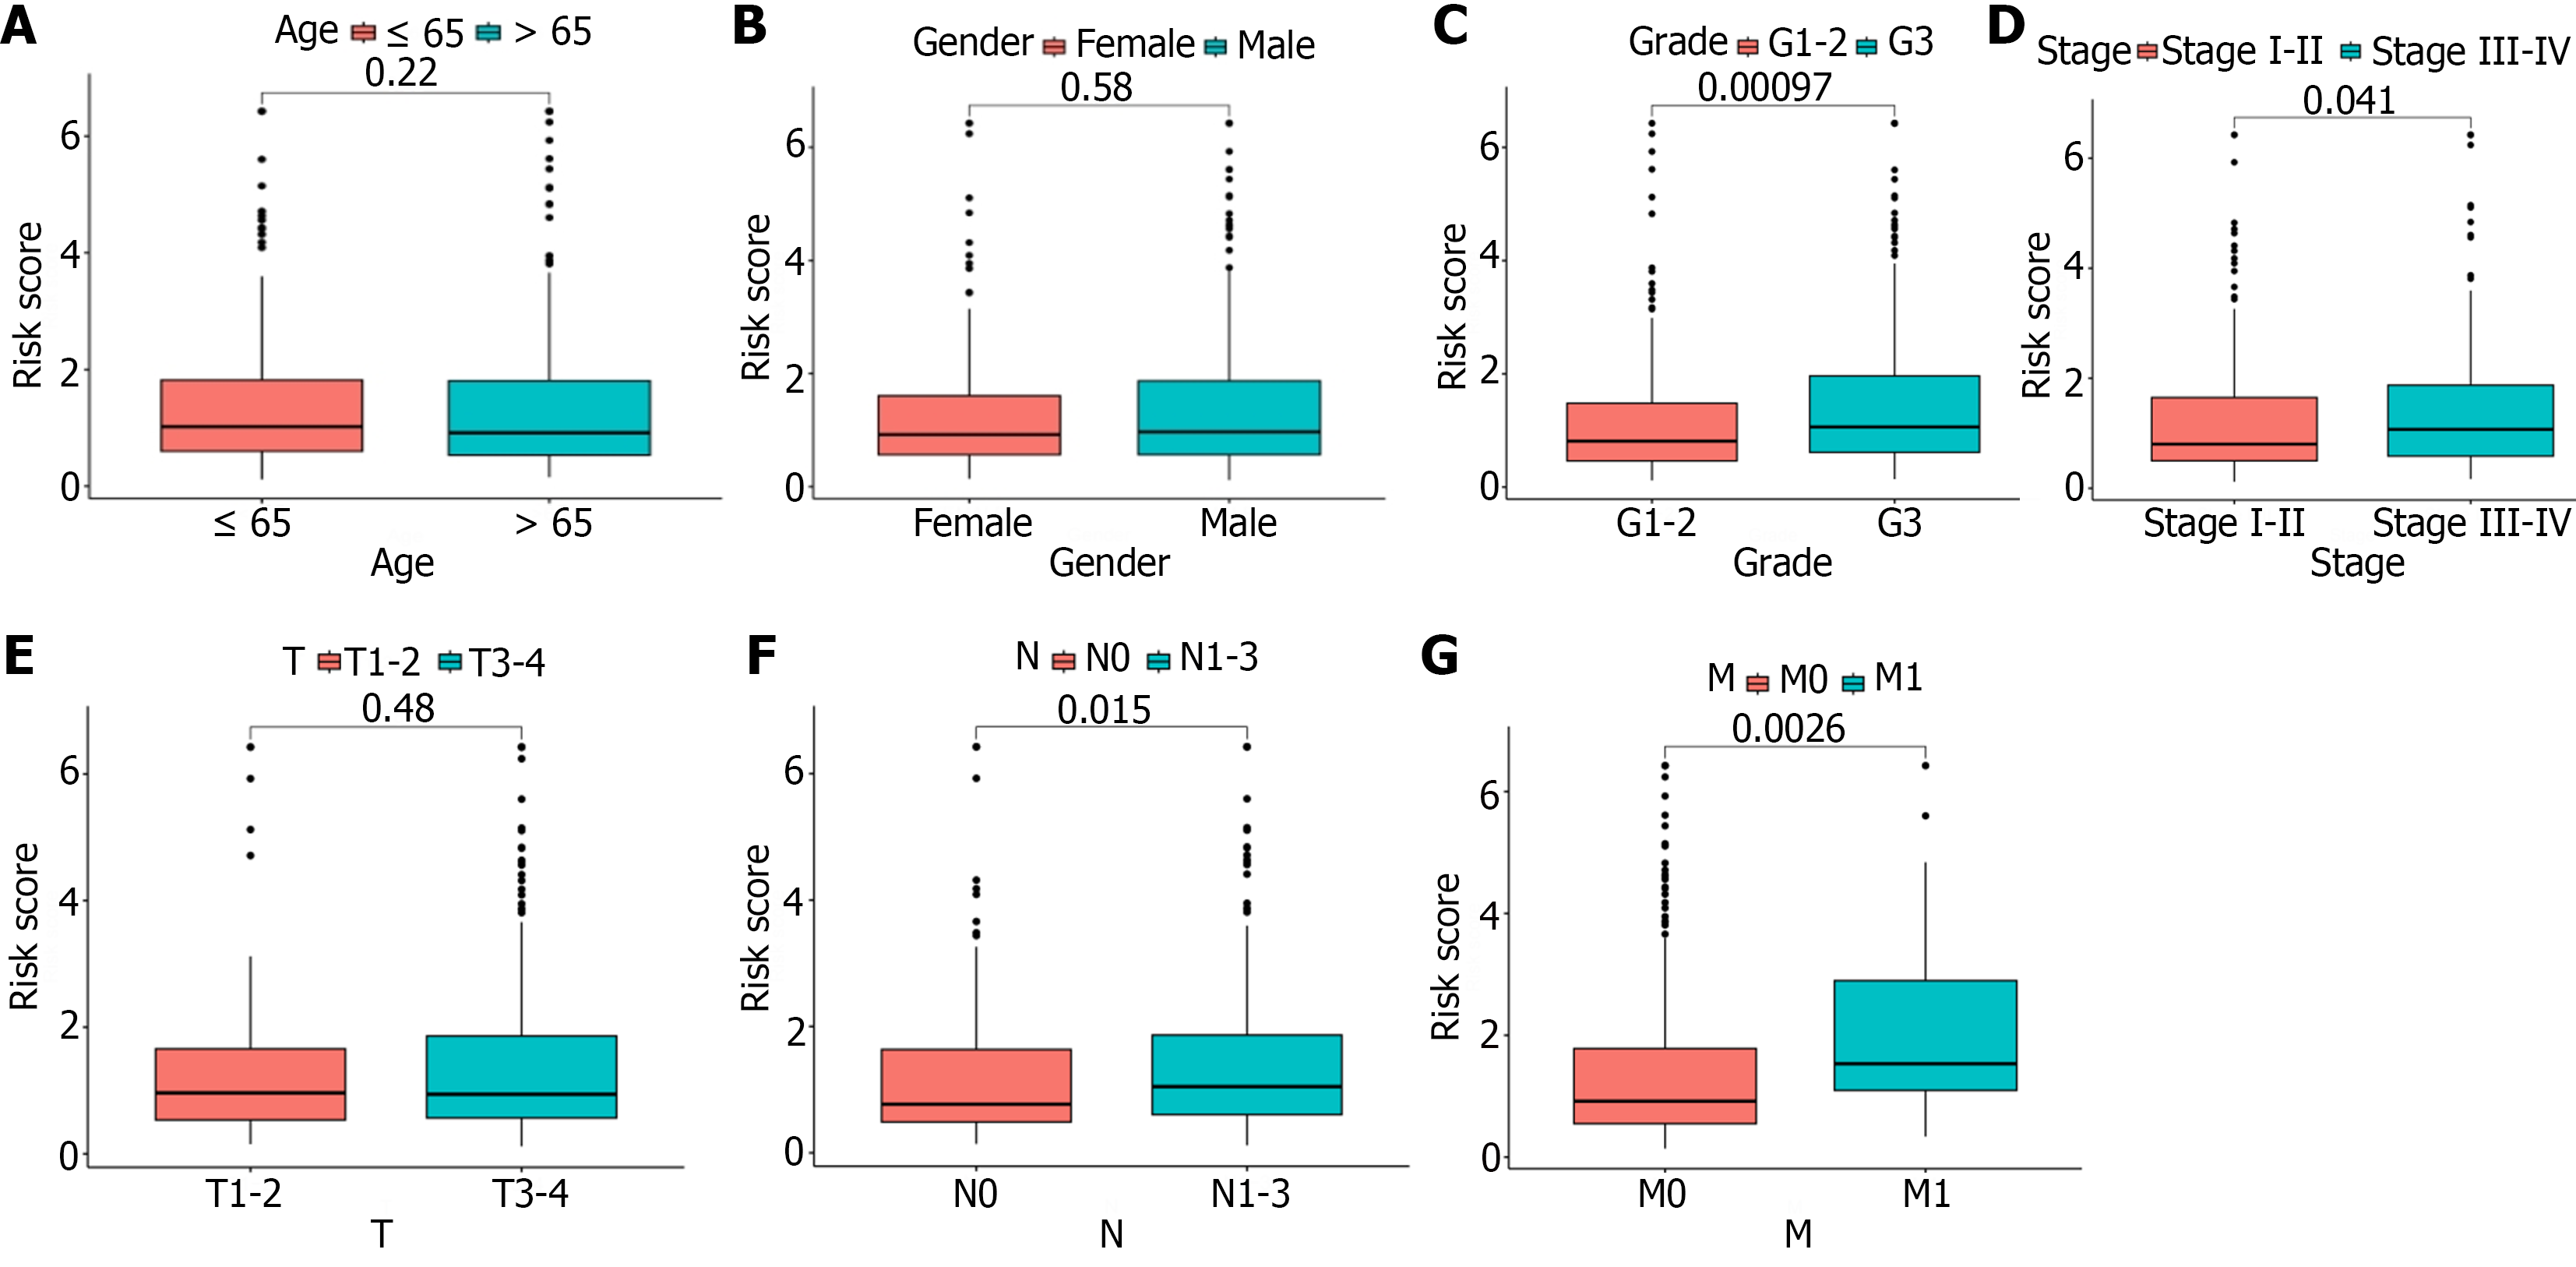
Figure 6 Correlation analysis of clinical features and risk scores.
A: There was no statistical difference in risk score on age; B: There was no statistical difference in risk score on gender; C: G3 patients had significantly higher risk scores than G1-2 patients; D: Stage III-IV patients had significantly higher risk scores than stage I-II patients; E: There was no statistical difference in risk score on T stage; F: N1-3 patients had significantly higher risk scores than N0 patients; G: M1 patients had significantly higher risk scores than M0 patients.
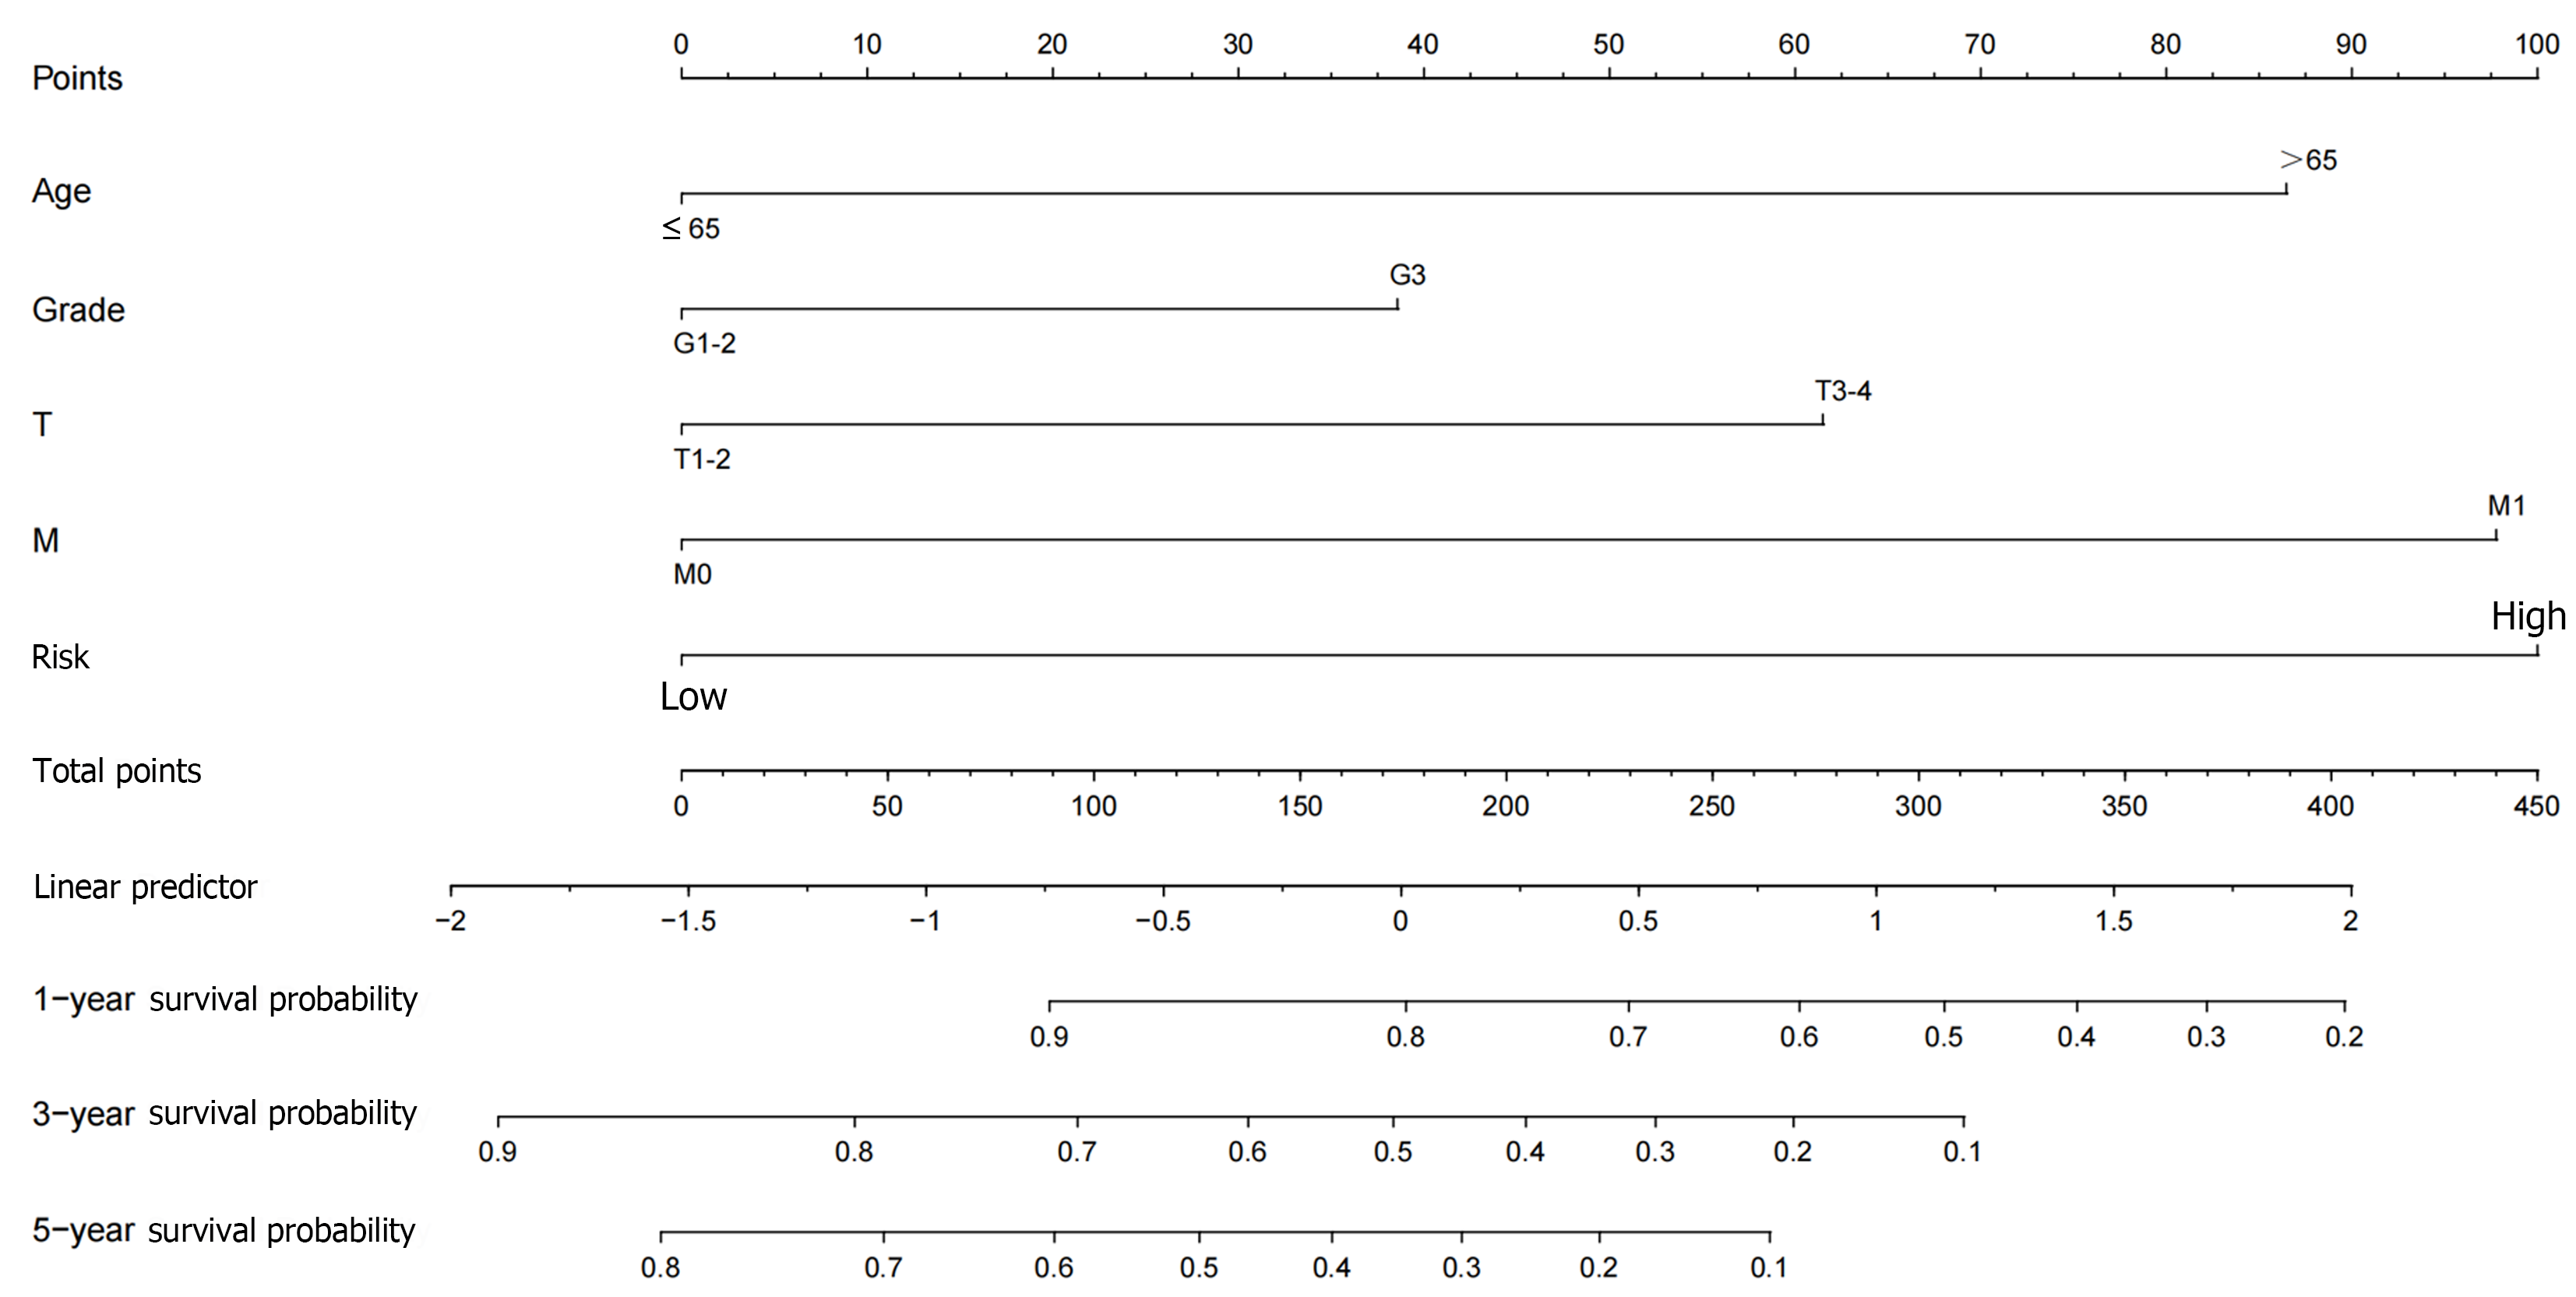
Figure 7 Nomogram prediction model.
A nomogram prediction model was constructed by clinicopathological factors and risk scores of differentially-expressed immune-related genes.
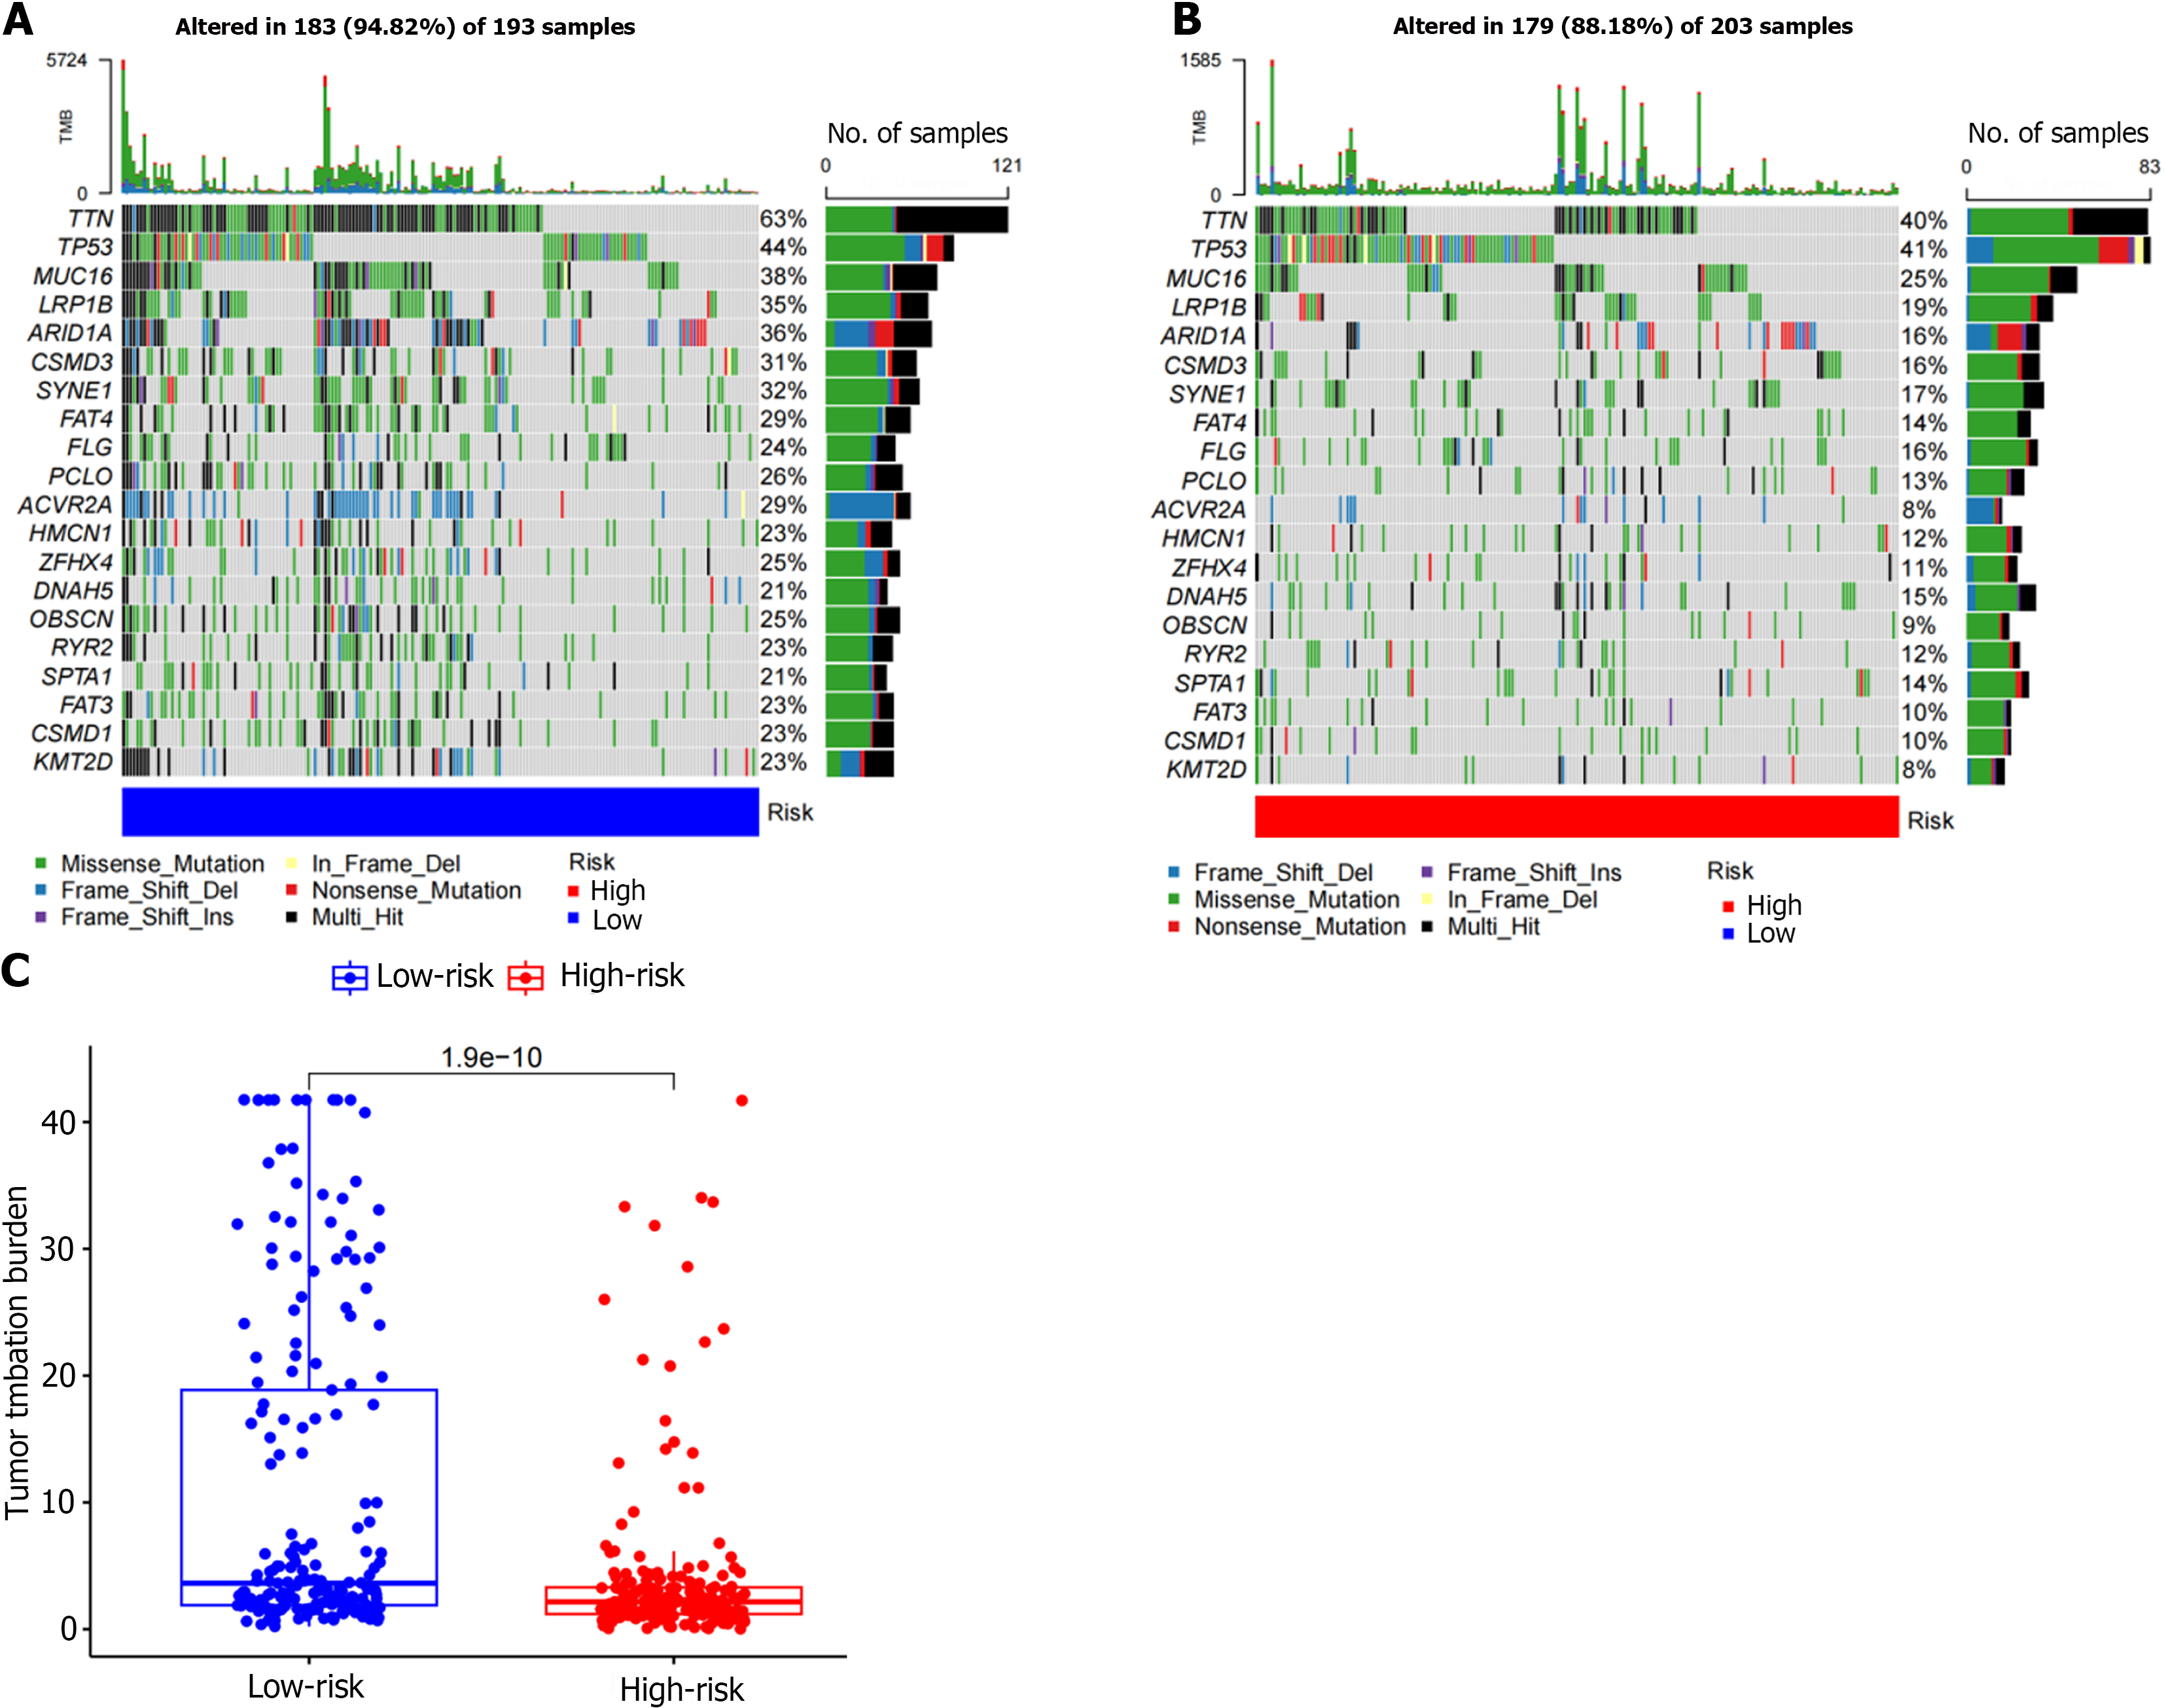
Figure 8 Mutation types and mutated genes.
A and B: The most common mutation types in both the low- and high-risk groups were missense mutations, multi-hit, and frame shift deletions. The top five mutant genes with mutation frequencies in the two groups were TTN, TP53, MUC16, LRP1B, and ARID1A; C: The risk score was significantly correlated with tumor mutation burden (TMB) (P = 1.9e-10), and the level of TMB was higher in the low-risk group.
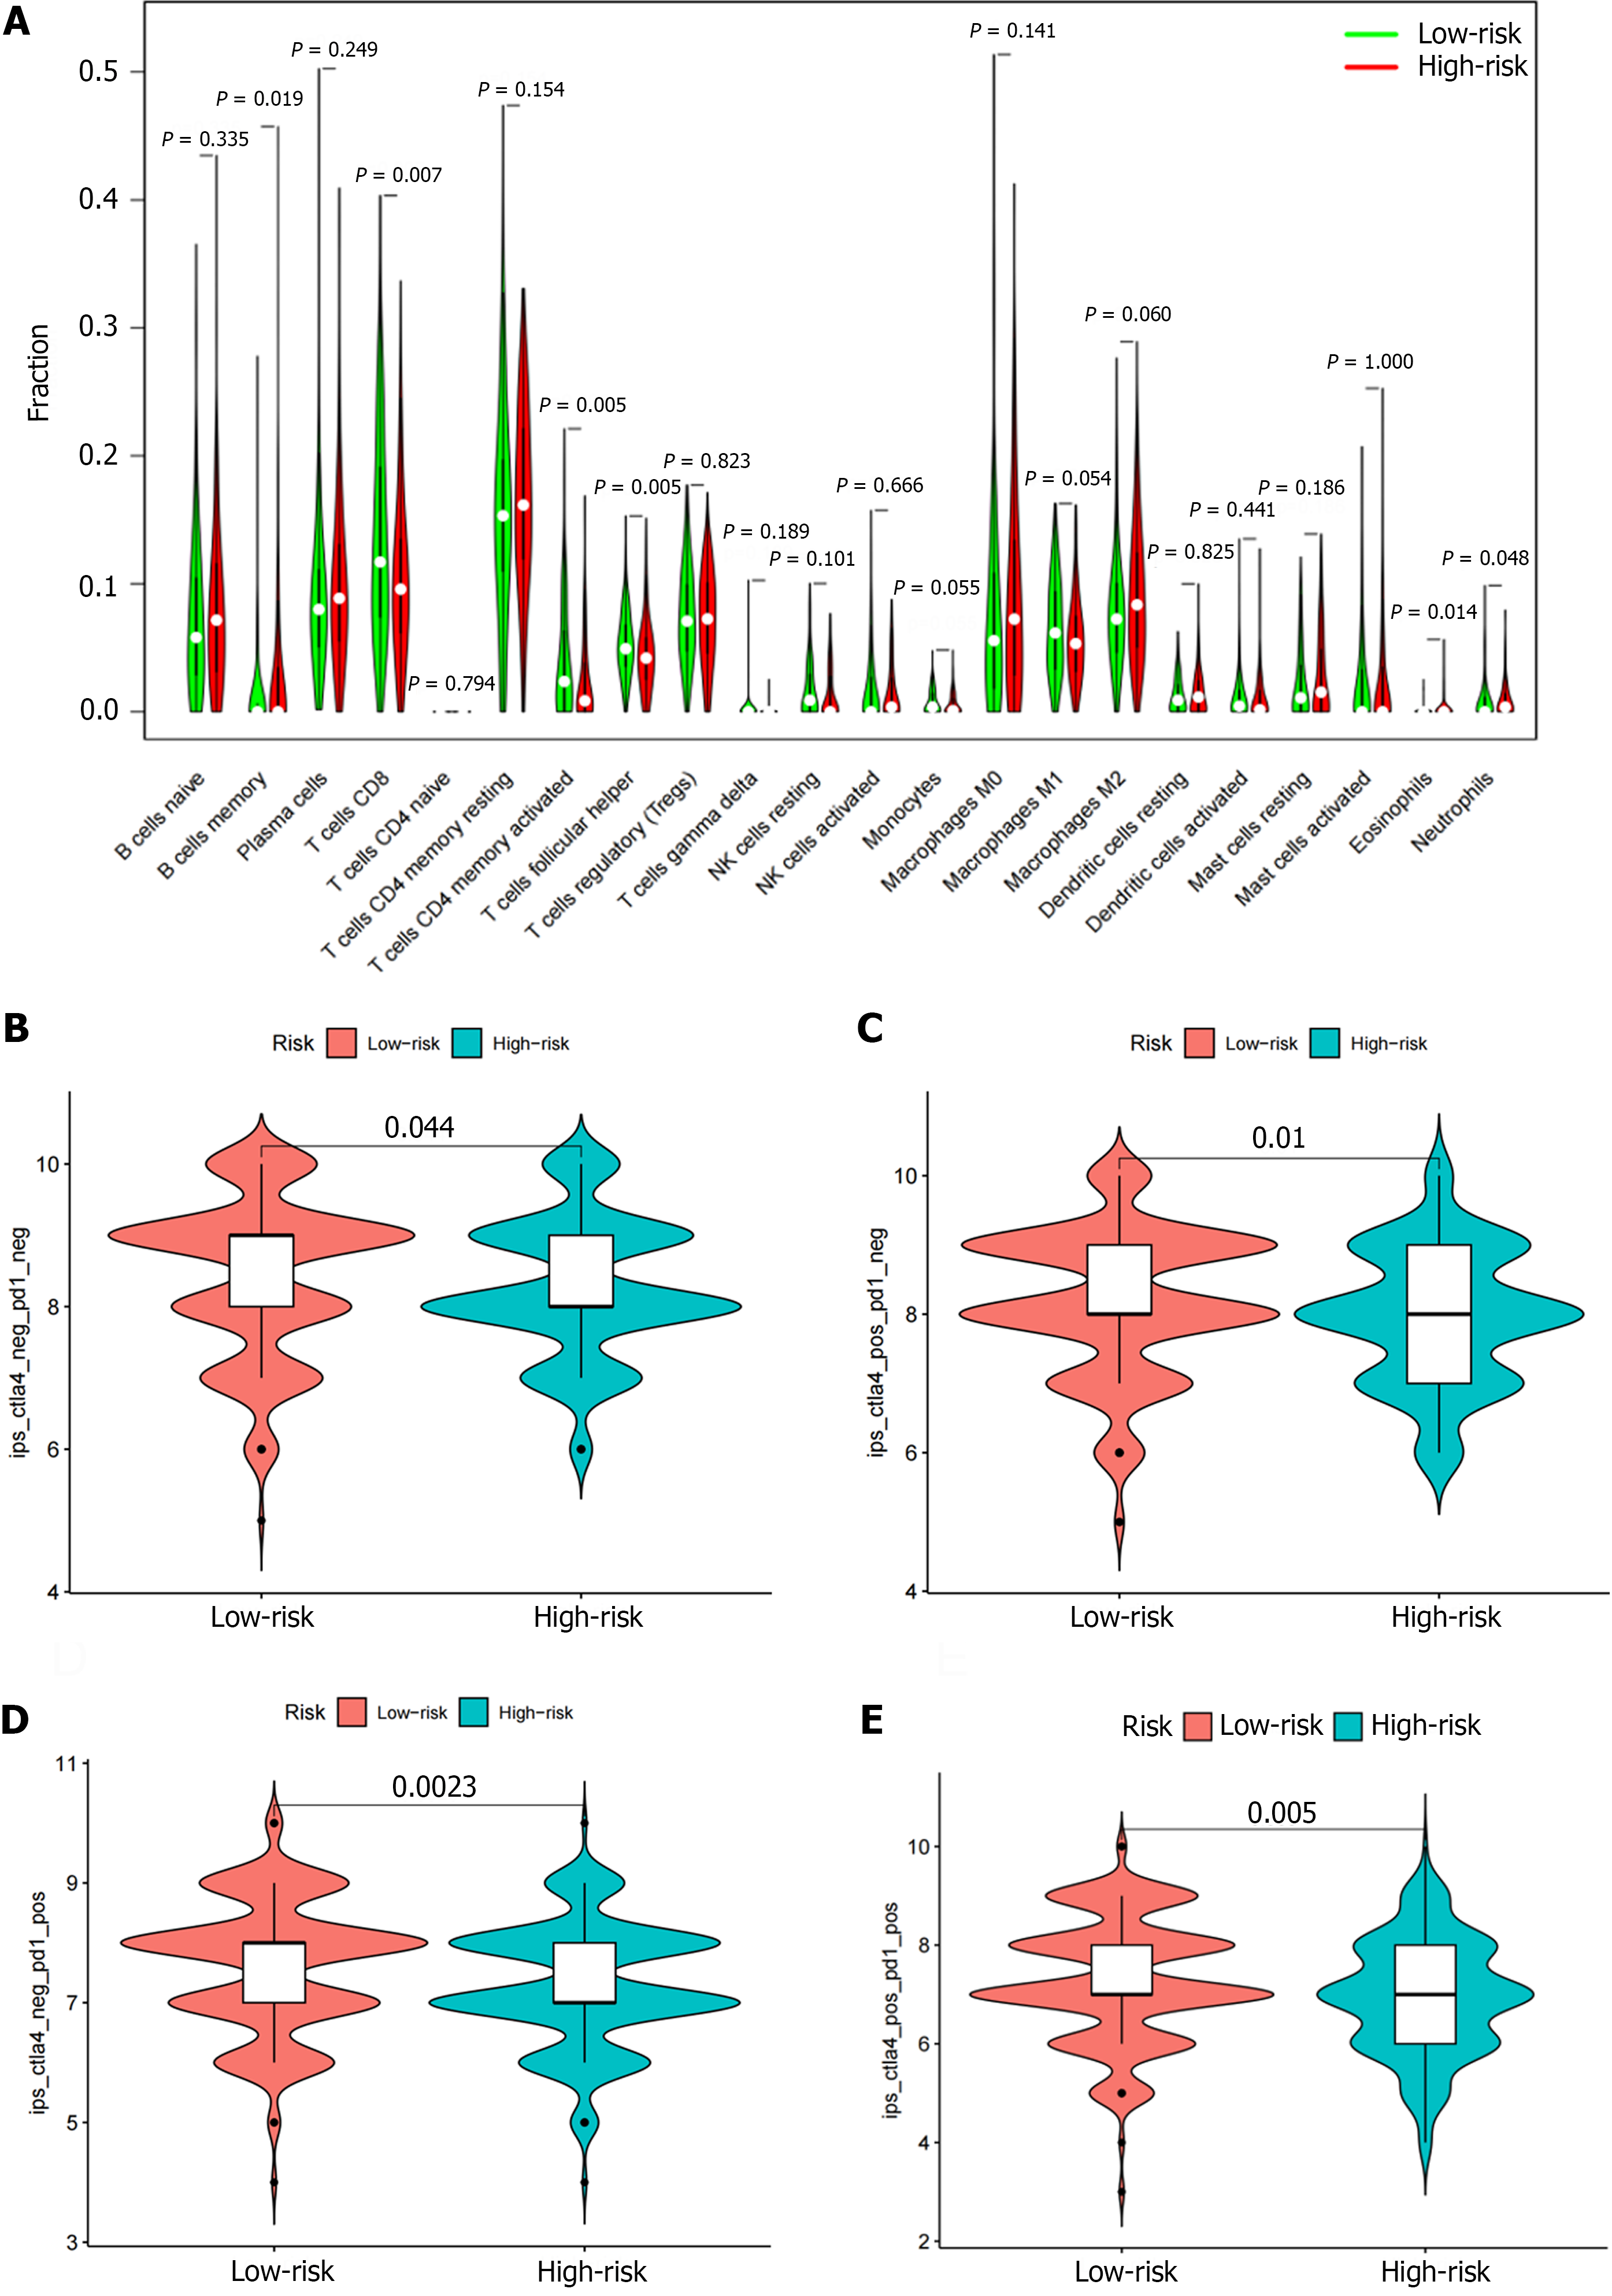
Figure 9 Correlation analysis of different types of immune cells and risk scores.
A: The percentages of CD8 T cells, activated CD4 memory T cells, follicular helper T cells, and neutrophils in the low-risk group were higher than the high-risk group. The proportion of memory B cells and eosinophils in the high-risk group was higher than the low-risk group; B-E: Patients with low-risk scores had higher immunophenotype scores independent of cytotoxic T lymphocyte antigen 4 + or programmed death 1+.
- Citation: Ma XT, Liu X, Ou K, Yang L. Construction of an immune-related gene signature for overall survival prediction and immune infiltration in gastric cancer. World J Gastrointest Oncol 2024; 16(3): 919-932
- URL: https://www.wjgnet.com/1948-5204/full/v16/i3/919.htm
- DOI: https://dx.doi.org/10.4251/wjgo.v16.i3.919


