Copyright
©The Author(s) 2024.
World J Gastrointest Oncol. Feb 15, 2024; 16(2): 398-413
Published online Feb 15, 2024. doi: 10.4251/wjgo.v16.i2.398
Published online Feb 15, 2024. doi: 10.4251/wjgo.v16.i2.398
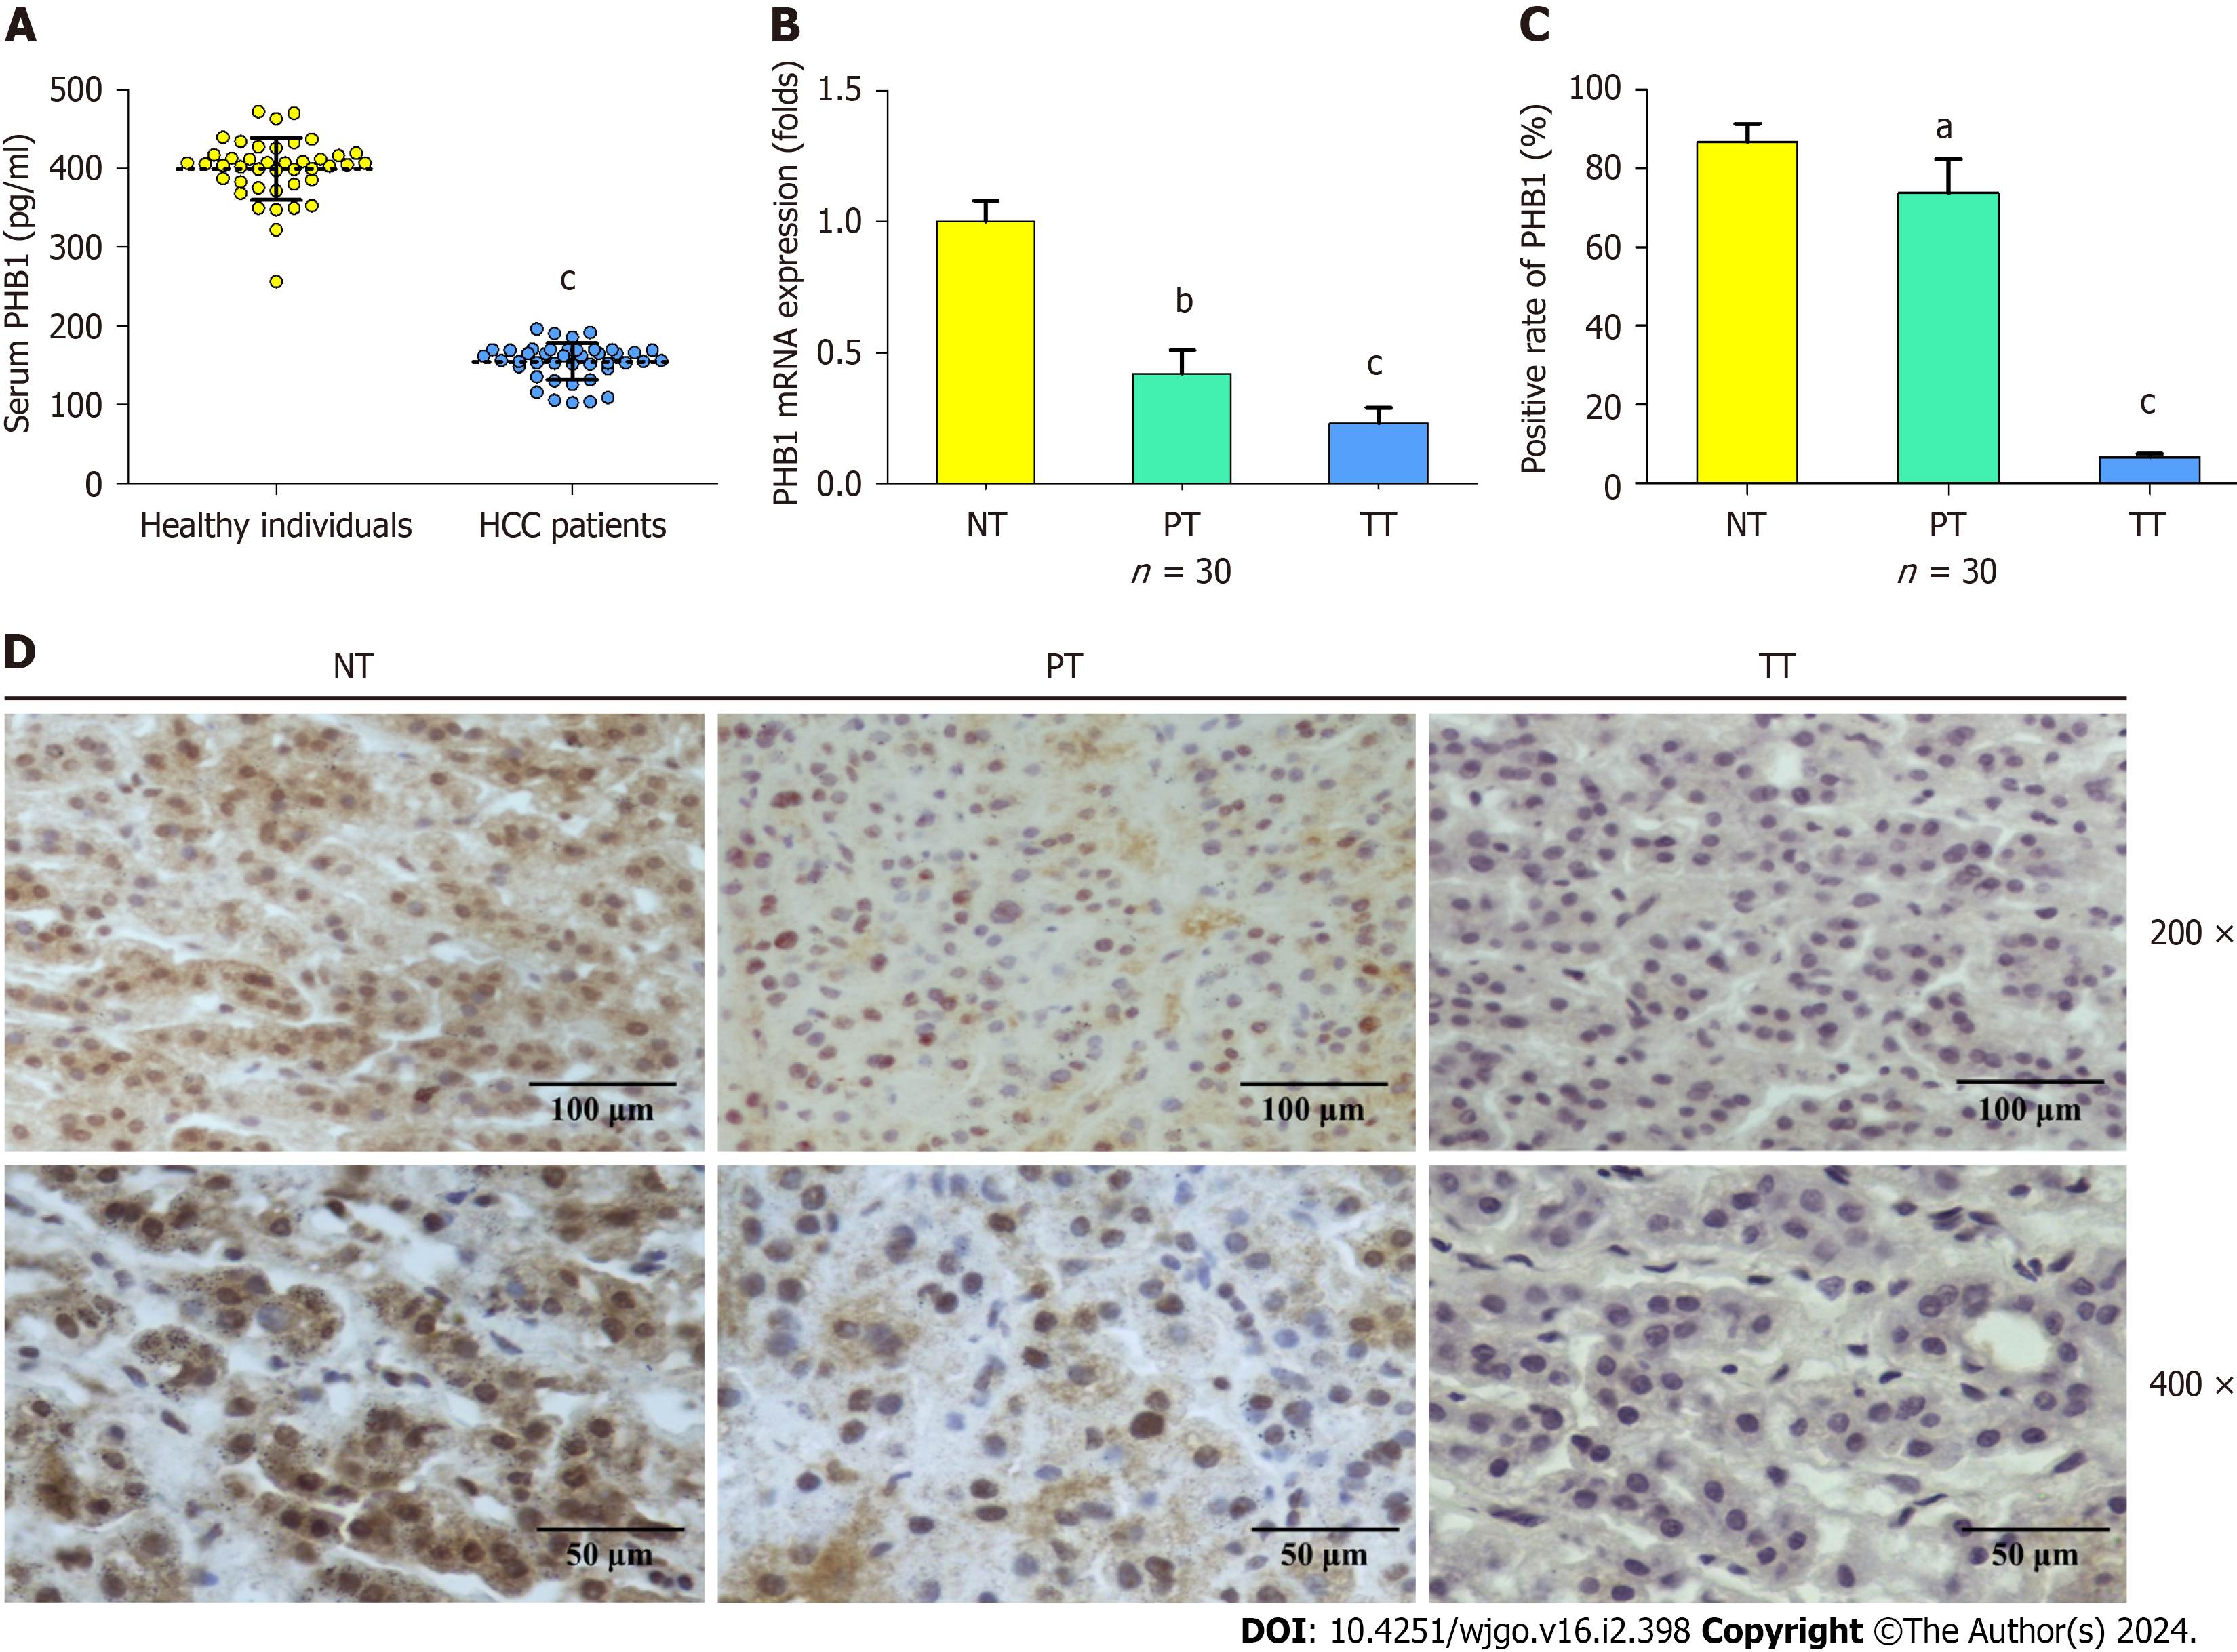
Figure 1 Prohibitin 1 expression in hepatocellular carcinoma patients.
A: Serum levels of Prohibitin 1 (PHB1) in hepatocellular carcinoma (HCC) patients (n = 42) and healthy individuals (n = 42) were measured by ELISA; B-D: PHB1 mRNA levels investigated using real-time PCR (B), rate of positive PHB1 expression (C), and immunohistochemical staining for PHB1 measured via immunohistochemistry (D) in normal tissues from healthy individuals (n = 30) as well as in peritumoral tissues and tumour tissues from HCC patients (n = 30, 200 × and 400 ×). The data are presented as the mean ± SEM of three independent experiments with similar results. aP < 0.05, bP < 0.01, cP < 0.001 vs healthy individuals. PT: Peritumoral tissues; TT: Tumour tissues; NT: Normal tissues; HCC: Hepatocellular carcinoma; PHB1: Prohibitin 1.
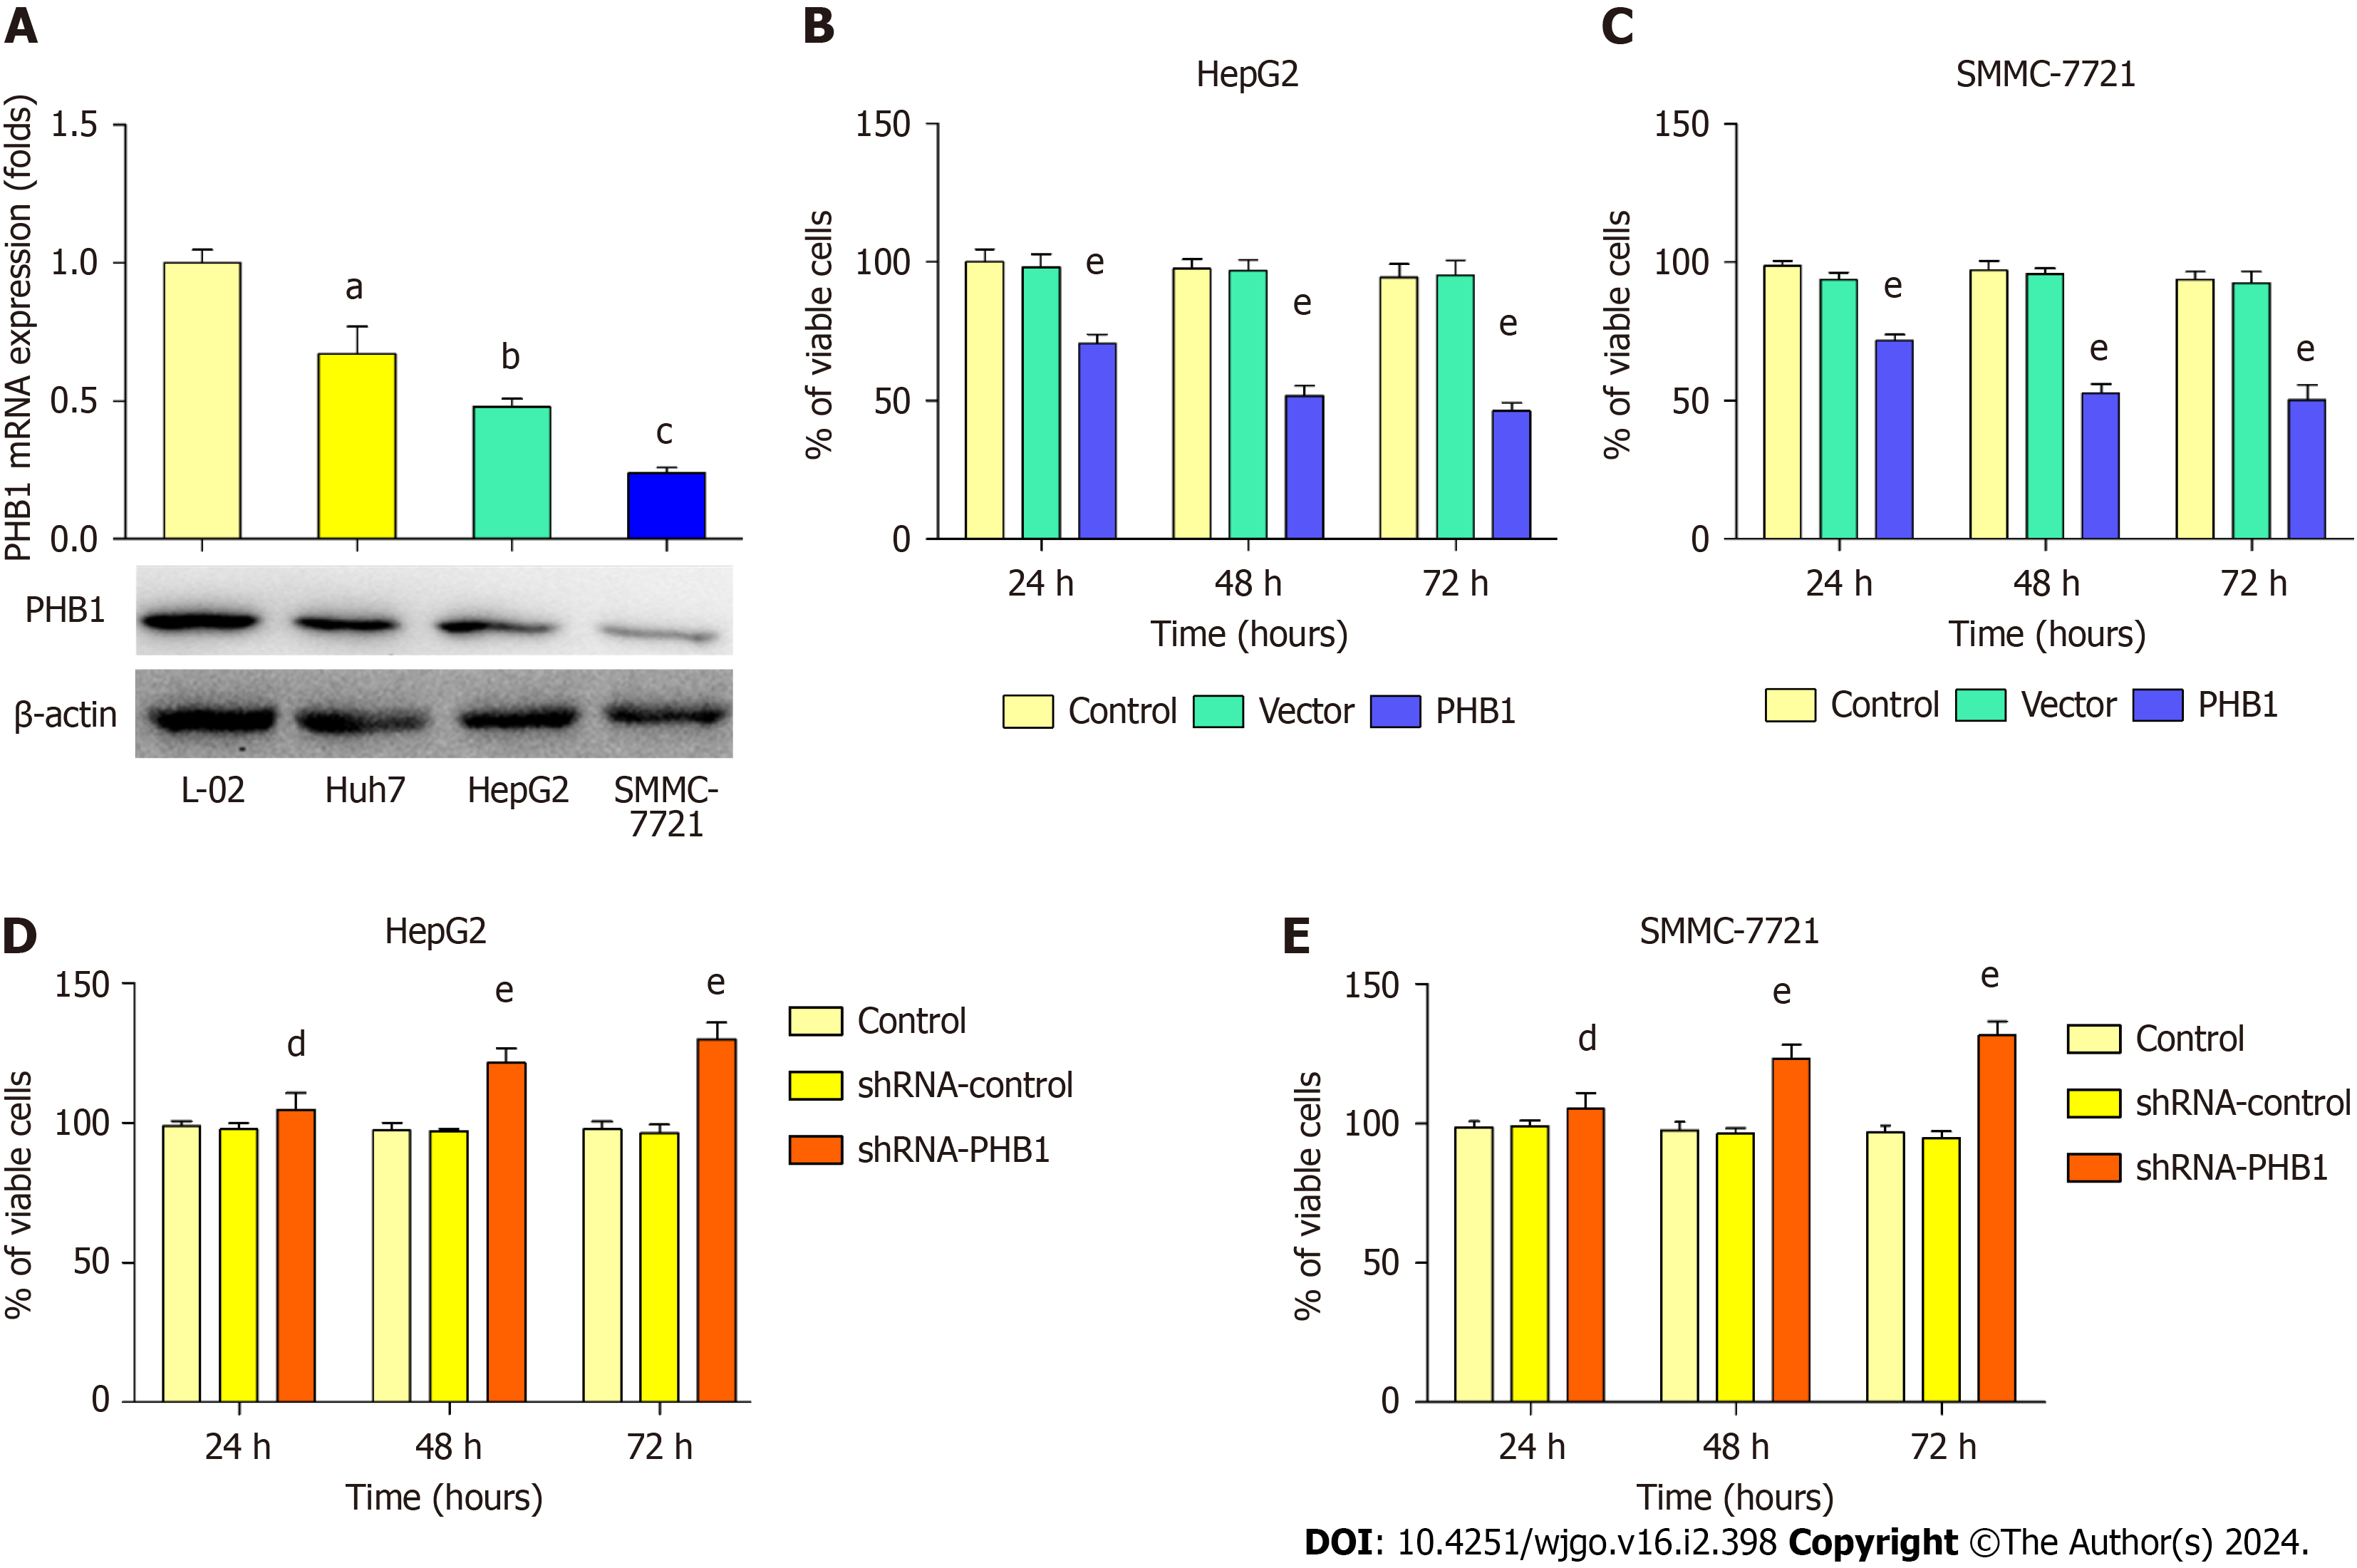
Figure 2 Prohibitin 1 inhibits the proliferation of hepatocellular carcinoma cells.
A: The Prohibitin 1 (PHB1) mRNA and protein levels in hepatocellular carcinoma cells were investigated using real-time PCR (upper panel) and Western blot (lower panel), respectively; B-E: HepG2 and SMMC-7721 cell viability was determined using MTT assays after transfection with pEGFP-PHB1 (B and C) or PHB1-specific shRNA (shRNA-PHB1; D and E) for 24, 48, or 72 h. The data are presented as the mean ± SD of three independent experiments with similar results. aP < 0.05, bP < 0.01, cP < 0.001 vs L-02 cells. dP < 0.05 and eP < 0.01 vs control and empty vector/shRNA-control, respectively. PHB1: Prohibitin 1.
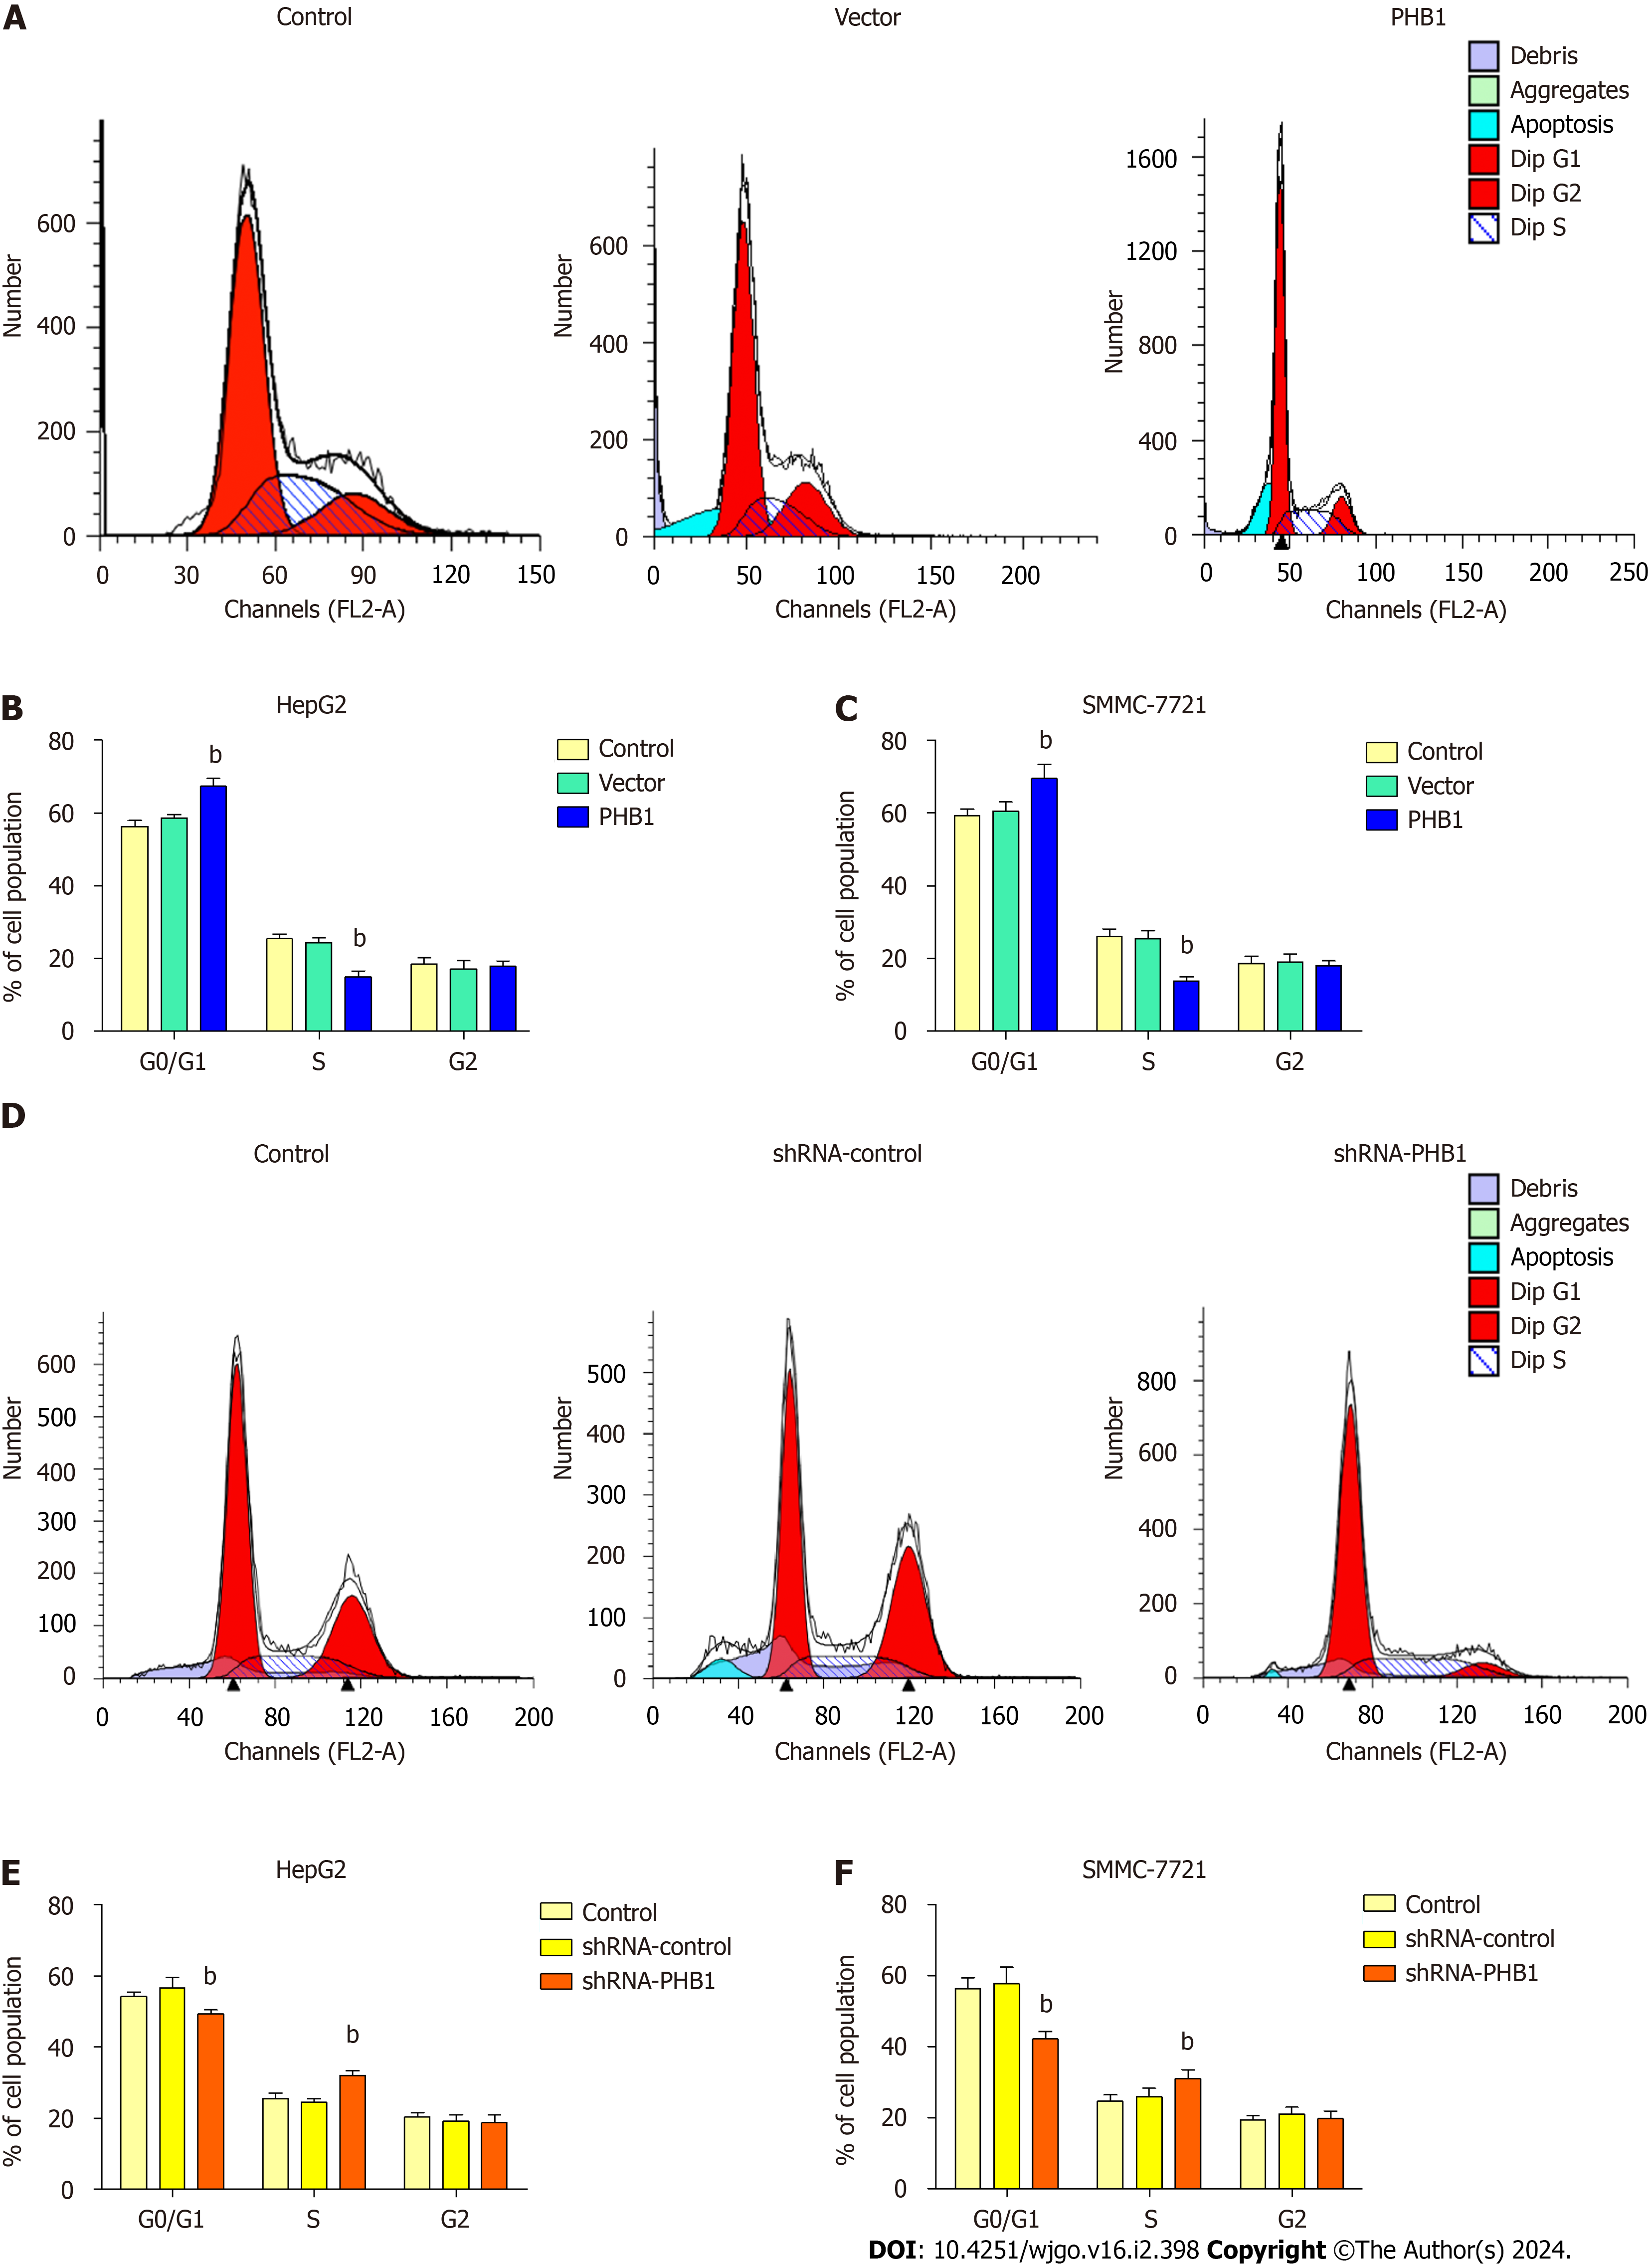
Figure 3 Effect of Prohibitin 1 expression on cell cycle progression of hepatocellular carcinoma cells.
A-F: HepG2 and SMMC-7721 cells were transfected with pEGFP-PHB1 (A-C) or shRNA-PHB1 (D-F) for 48 h. The cell cycle distribution was determined by flow cytometry, and the histograms present the mean percentage of the cell population in each phase of the cell cycle. The data are presented as the mean ± SD of three independent experiments with similar results. aP < 0.05 and bP < 0.01 vs control and empty vector/shRNA-control, respectively. PHB1: Prohibitin 1.
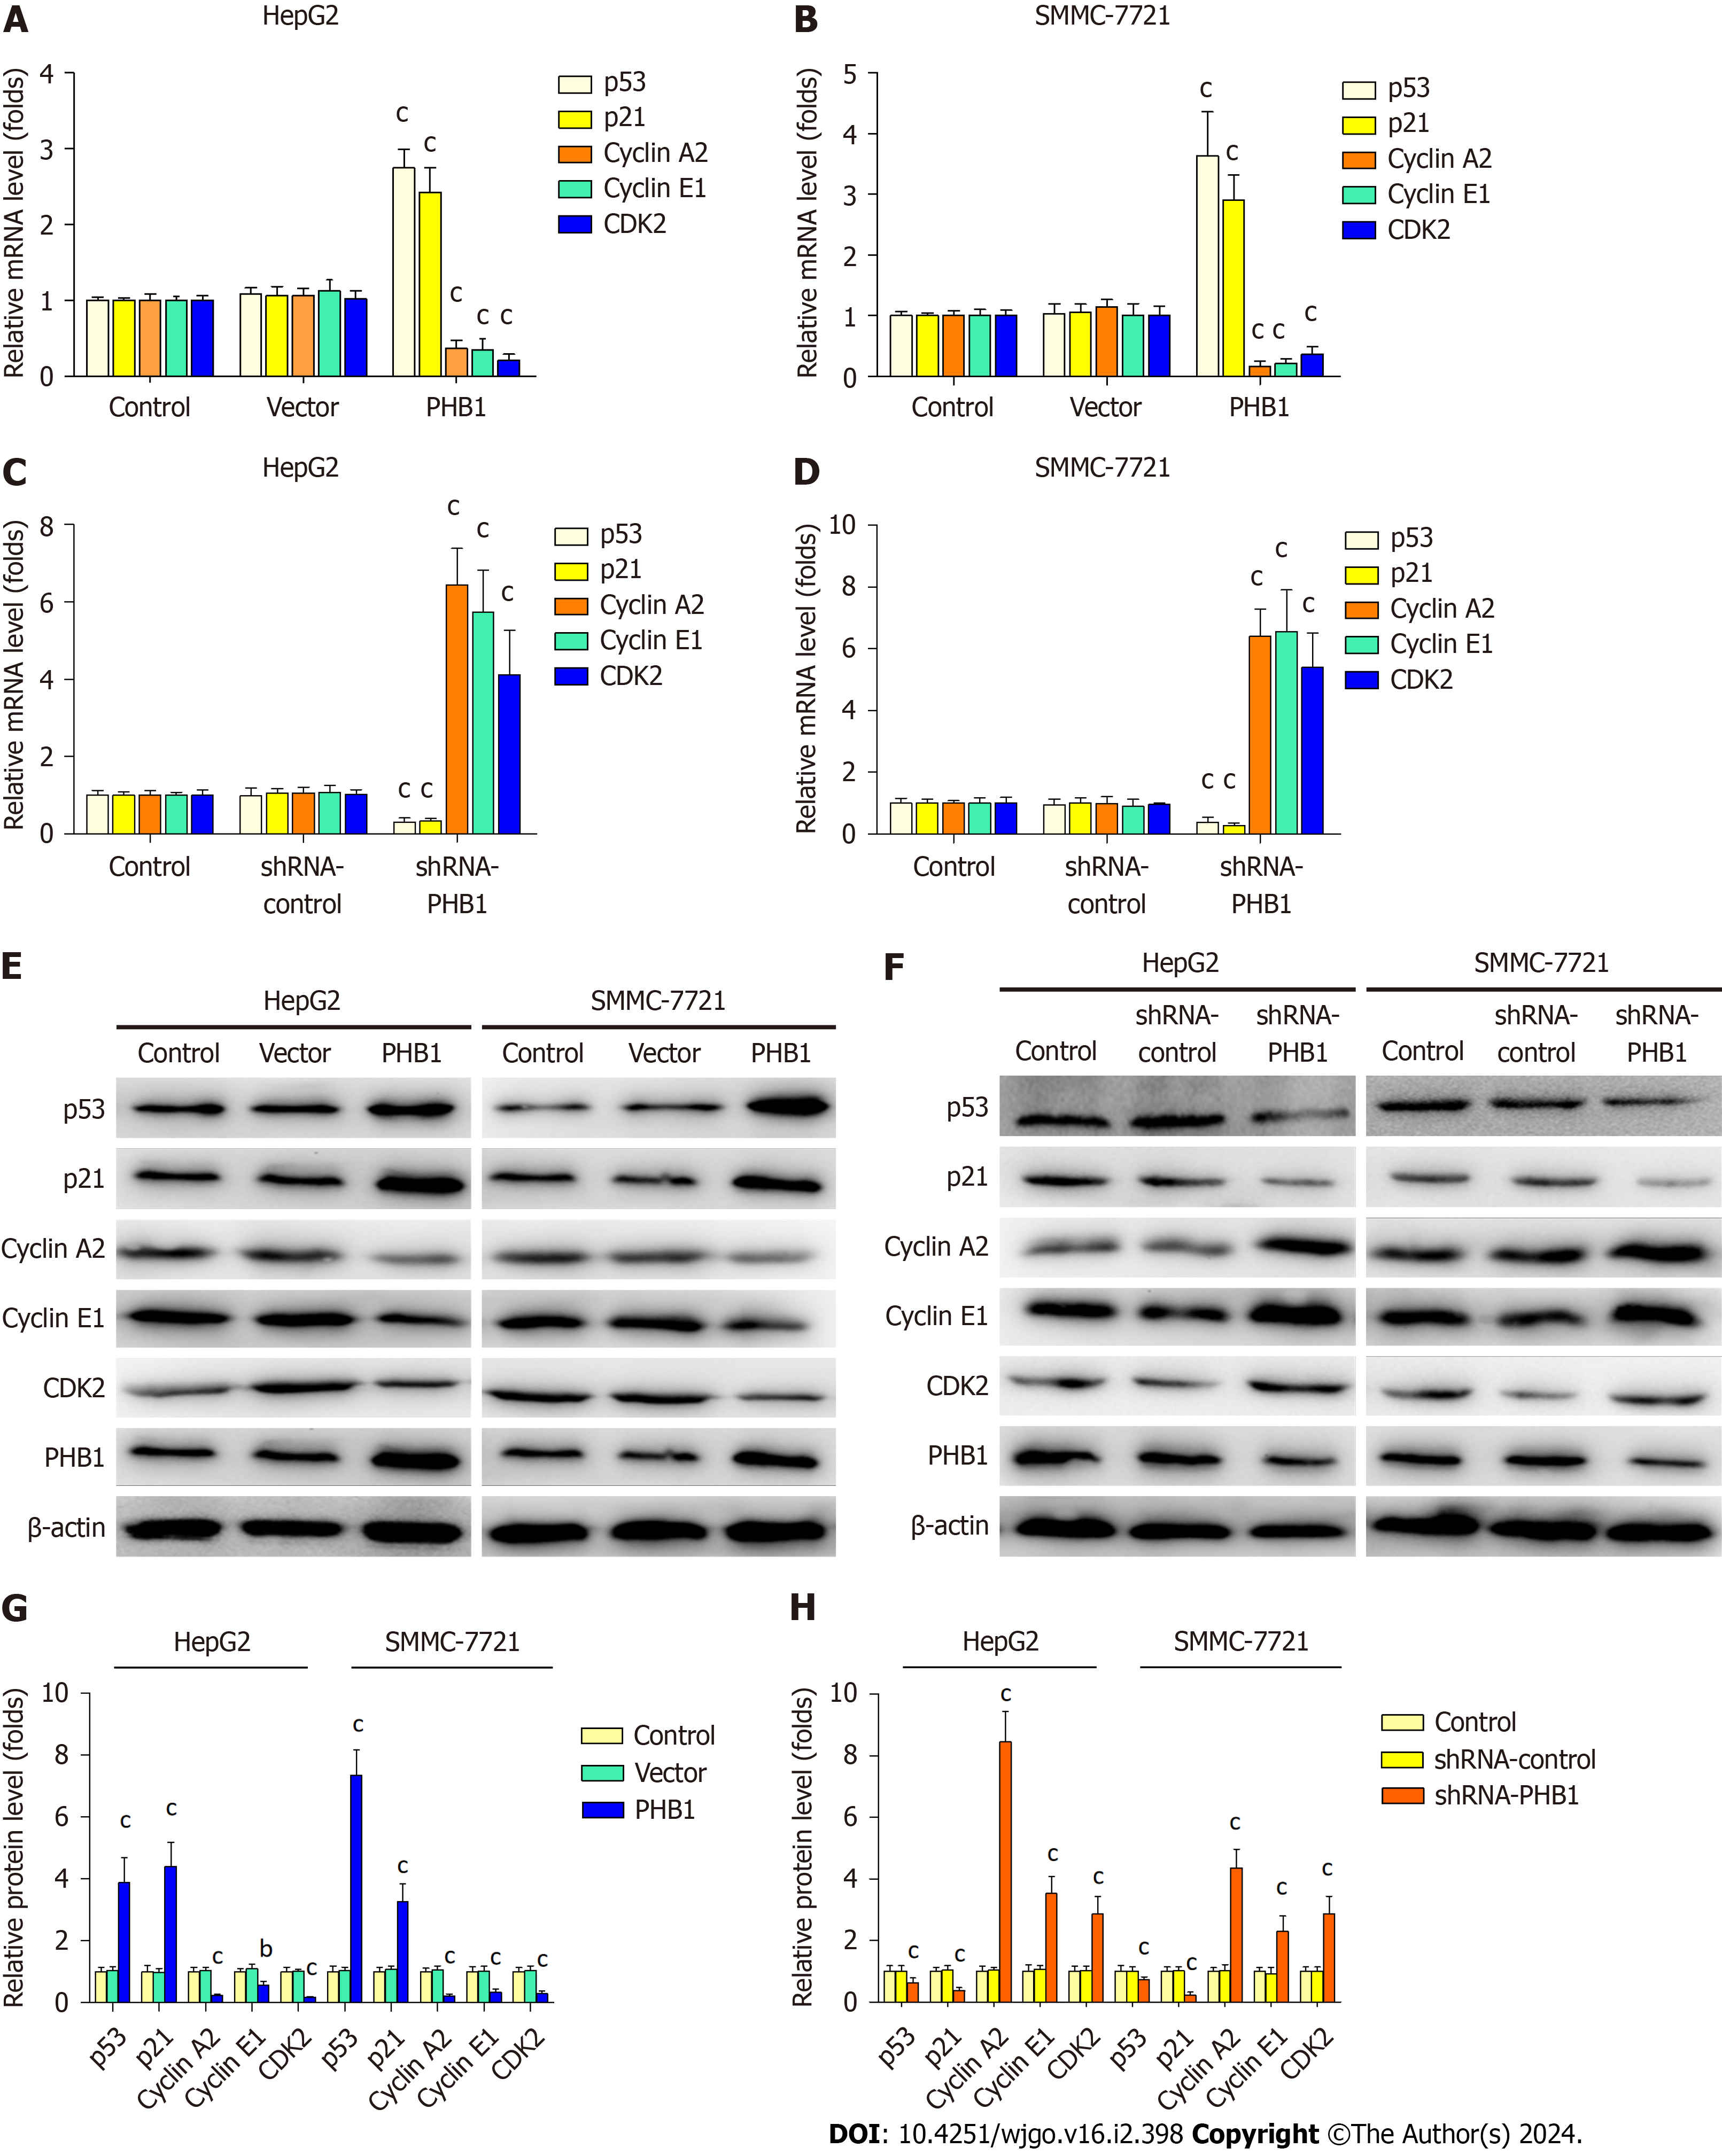
Figure 4 Prohibitin 1 regulates cell cycle progression in hepatocellular carcinoma cells.
A-H: The p53, p21, Cyclin A2, Cyclin E1, and CDK2 mRNA and protein levels in HepG2 and SMMC-7721 cells transfected with pEGFP-PHB1 or shRNA-PHB1 for 48 h were determined by real-time PCR (A-D) and Western blot (E-H), respectively. The data are presented as the mean ± SD of three independent experiments with similar results. aP < 0.05, bP < 0.01, and cP < 0.001 vs control and empty vector/shRNA-control.
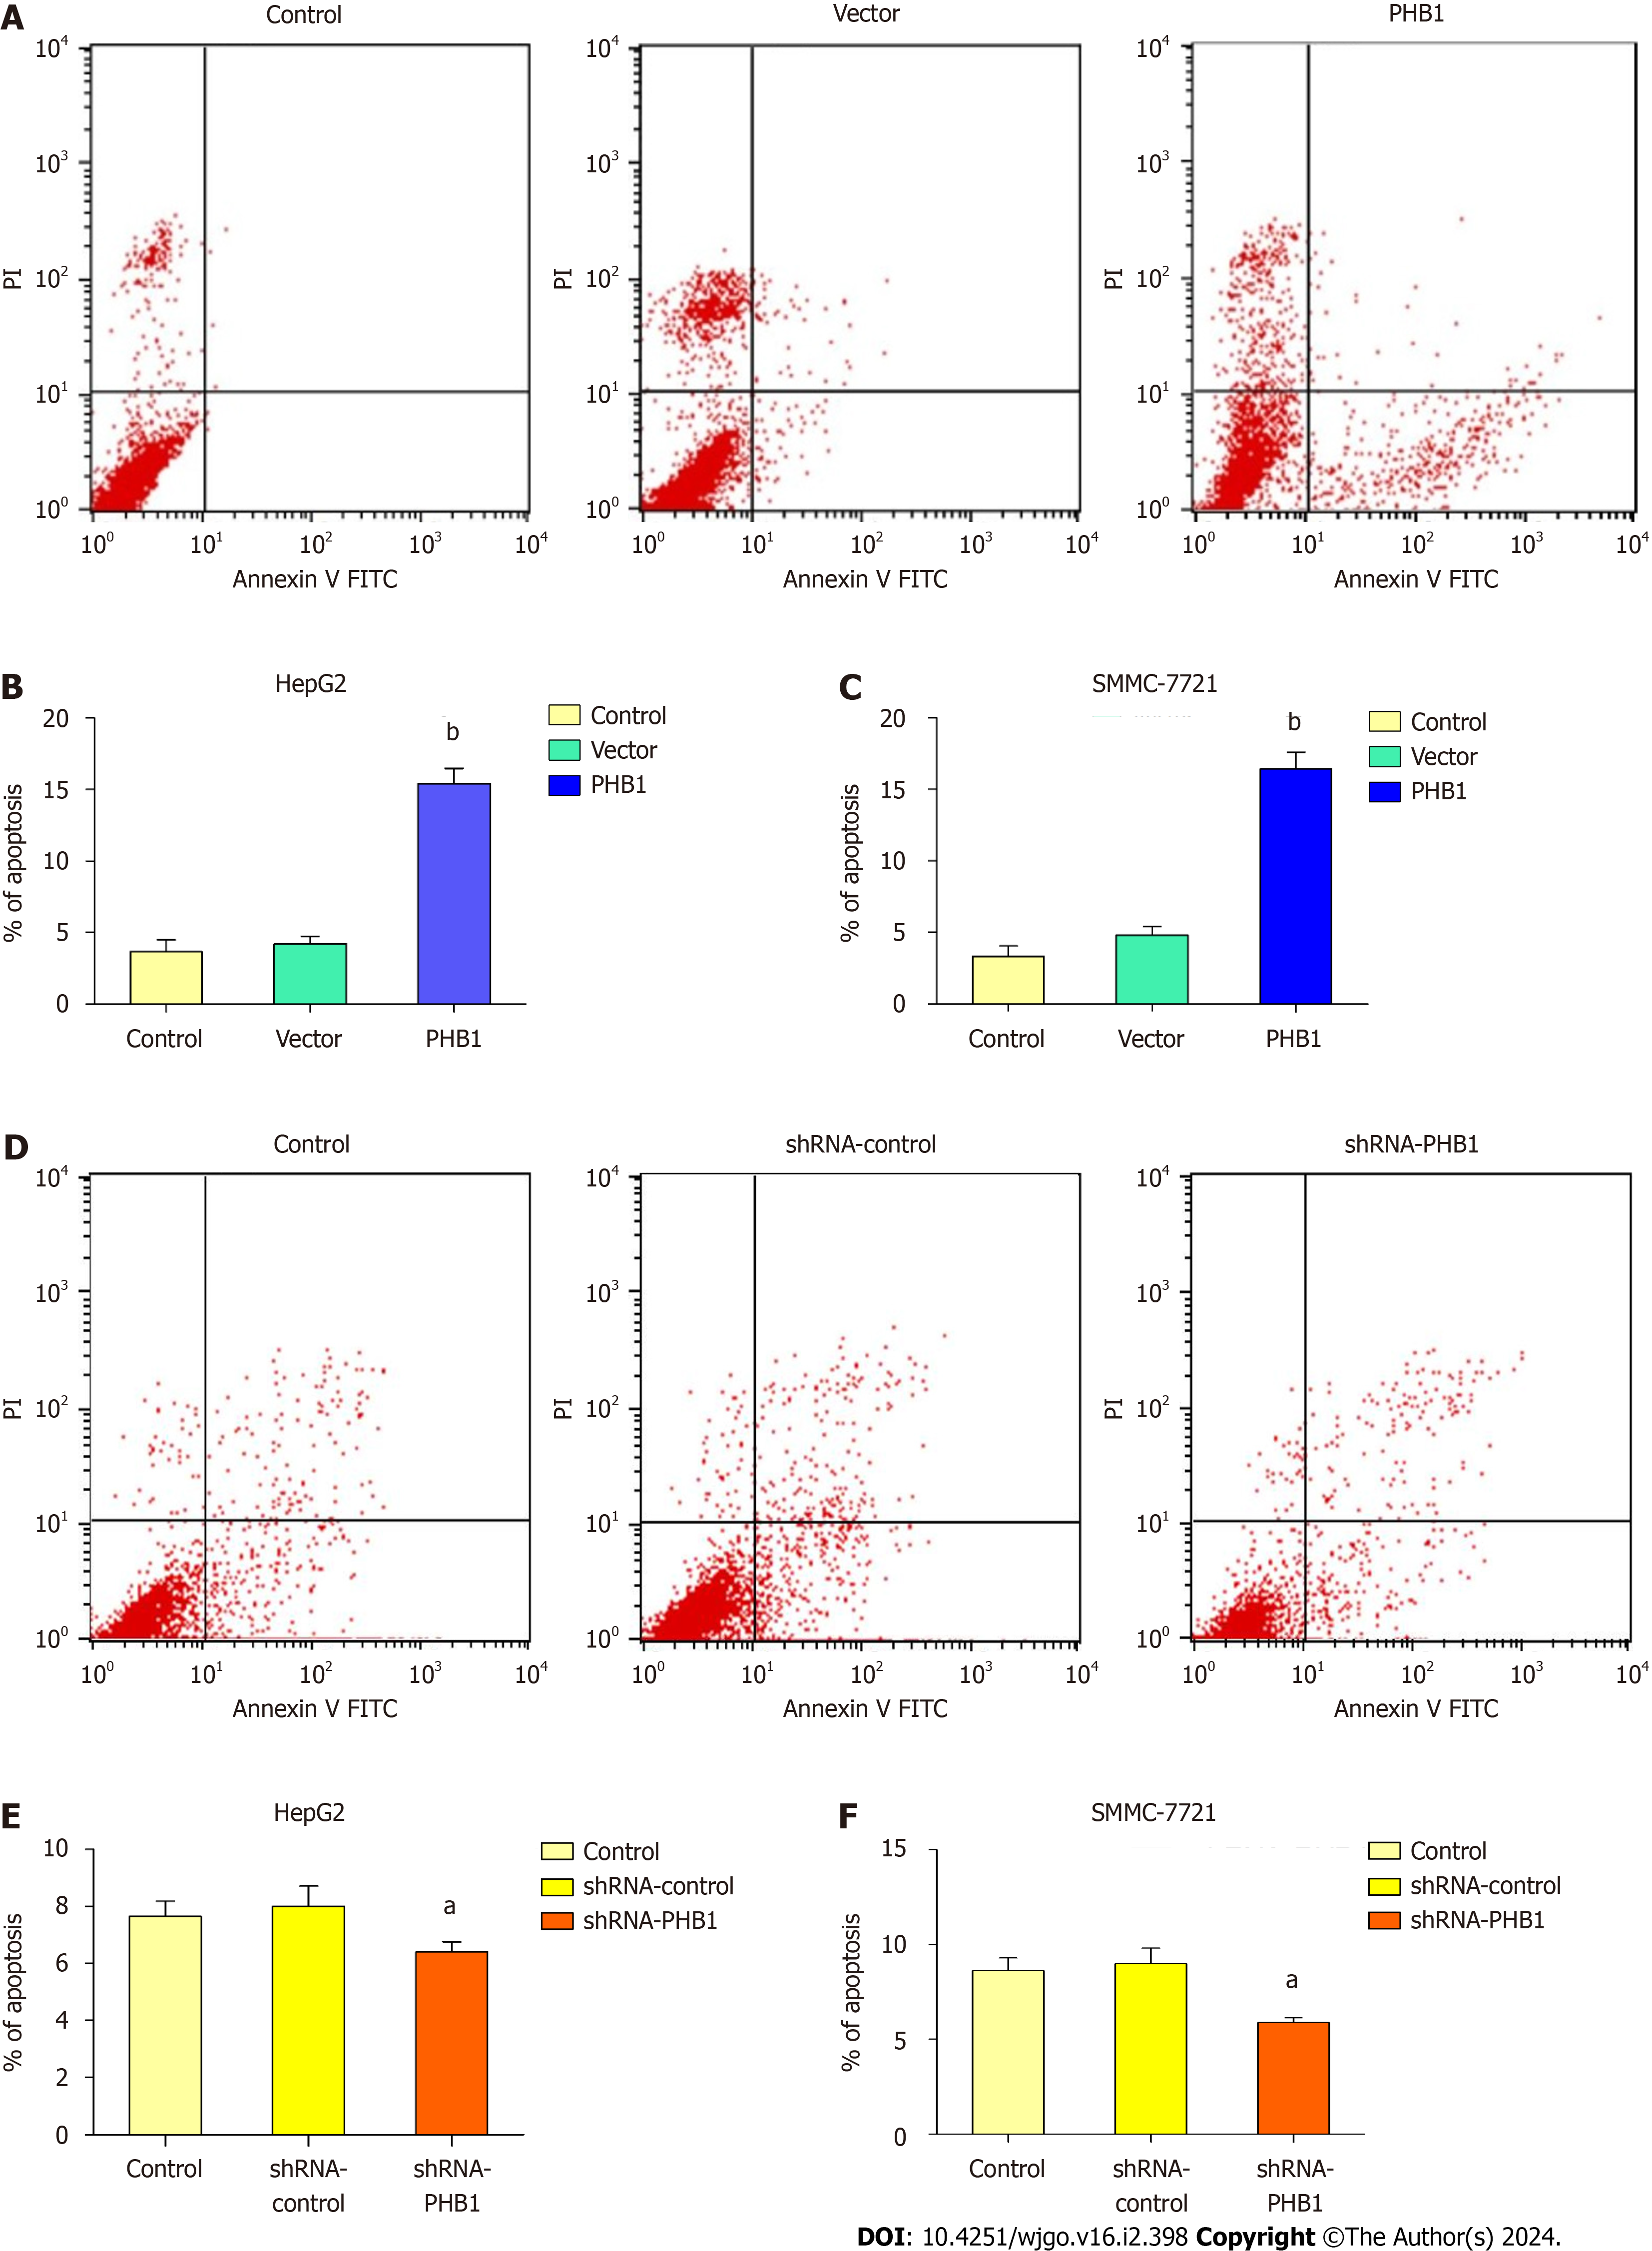
Figure 5 Effect of Prohibitin 1 expression on hepatocellular carcinoma cell apoptosis.
A-F: HepG2 and SMMC-7721 cells were transfected with pEGFP-PHB1 (A-C) or shRNA-PHB1 (D-F) for 48 h. Cell apoptosis was investigated using Annexin V-FITC and PI and was analysed by flow cytometry. The histograms present the mean percentage of apoptotic cells. The data are presented as the mean ± SD of three independent experiments with similar results. aP < 0.05 and bP < 0.01 vs control and empty vector/shRNA-control, respectively.
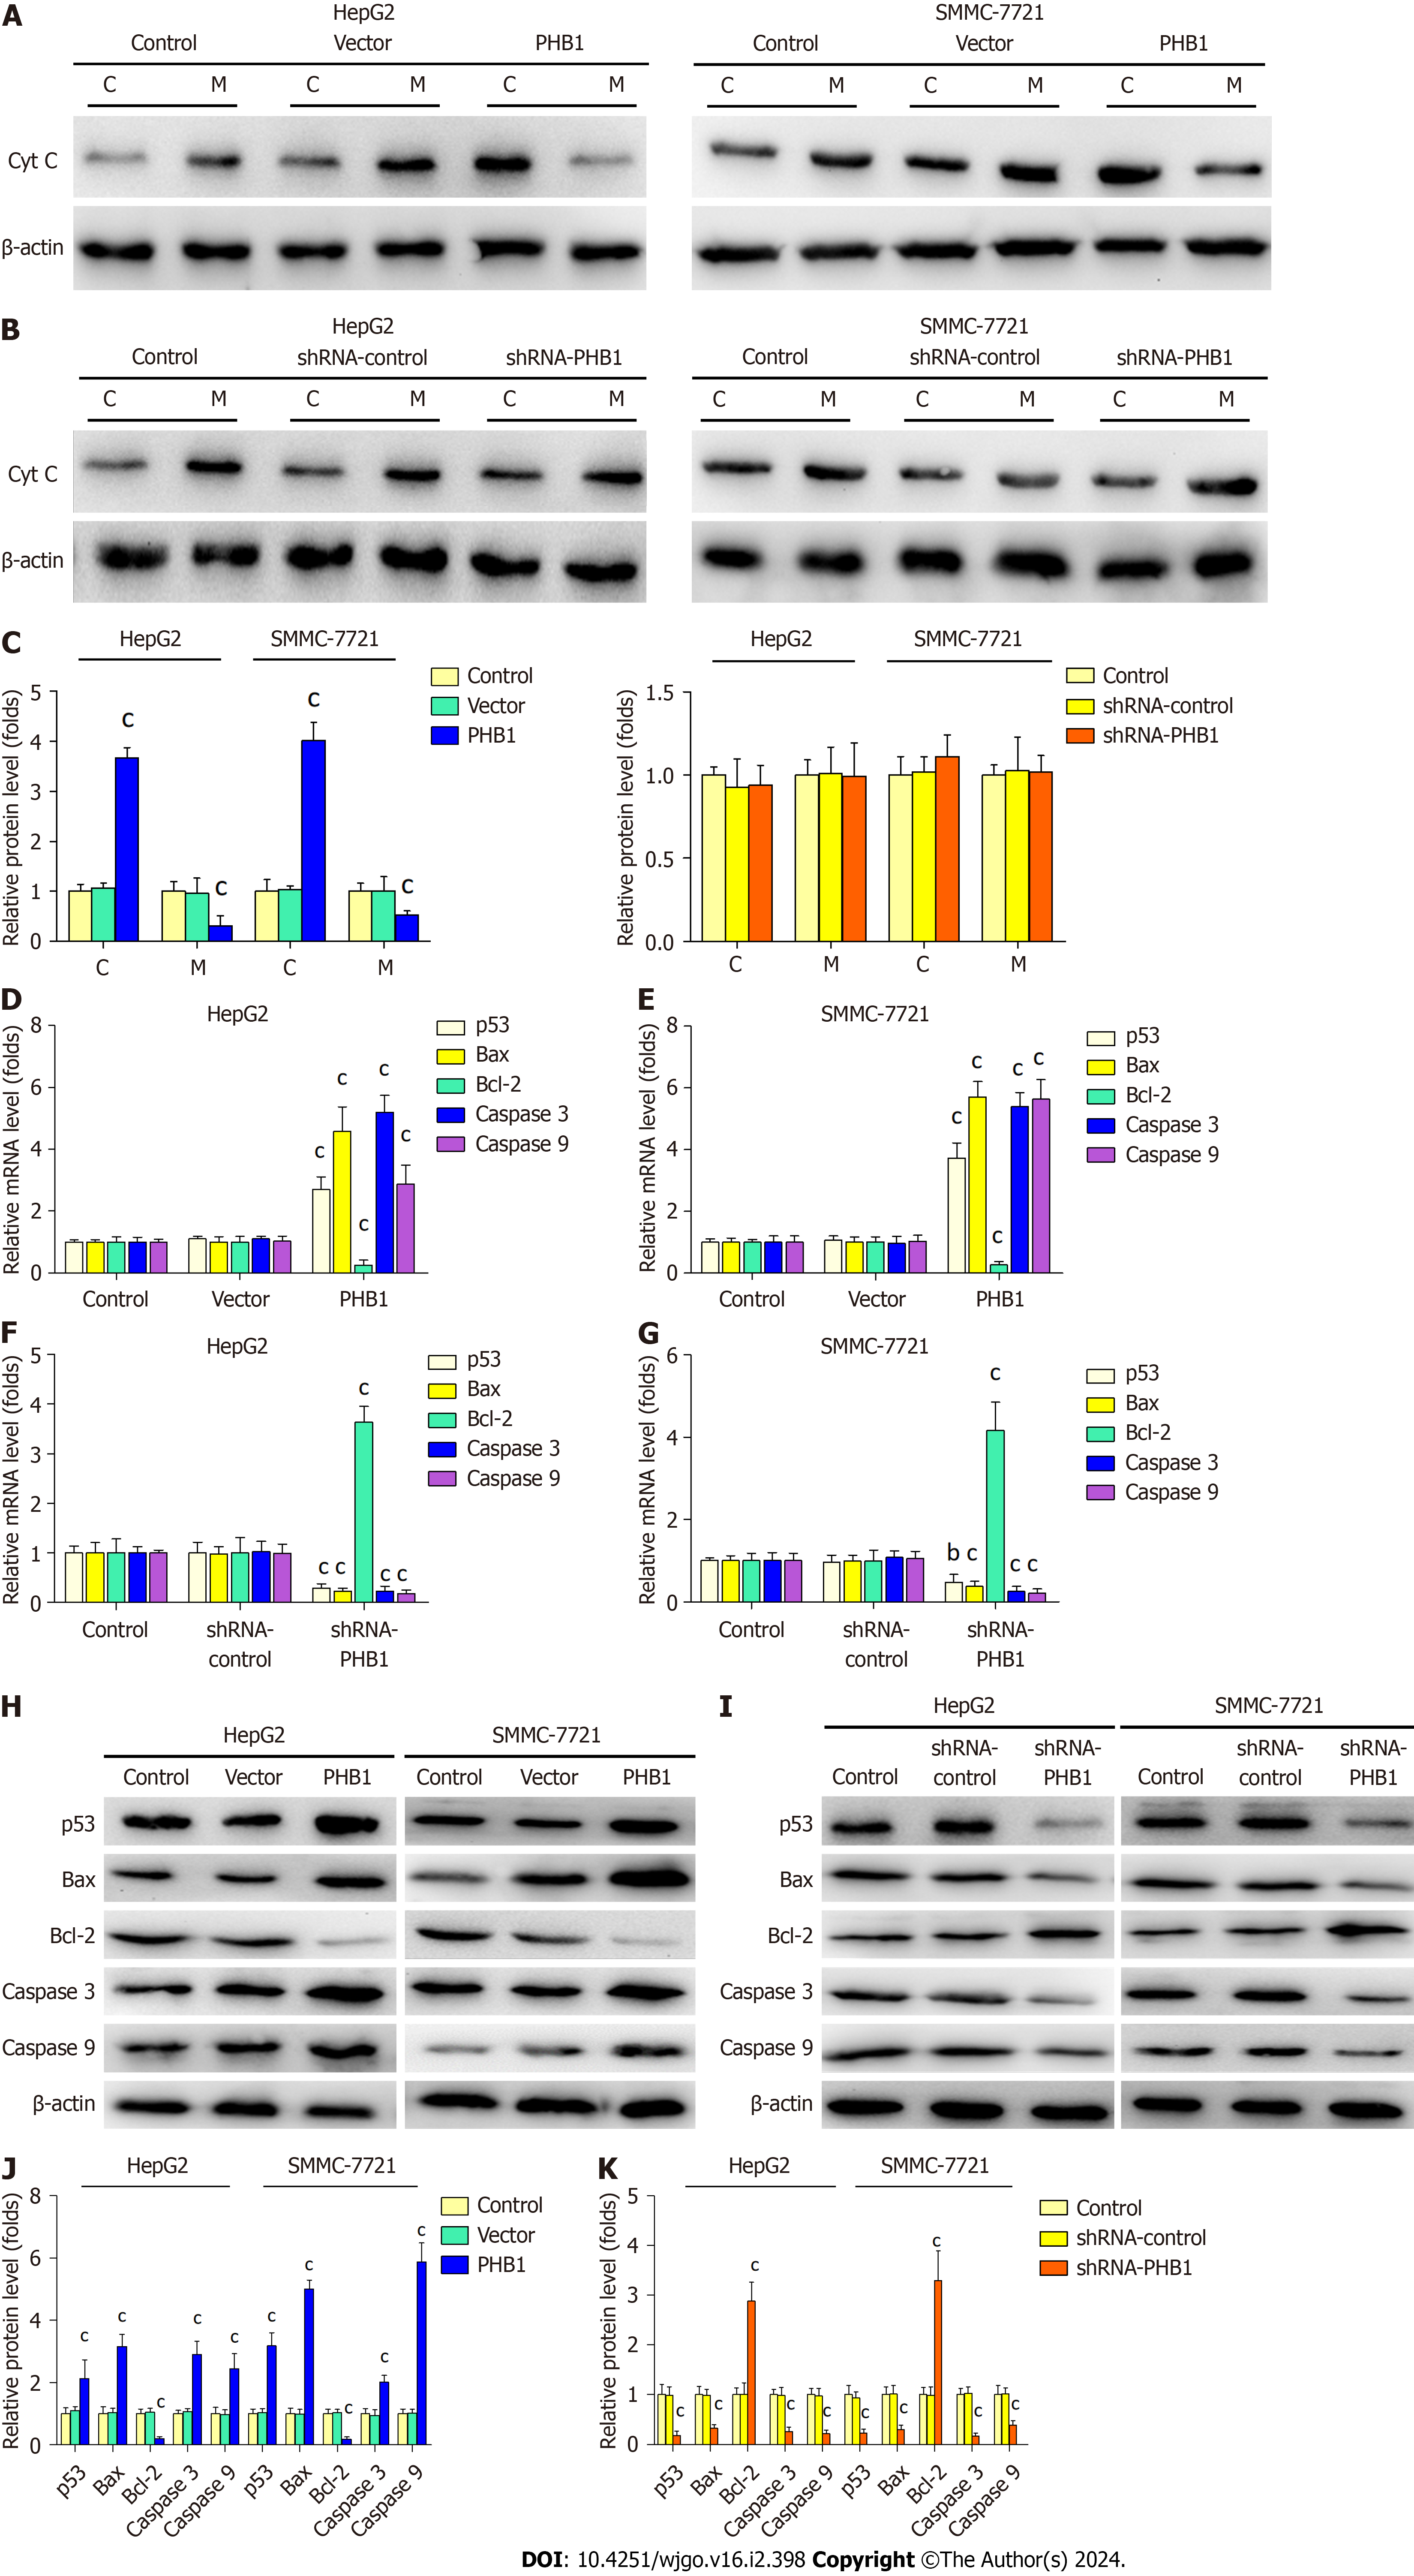
Figure 6 Prohibitin 1 is involved in intrinsic mitochondrial signalling pathway activation.
A-K: HepG2 and SMMC-7721 cells were transfected with pEGFP-PHB1 or shRNA-PHB1 for 48 h. Cytochrome C protein levels in the cytosol (C) and mitochondrium (M) were determined via Western blot analyses (A-C); p53, Bax, Bcl-2, caspase 3, and caspase 9 mRNA and protein levels were determined by real-time PCR (D-G) and Western blot (H-K), respectively. The data are presented as the mean ± SD of three independent experiments with similar results. aP < 0.05, bP < 0.01, cP < 0.001 vs control and empty vector/shRNA-control. Cyt C: Cytochrome C.
- Citation: Shi JJ, Wang YK, Wang MQ, Deng J, Gao N, Li M, Li YP, Zhang X, Jia XL, Liu XT, Dang SS, Wang WJ. Prohibitin 1 inhibits cell proliferation and induces apoptosis via the p53-mediated mitochondrial pathway in vitro. World J Gastrointest Oncol 2024; 16(2): 398-413
- URL: https://www.wjgnet.com/1948-5204/full/v16/i2/398.htm
- DOI: https://dx.doi.org/10.4251/wjgo.v16.i2.398


