Copyright
©The Author(s) 2024.
World J Gastrointest Oncol. Feb 15, 2024; 16(2): 343-353
Published online Feb 15, 2024. doi: 10.4251/wjgo.v16.i2.343
Published online Feb 15, 2024. doi: 10.4251/wjgo.v16.i2.343
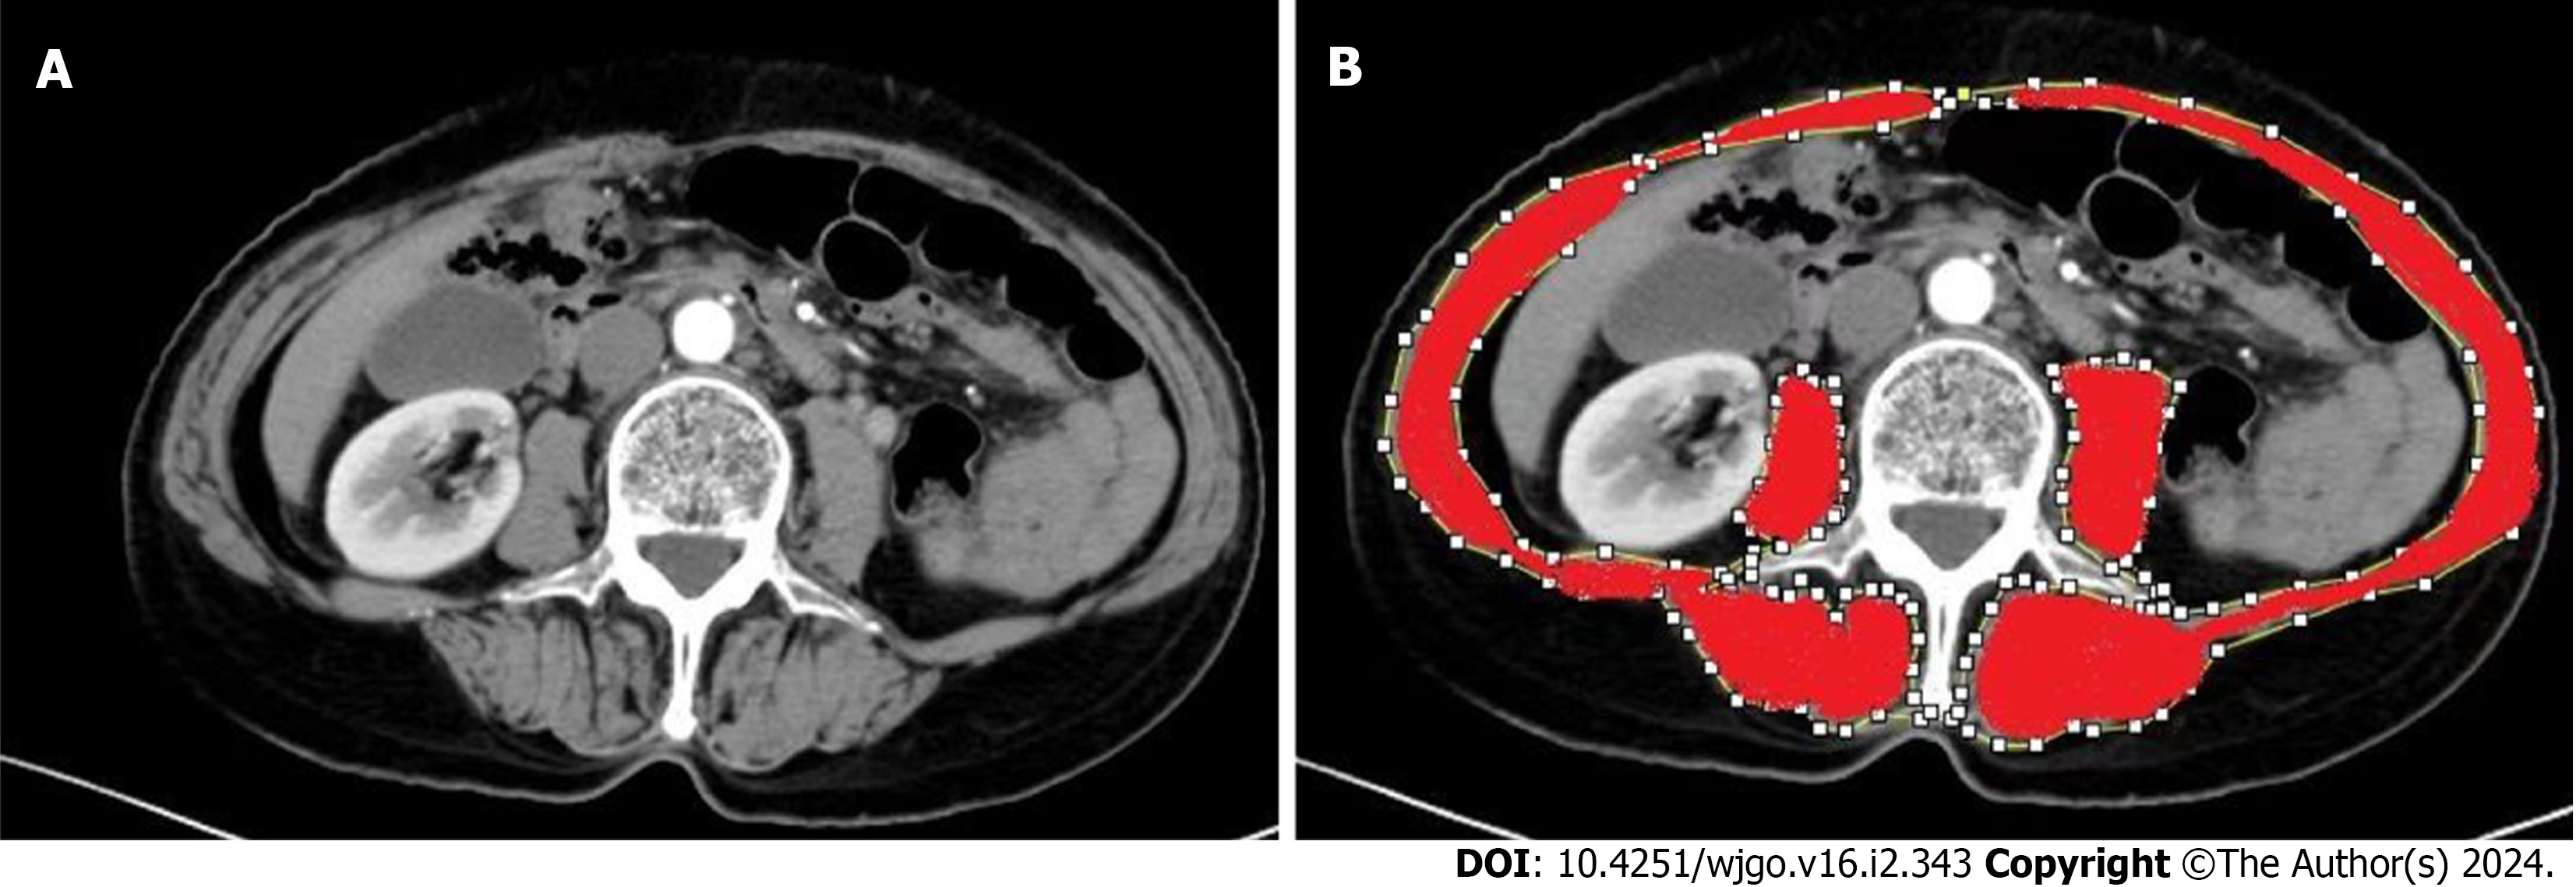
Figure 1 The measurement of skeletal muscle area.
A: The third lumbar vertebra on CT; B: The regions marked in red are the skeletal muscles, including the psoas major, paraspinal, transverse abdominis, external oblique, internal oblique, and rectus abdominis.
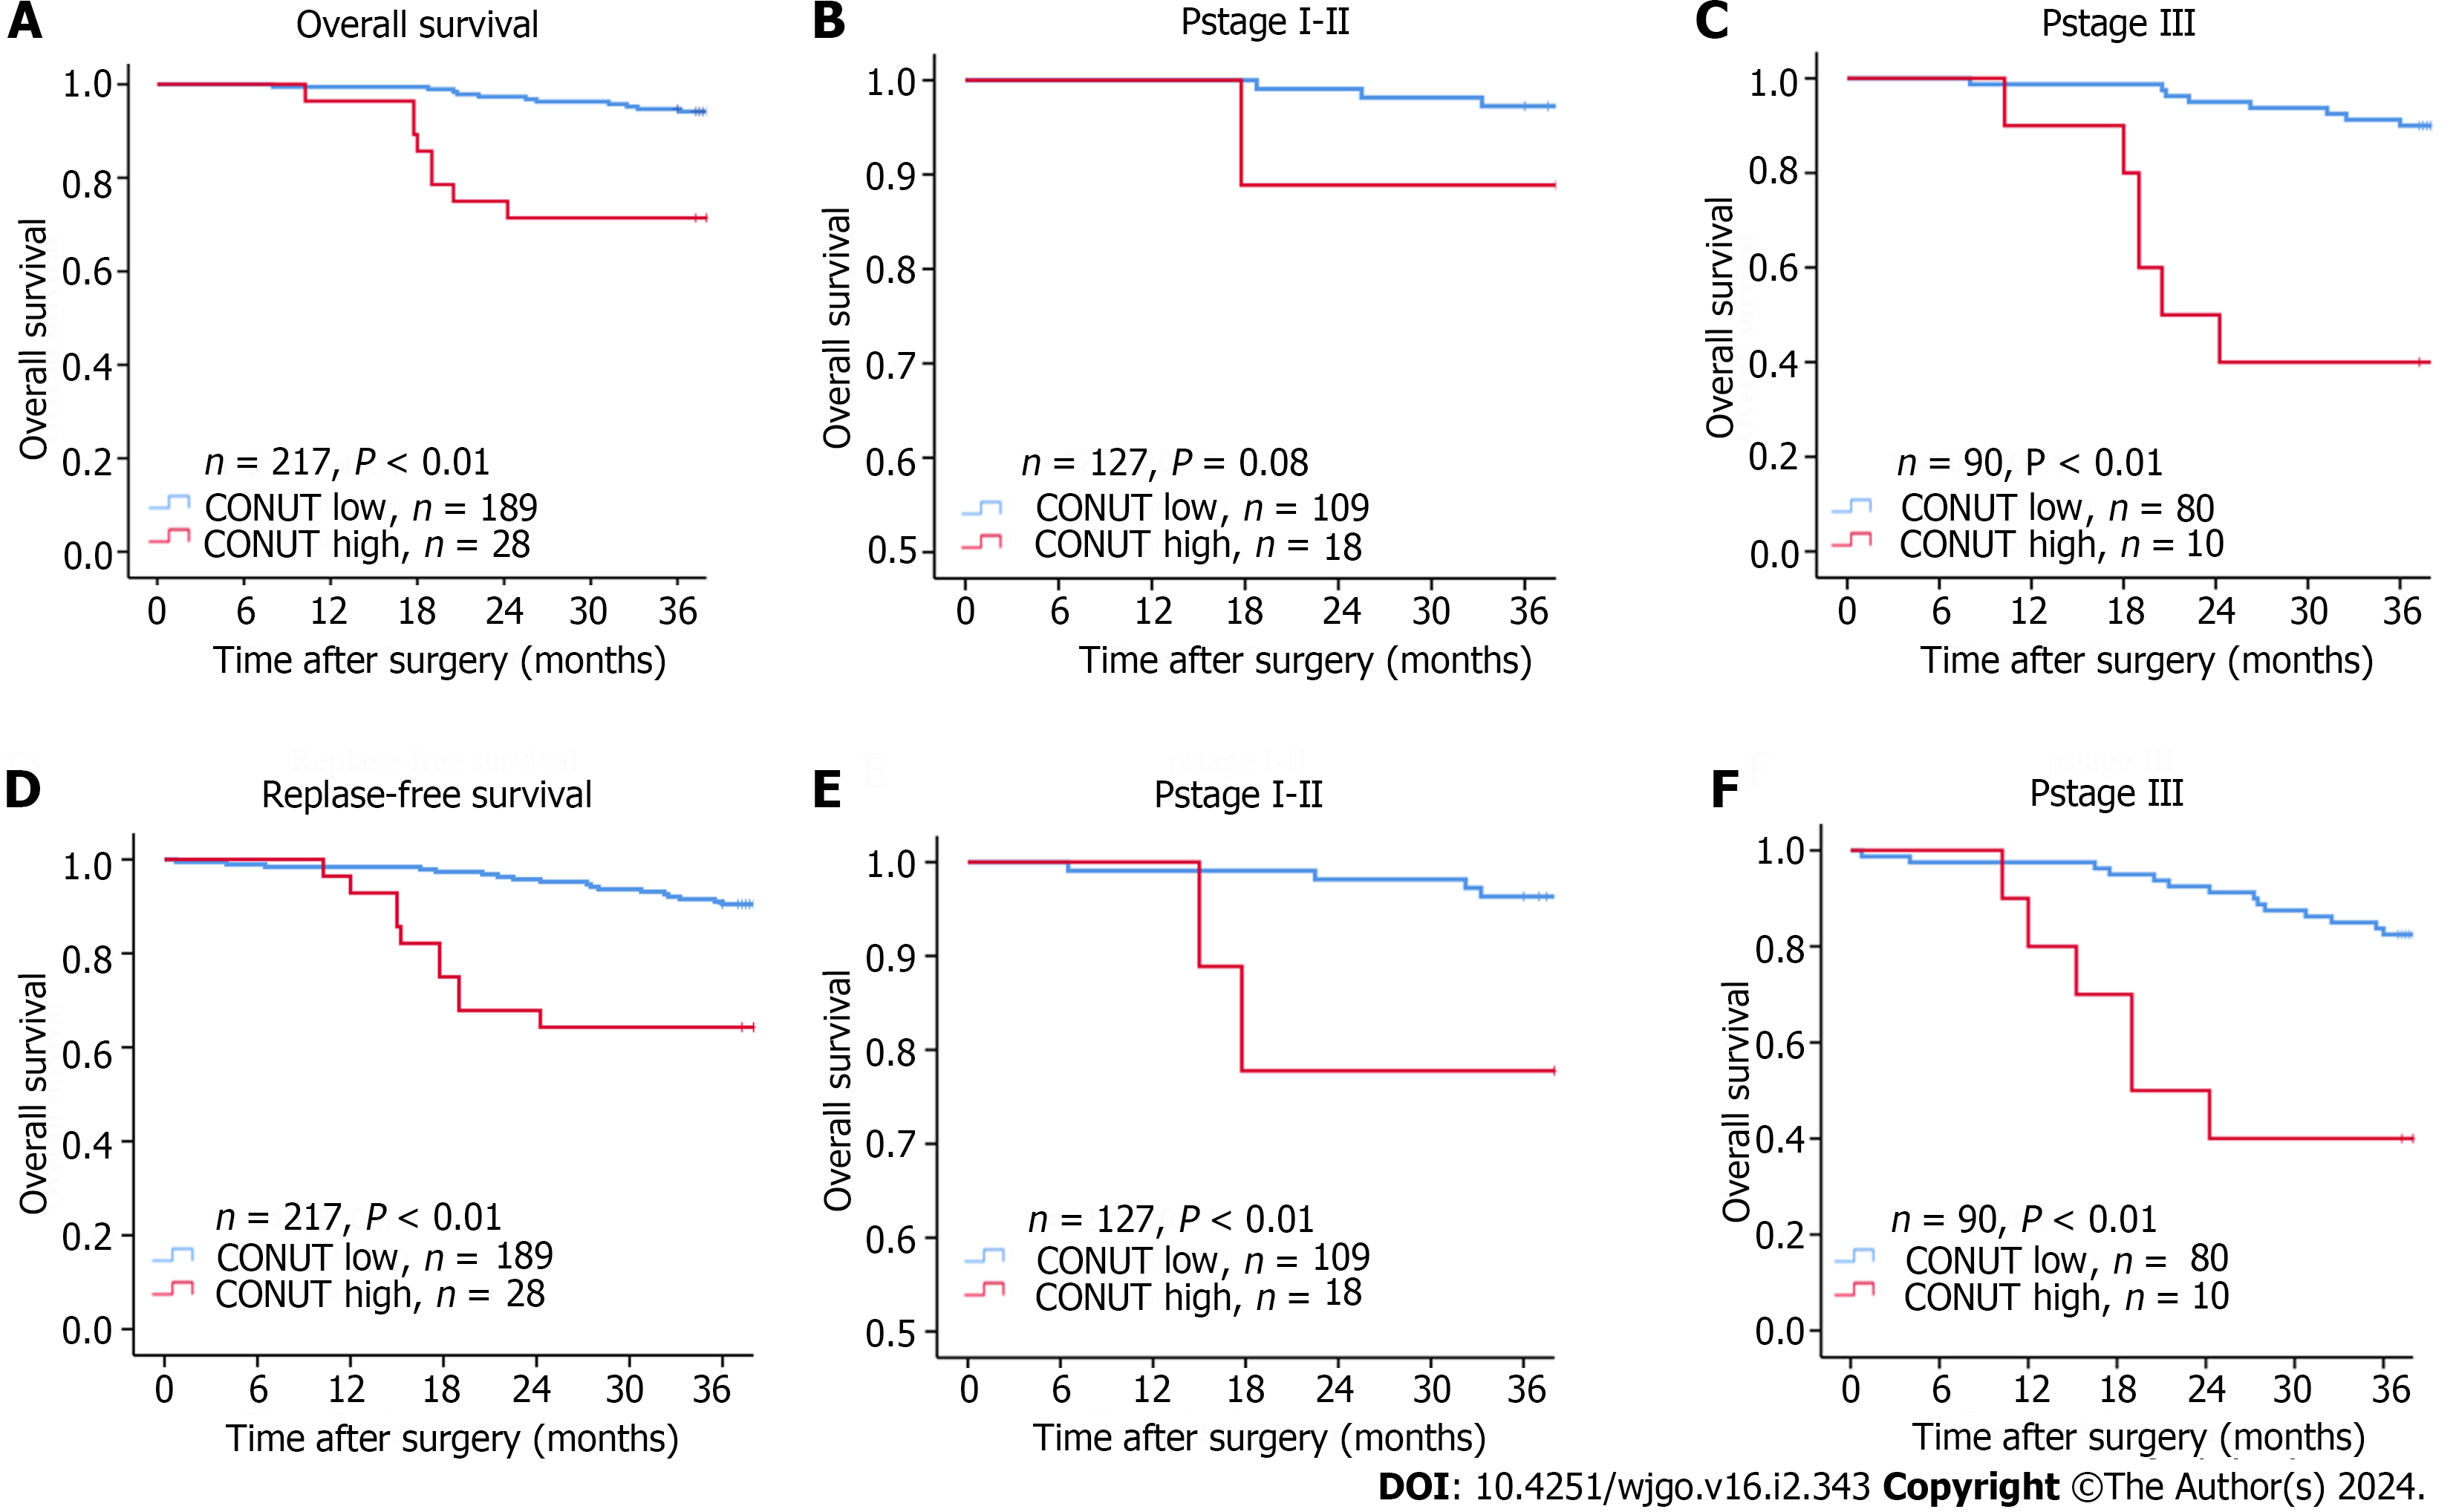
Figure 2 Kaplan-Meier curves for overall survival and replase-free survival.
A and D: Controlling nutritional status high or low groups; B and E: pStageI-II patients; C and F: pStageⅢ patients. COUNT: Controlling nutritional status.
Figure 3 The time-dependent curves of controlling nutritional status, neutrophil-to-lymphocyte ratio, modified Glasgow prognostic score, and prognostic nutritional index.
A: Predicting 3-year overall survival; B: Predicting 3-year replase-free survival. 95%CI: 95% confidence interval; AUC: Area under the receiver operating characteristics curve; COUNT: Controlling nutritional status; NLR: Neutrophil-to-lymphocyte ratio; mGPS: Modified Glasgow prognostic score; PNI: Prognostic nutritional index.
Figure 4 The time-dependent curves of controlling nutritional status + TNM stage and skeletal muscle mass index + TNM stage.
A: Predicting 3-year overall survival; B: Predicting 3-year replase-free survival; C: The correlation between skeletal muscle mass index and controlling nutritional status. 95%CI: 95% confidence interval; AUC: Area under the receiver operating characteristics curve; COUNT: Controlling nutritional status; SMI: Skeletal muscle mass index.
- Citation: Liu LX, Wang H, Gao B, Xu TT, Yuan QG, Zhou SZ, Ding C, Miao J, Guan WX. Preoperative controlling nutritional status as an optimal prognostic nutritional index to predict the outcome for colorectal cancer. World J Gastrointest Oncol 2024; 16(2): 343-353
- URL: https://www.wjgnet.com/1948-5204/full/v16/i2/343.htm
- DOI: https://dx.doi.org/10.4251/wjgo.v16.i2.343


