Copyright
©The Author(s) 2024.
World J Gastrointest Oncol. Dec 15, 2024; 16(12): 4650-4662
Published online Dec 15, 2024. doi: 10.4251/wjgo.v16.i12.4650
Published online Dec 15, 2024. doi: 10.4251/wjgo.v16.i12.4650
Figure 1 Kaplan-Meier survival curves stratified by γ-glutamyl transferase to albumin ratio.
A: Overall survival of the transarterial chemoembolization alone cohort; B: The cohort after propensity score matching; C: Training set; D: Validation set; E: Dual therapy cohort; F: Triple therapy cohort. GAR: γ-glutamyl transferase to albumin ratio.
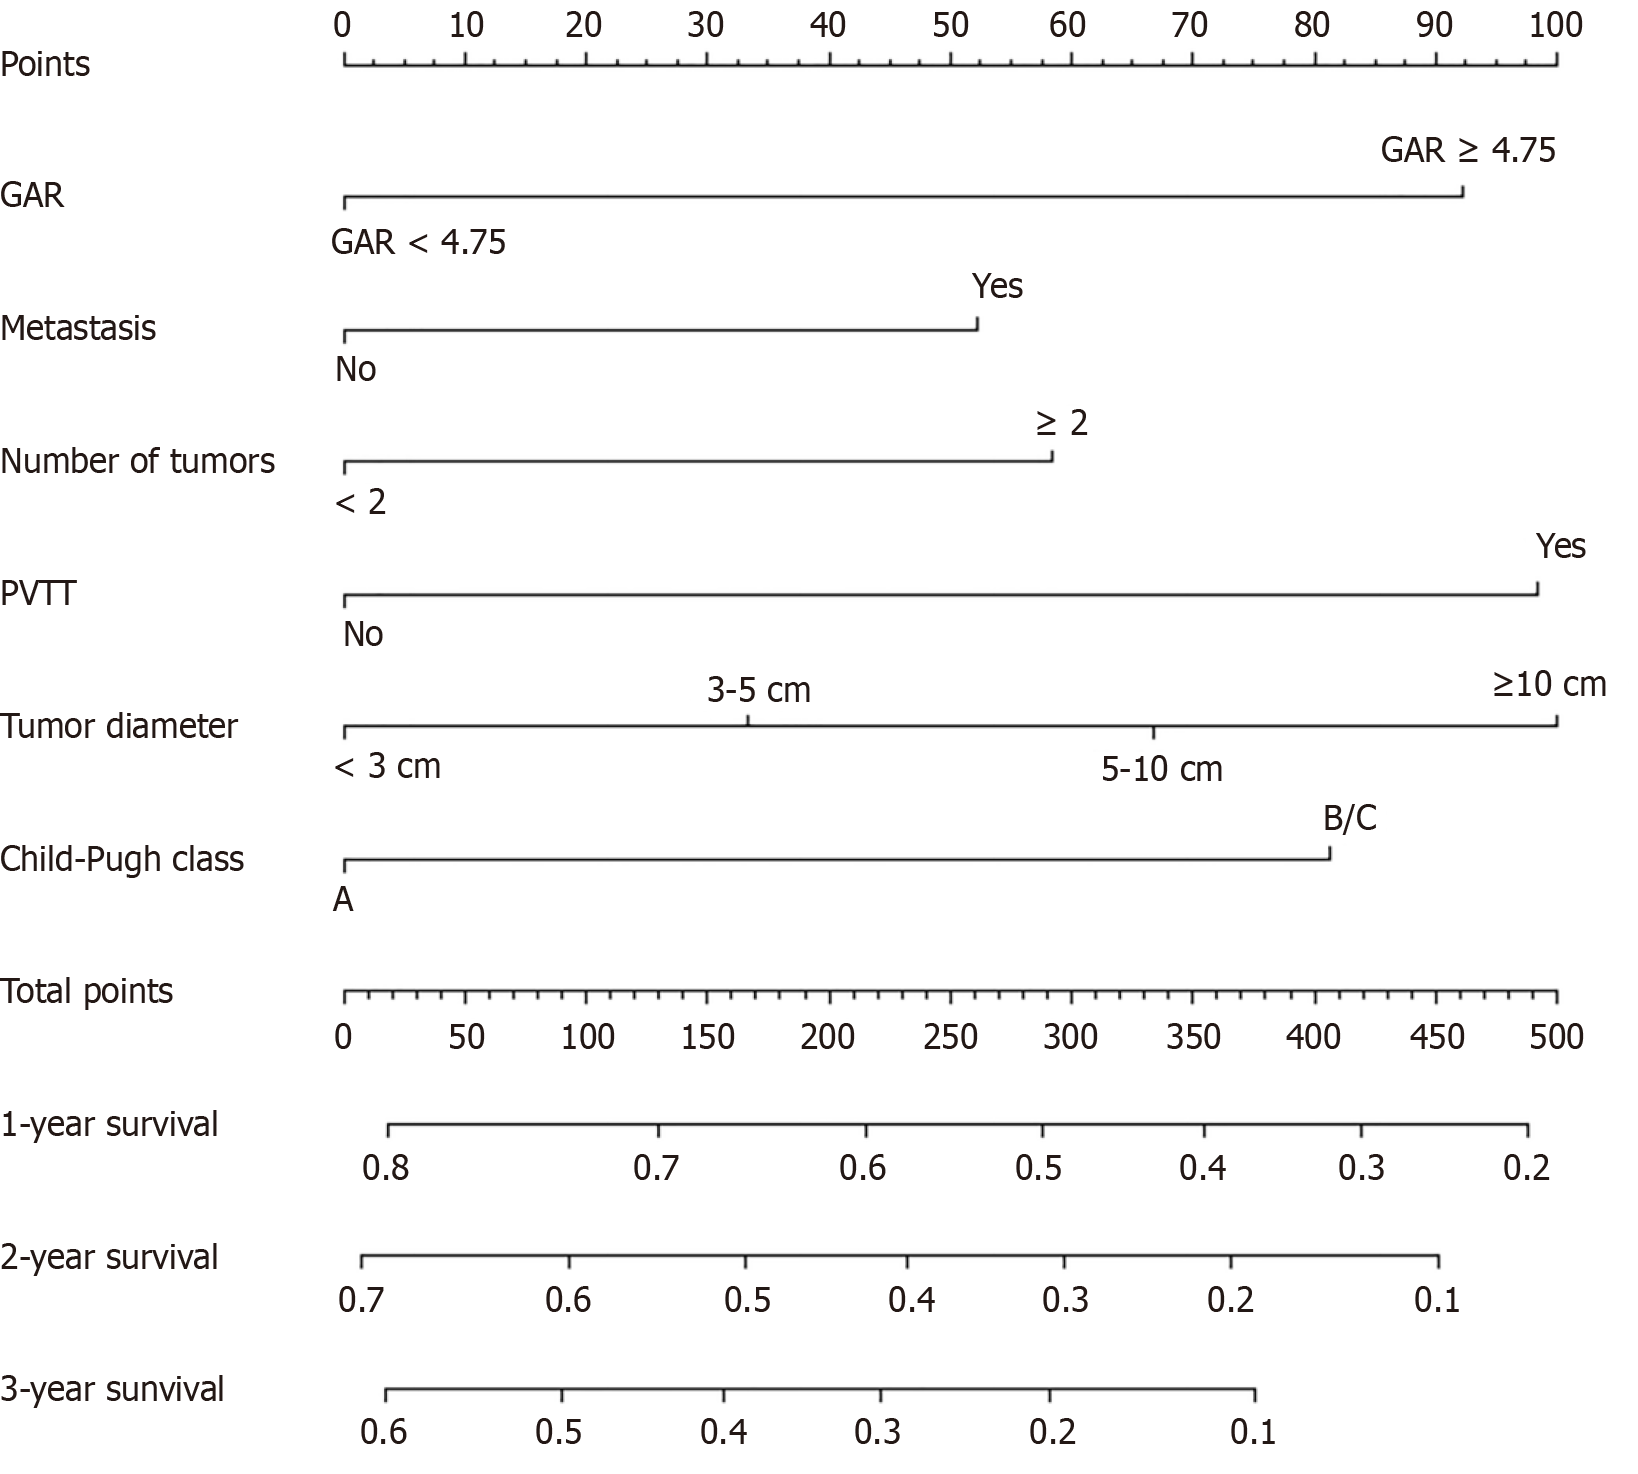
Figure 2 Nomogram constructed based on independent risk factors for predicting 1-, 2-, and 3-year overall survival in patients with hepatocellular carcinoma.
GAR: γ-glutamyl transferase to albumin ratio; PVTT: Portal vein tumor thrombus.
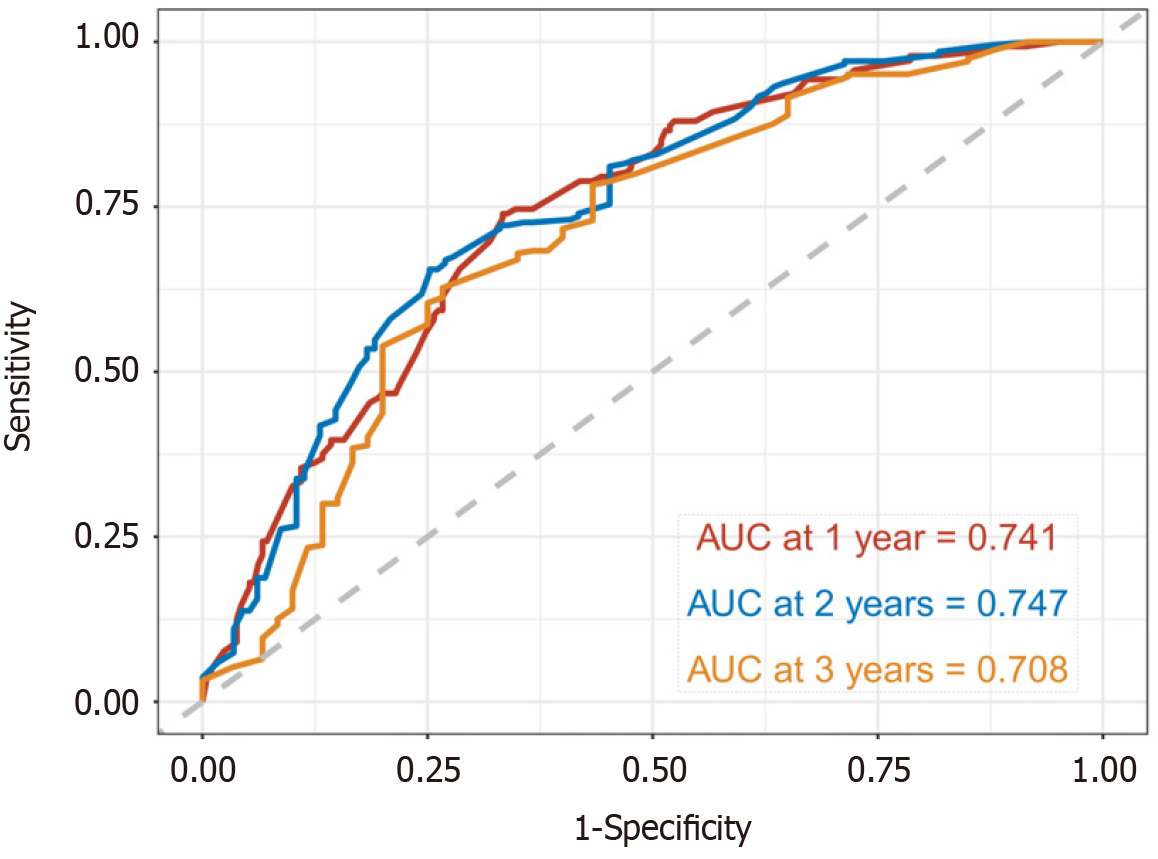
Figure 3 Time-dependent receiver operating characteristic curves of this predictive model.
AUC: Area under receiver operating characteristic curve.
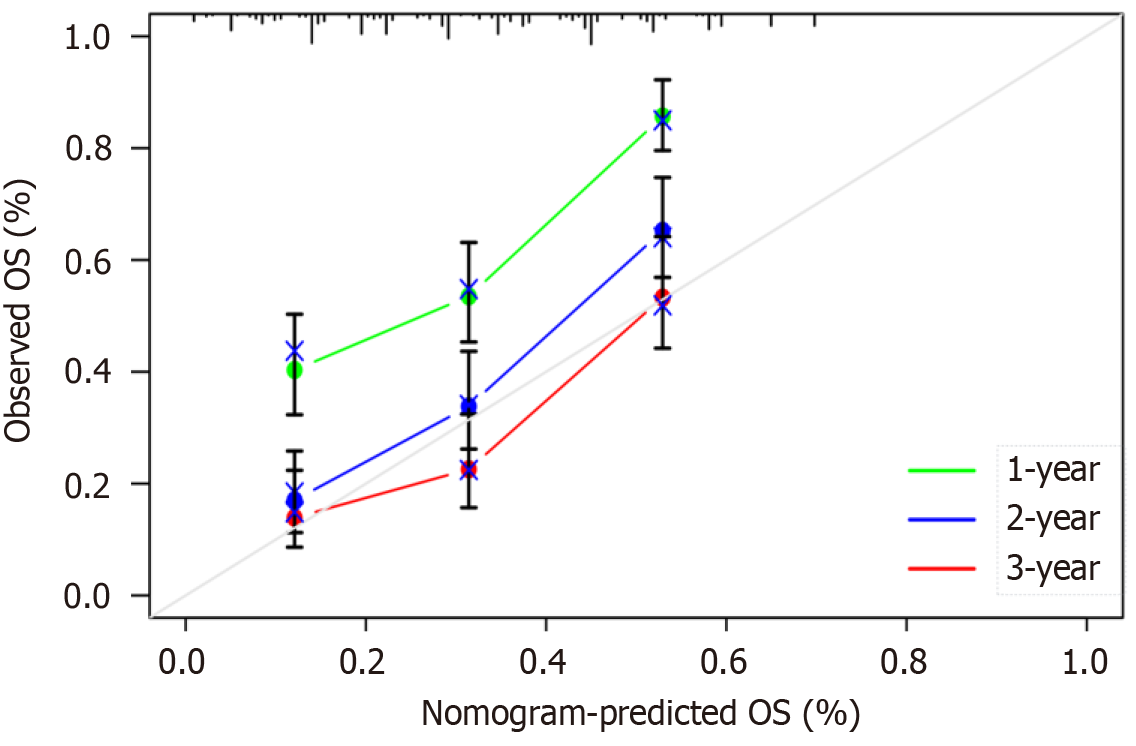
Figure 4 Calibration curve of validation cohort.
OS: Overall survival.
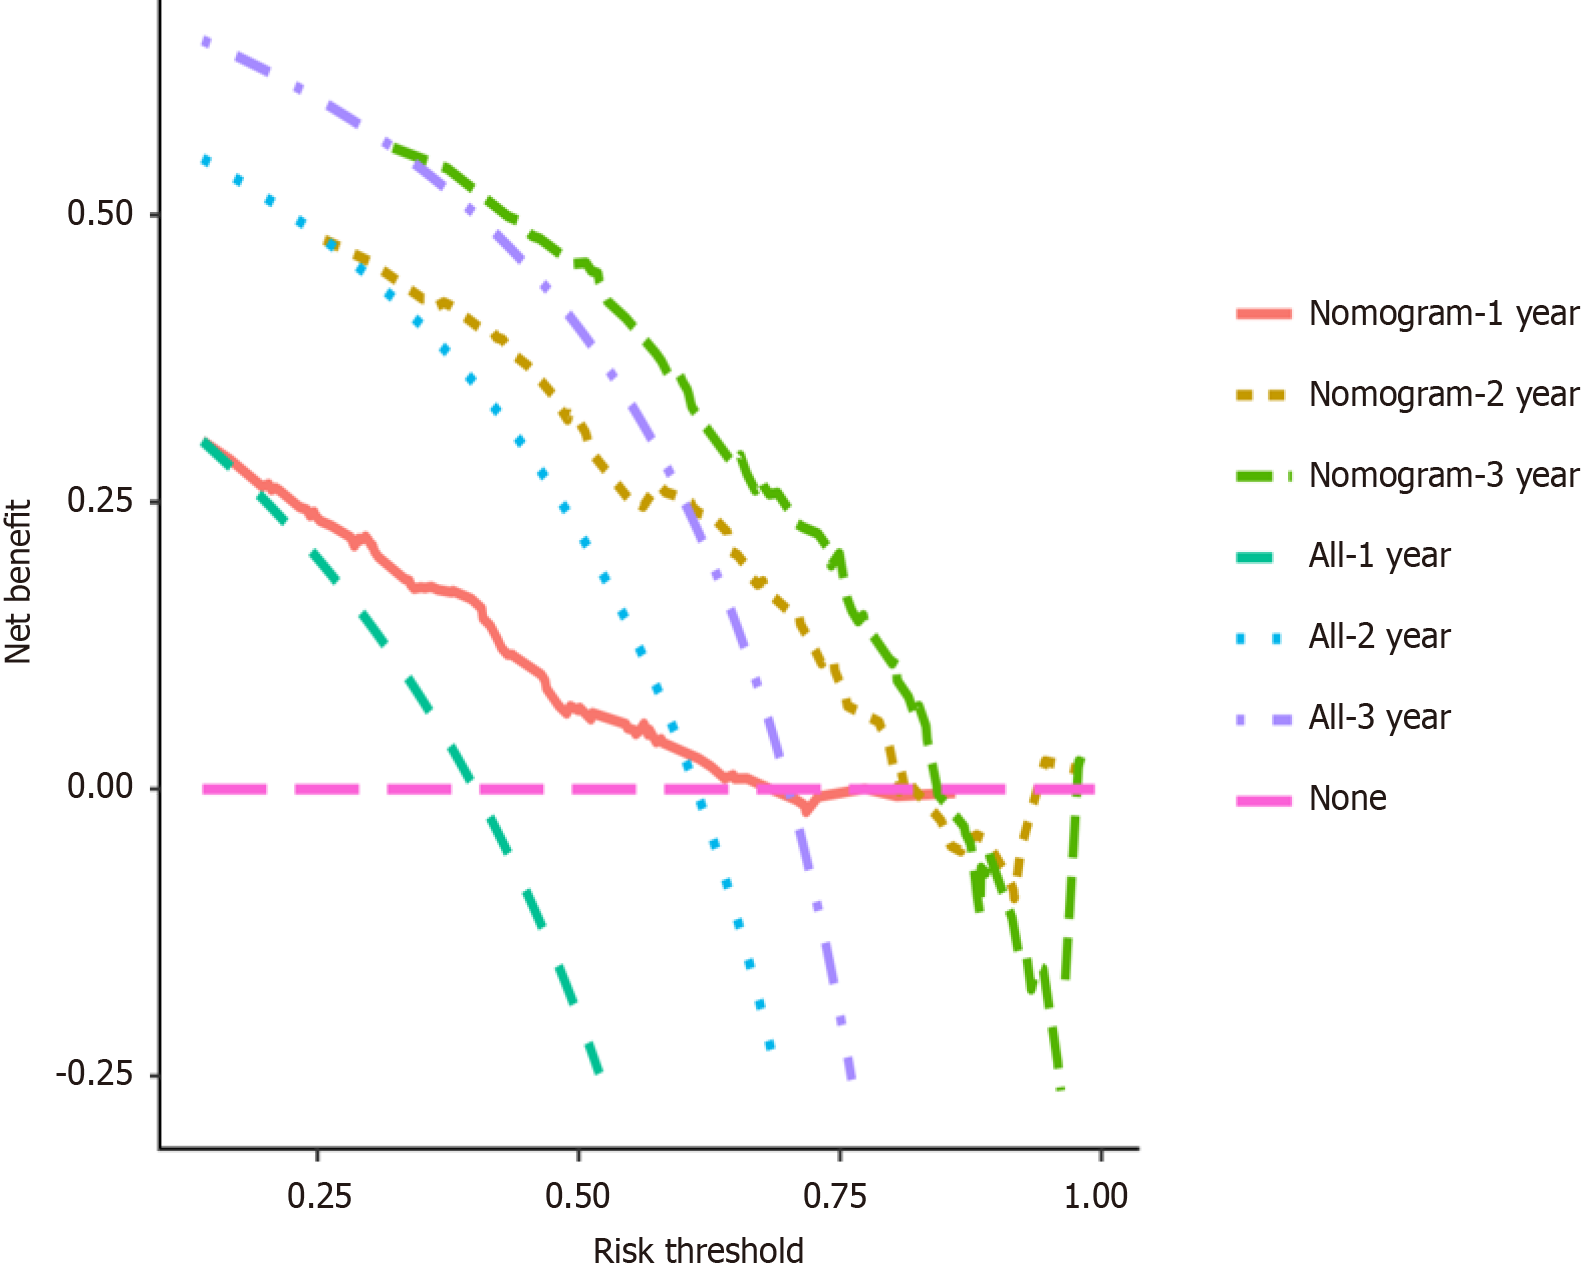
Figure 5
Decision curve analyses curve of validation cohort.
- Citation: Wu ZY, Li H, Chen JL, Su K, Weng ML, Han YW. Nomogram model based on γ-glutamyl transferase to albumin ratio predicts survival in hepatocellular carcinoma patients with transarterial chemoembolization treatment. World J Gastrointest Oncol 2024; 16(12): 4650-4662
- URL: https://www.wjgnet.com/1948-5204/full/v16/i12/4650.htm
- DOI: https://dx.doi.org/10.4251/wjgo.v16.i12.4650


