Copyright
©The Author(s) 2024.
World J Gastrointest Oncol. Dec 15, 2024; 16(12): 4597-4613
Published online Dec 15, 2024. doi: 10.4251/wjgo.v16.i12.4597
Published online Dec 15, 2024. doi: 10.4251/wjgo.v16.i12.4597
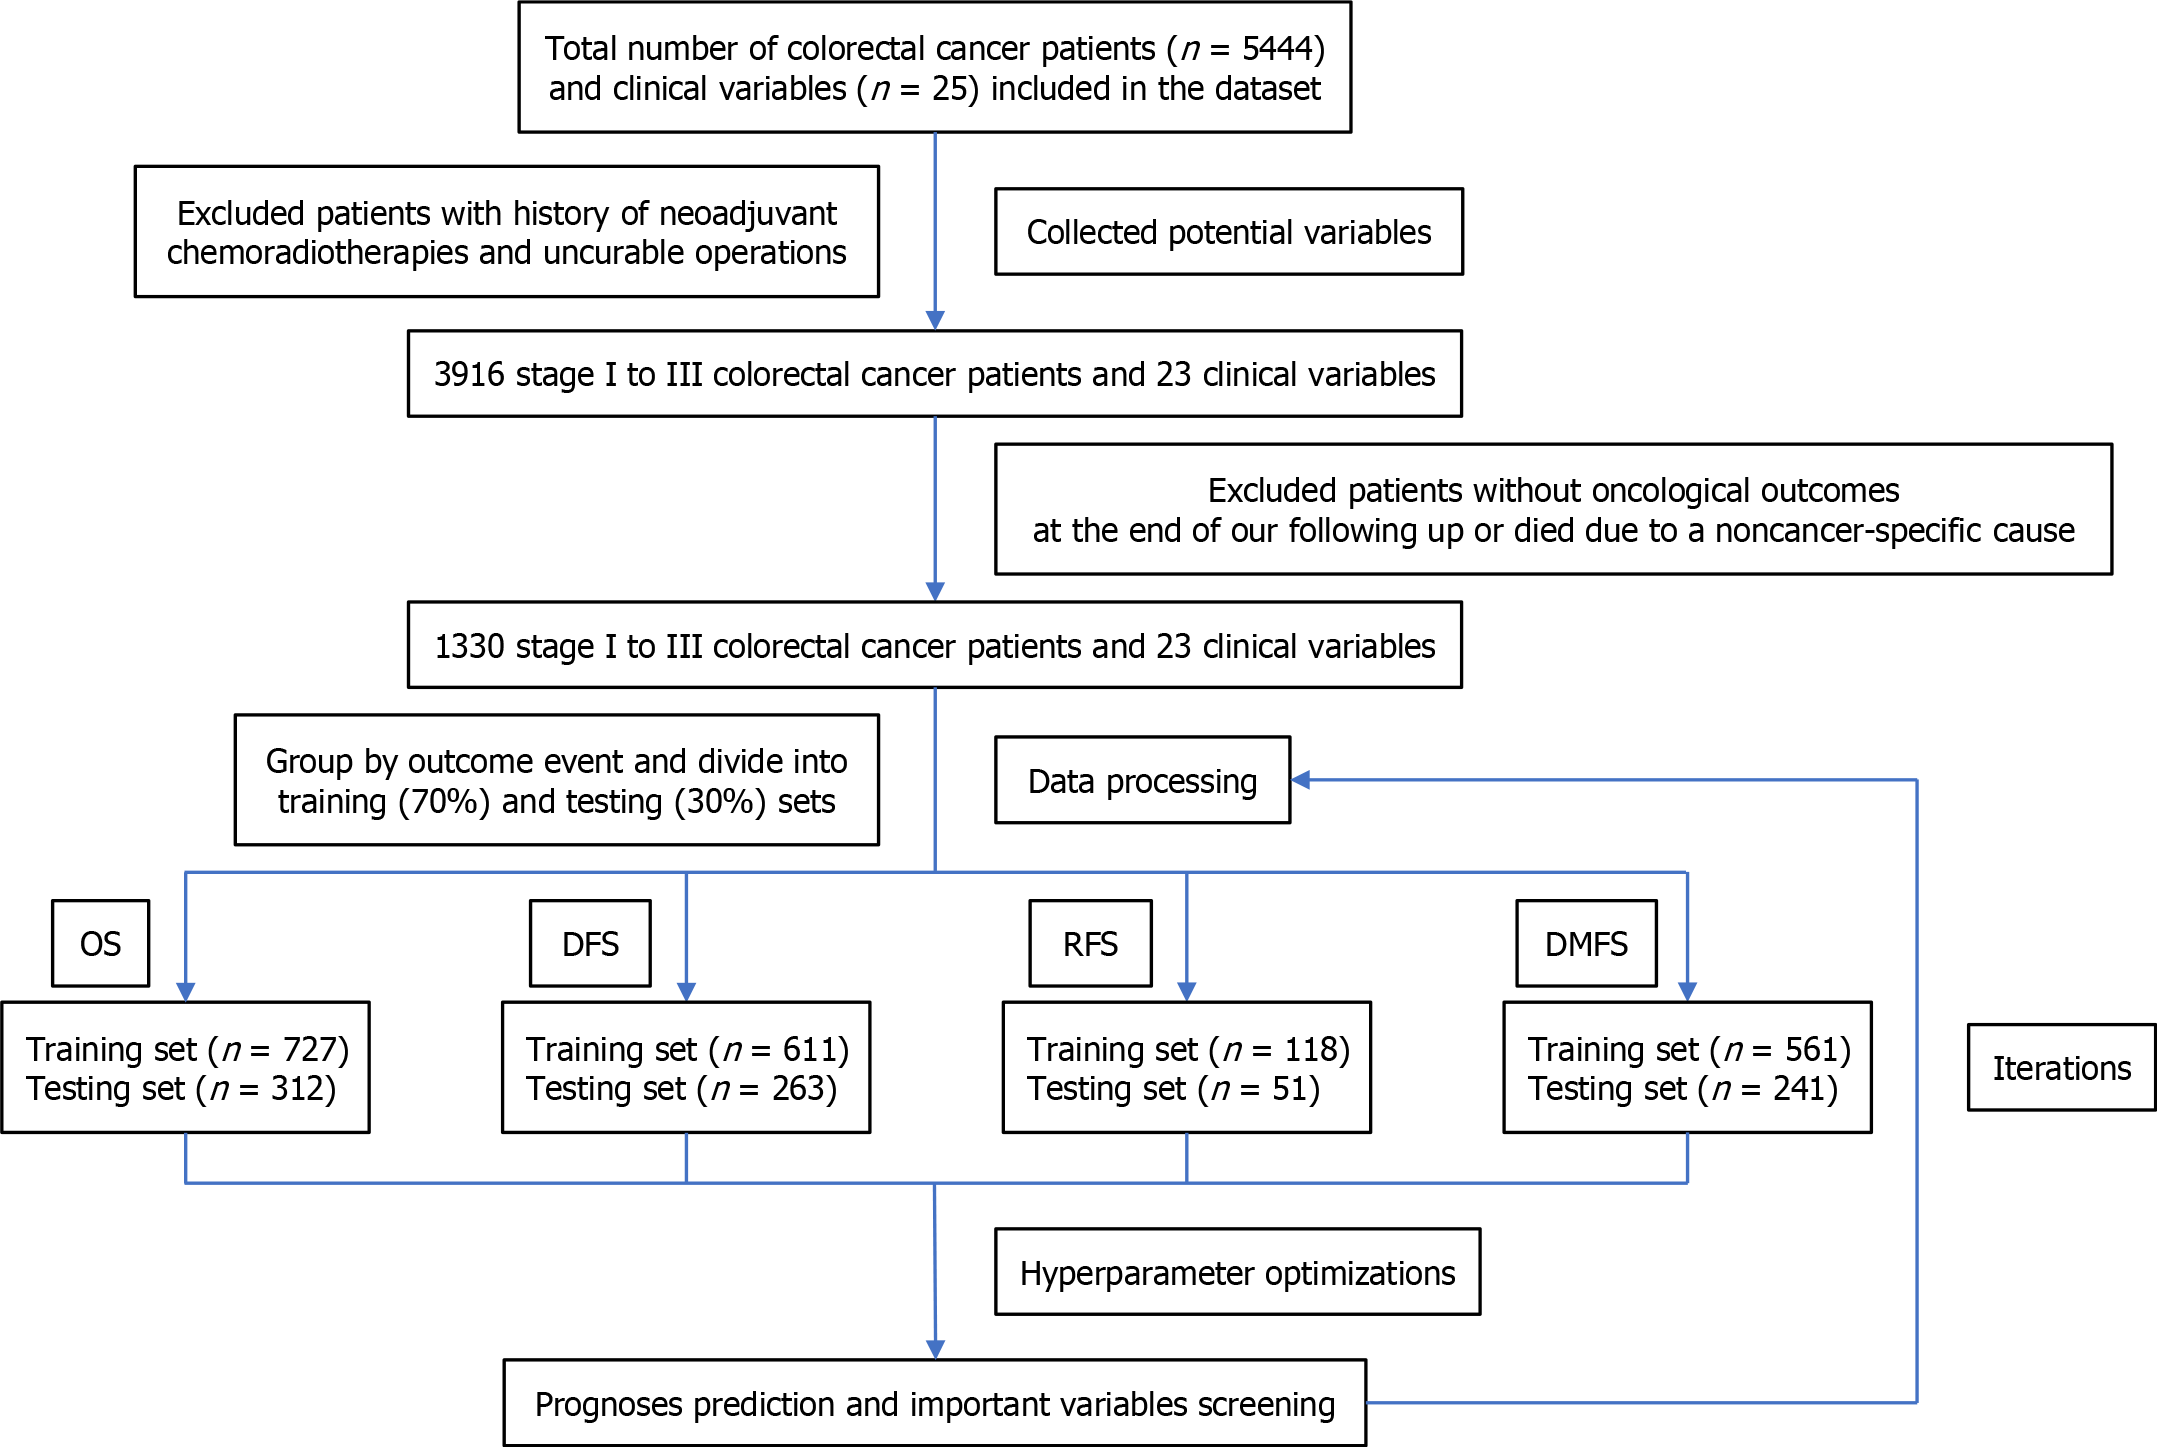
Figure 1 Flowchart showing colorectal cancer patient cohort selection and model training and performance evaluation.
A total of 1330 patients were recruited for model development and were grouped by oncological outcomes; then, the data were randomly divided at a 7:3 ratio into a training set and a testing set. The hyperparameters were determined for both the training set and testing set, and model performance was evaluated on the basis of the area under the receiver operating characteristic curve. Finally, we predicted patient outcomes, screened important variables, and processed the bootstrap iterations. DFS: Disease-free survival; DMFS: Distant metastasis-free survival; OS: Overall survival; RFS: Recurrence-free survival.
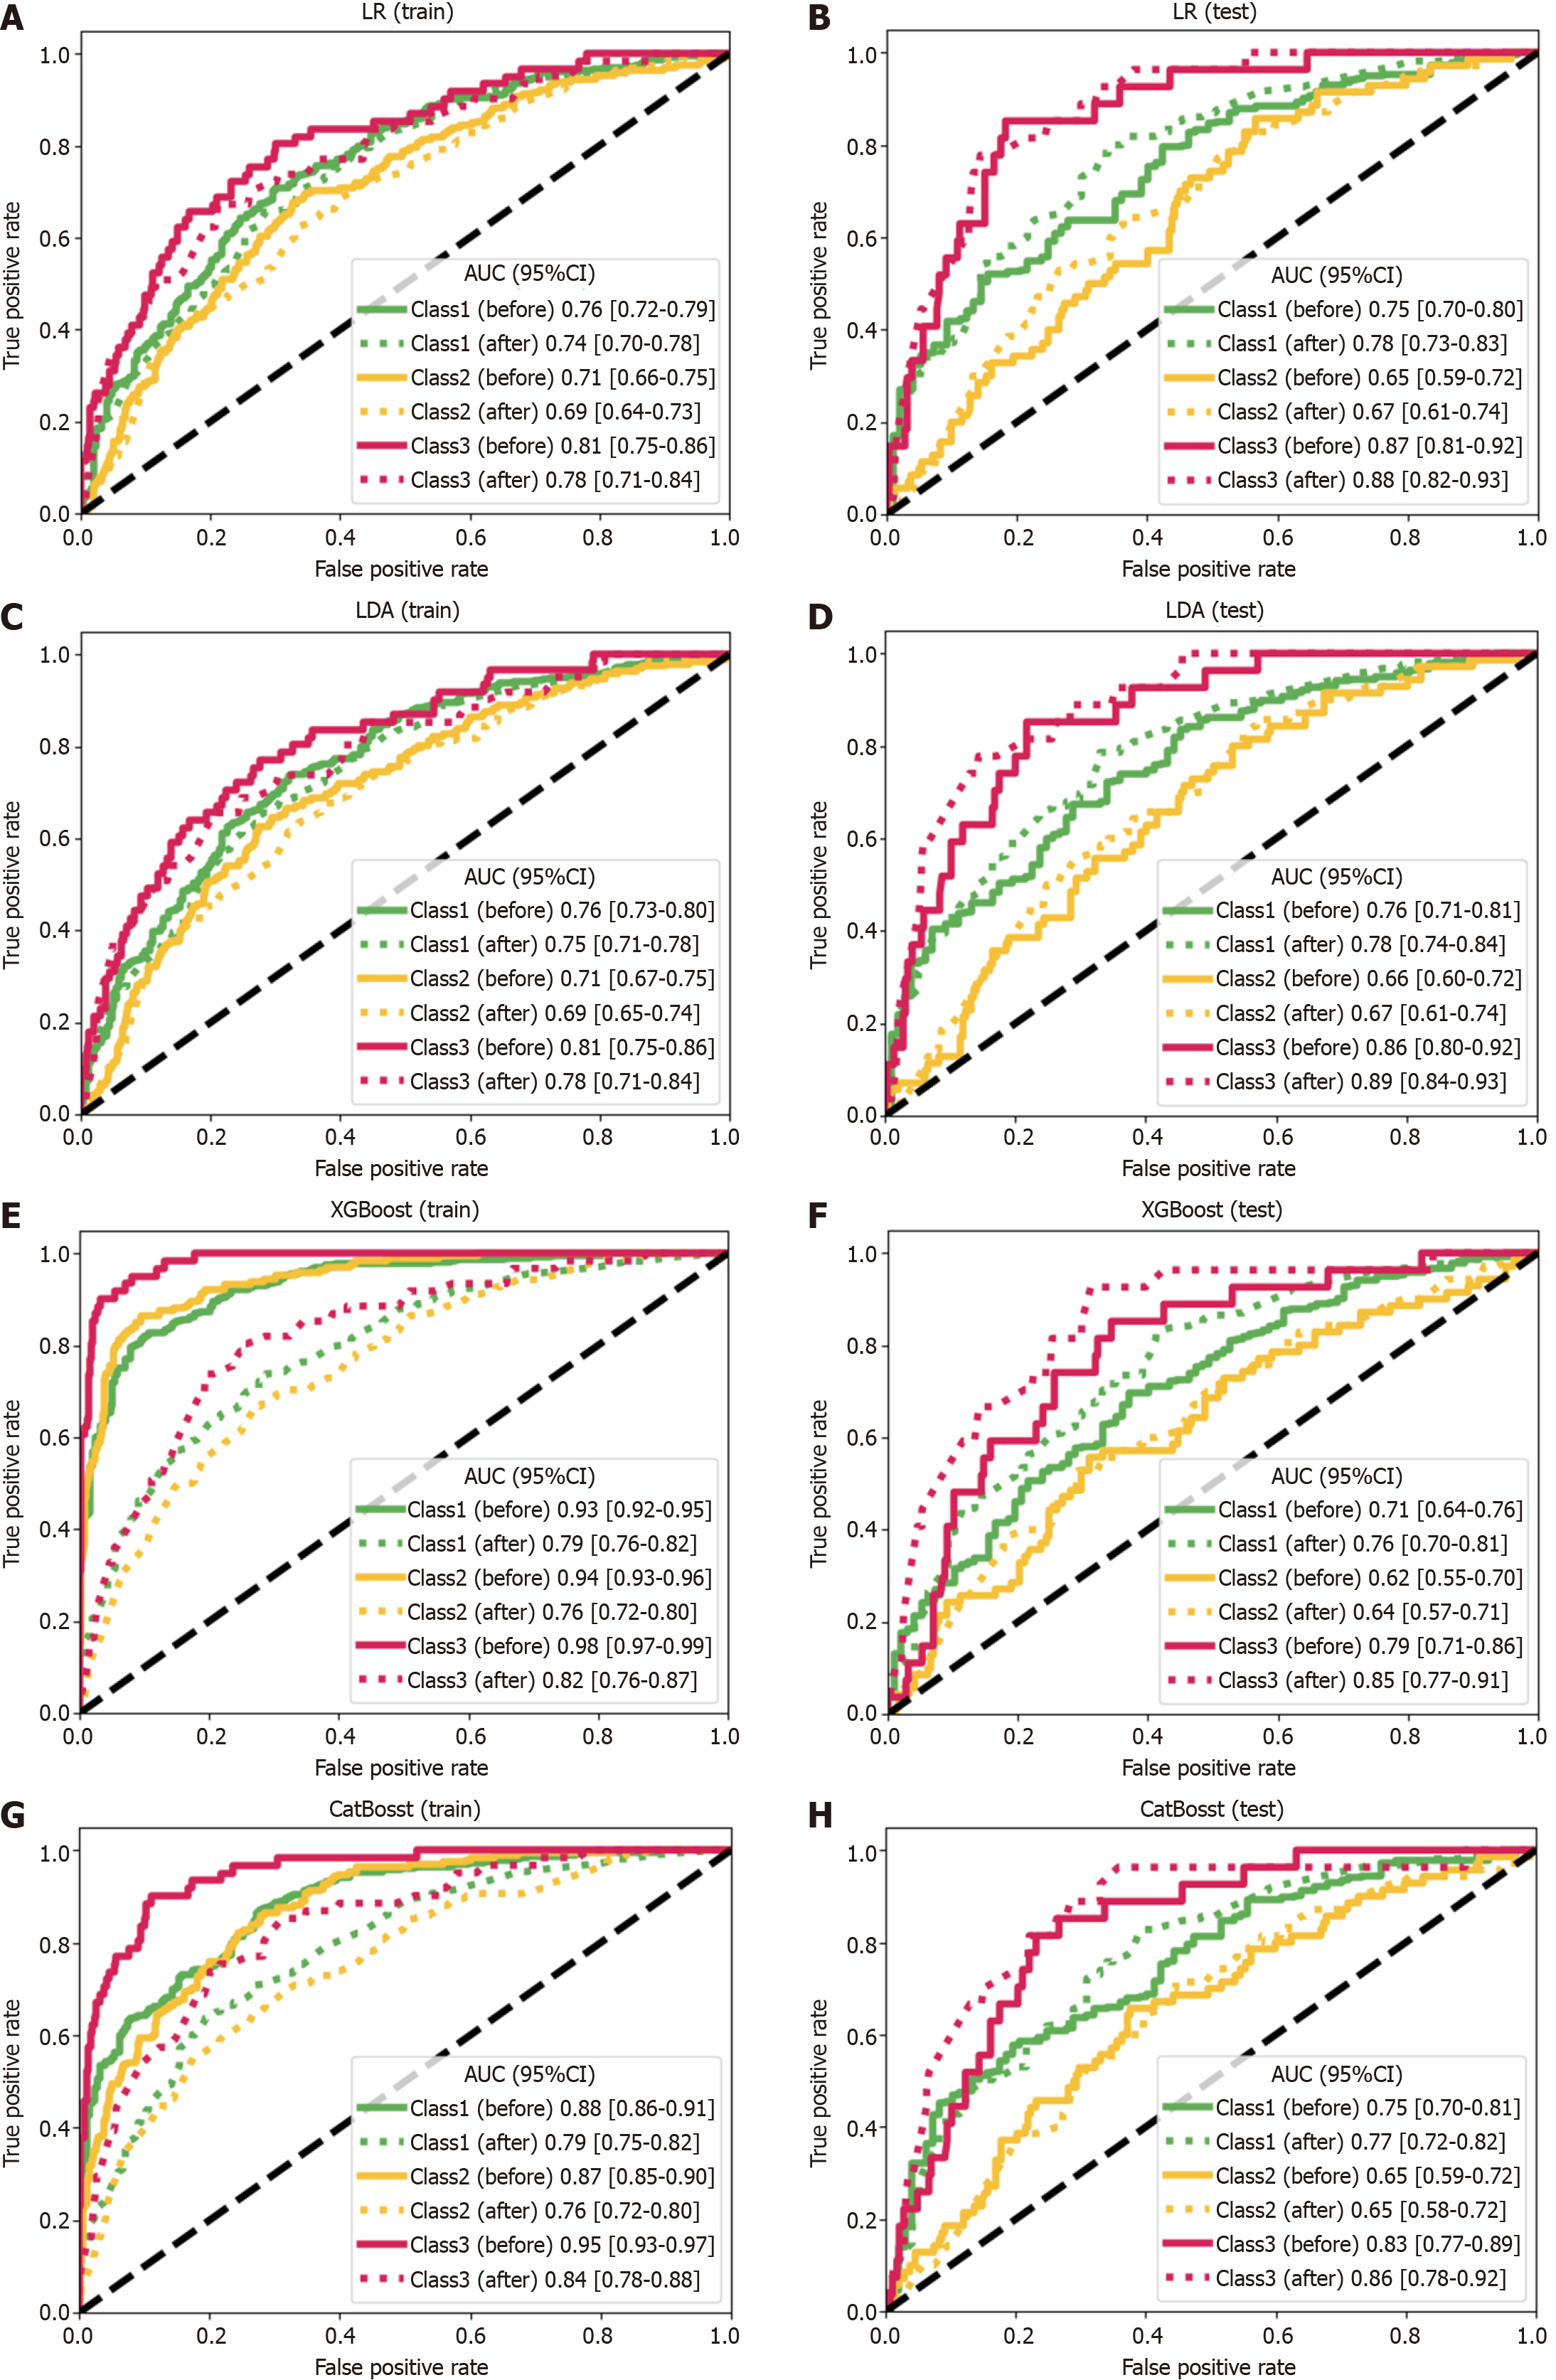
Figure 2 Prediction of overall survival by machine learning models.
The plots show the areas under the curve (AUCs) and their 95% confidence interval (CI). A: The linear regression (LR) in the training set [class 1 (cl 1): Before: 0.76 (0.72-0.79), after: 0.74 (0.70-0.78); class 2 (cl 2): Before: 0.71 (0.66-0.75), after: 0.69 (0.64-0.73); class 3 (cl 3): Before: 0.81 (0.75-0.86), after: 0.78 (0.71-0.84)]; B: The LR model in the testing set [cl 1: Before: 0.75 (0.70-0.80), after: 0.78 (0.73-0.83); cl 2: Before: 0.65 (0.59-0.72), after: 0.67 (0.61-0.74); cl 3: Before: 0.87 (0.81-0.92), after: 0.88 (0.82-0.93)]; C: The linear discriminant analysis (LDA) model in the training set [cl 1: Before: 0.76 (0.73-0.80), after: 0.75 (0.71-0.78); cl 2: Before: 0.71 (0.67-0.75), after: 0.69 (0.65-0.74); cl 3: Before: 0.81 (0.75-0.86), after: 0.78 (0.71-0.84)]; D: The LDA model in the testing set [cl 1: Before: 0.76 (0.71-0.81), after: 0.78 (0.74-0.84); cl 2: Before: 0.66 (0.60-0.72), after: 0.67 (0.61-0.74); cl 3: Before: 0.86 (0.80-0.92), after: 0.89 (0.84-0.93)]; E: The eXtreme gradient boosting (XGBoost) model in the training set [cl 1: Before: 0.93 (0.92-0.95), after: 0.79 (0.76-0.82); cl 2: Before: 0.94 (0.93-0.96), after: 0.76 (0.72-0.80); cl 3: Before: 0.98 (0.97-0.99), after: 0.82 (0.76-0.87)]; F: The XGBoost model in the testing set [cl 1: Before: 0.71 (0.64-0.76), after: 0.76 (0.70-0.81); cl 2: Before: 0.62 (0.55-0.70), after: 0.64 (0.57-0.71); cl 3: Before: 0.79 (0.71-0.86), after: 0.85 (0.77-0.91)]; G: The categorical features and gradient boosting (CatBoost) model in the training set [cl 1: Before: 0.88 (0.86-0.91), after: 0.79 (0.75-0.82); cl 2: Before: 0.87 (0.85-0.90), after: 0.76 (0.72-0.80); cl 3: Before: 0.95 (0.93-0.97), after: 0.84 (0.78-0.88)]; H: The CatBoost model in the testing set [cl 1: Before: 0.75 (0.70-0.81), after: 0.77 (0.72-0.82); cl 2: Before: 0.65 (0.59-0.72), after: 0.65 (0.58-0.72); cl 3: Before: 0.83 (0.77-0.89), after: 0.86 (0.78-0.92)]. The curves of the models constructed with the full-variable datasets and the datasets containing only important variables are depicted with solid lines and dashed lines, respectively (abbreviated as “before” and “after” in this annotation).
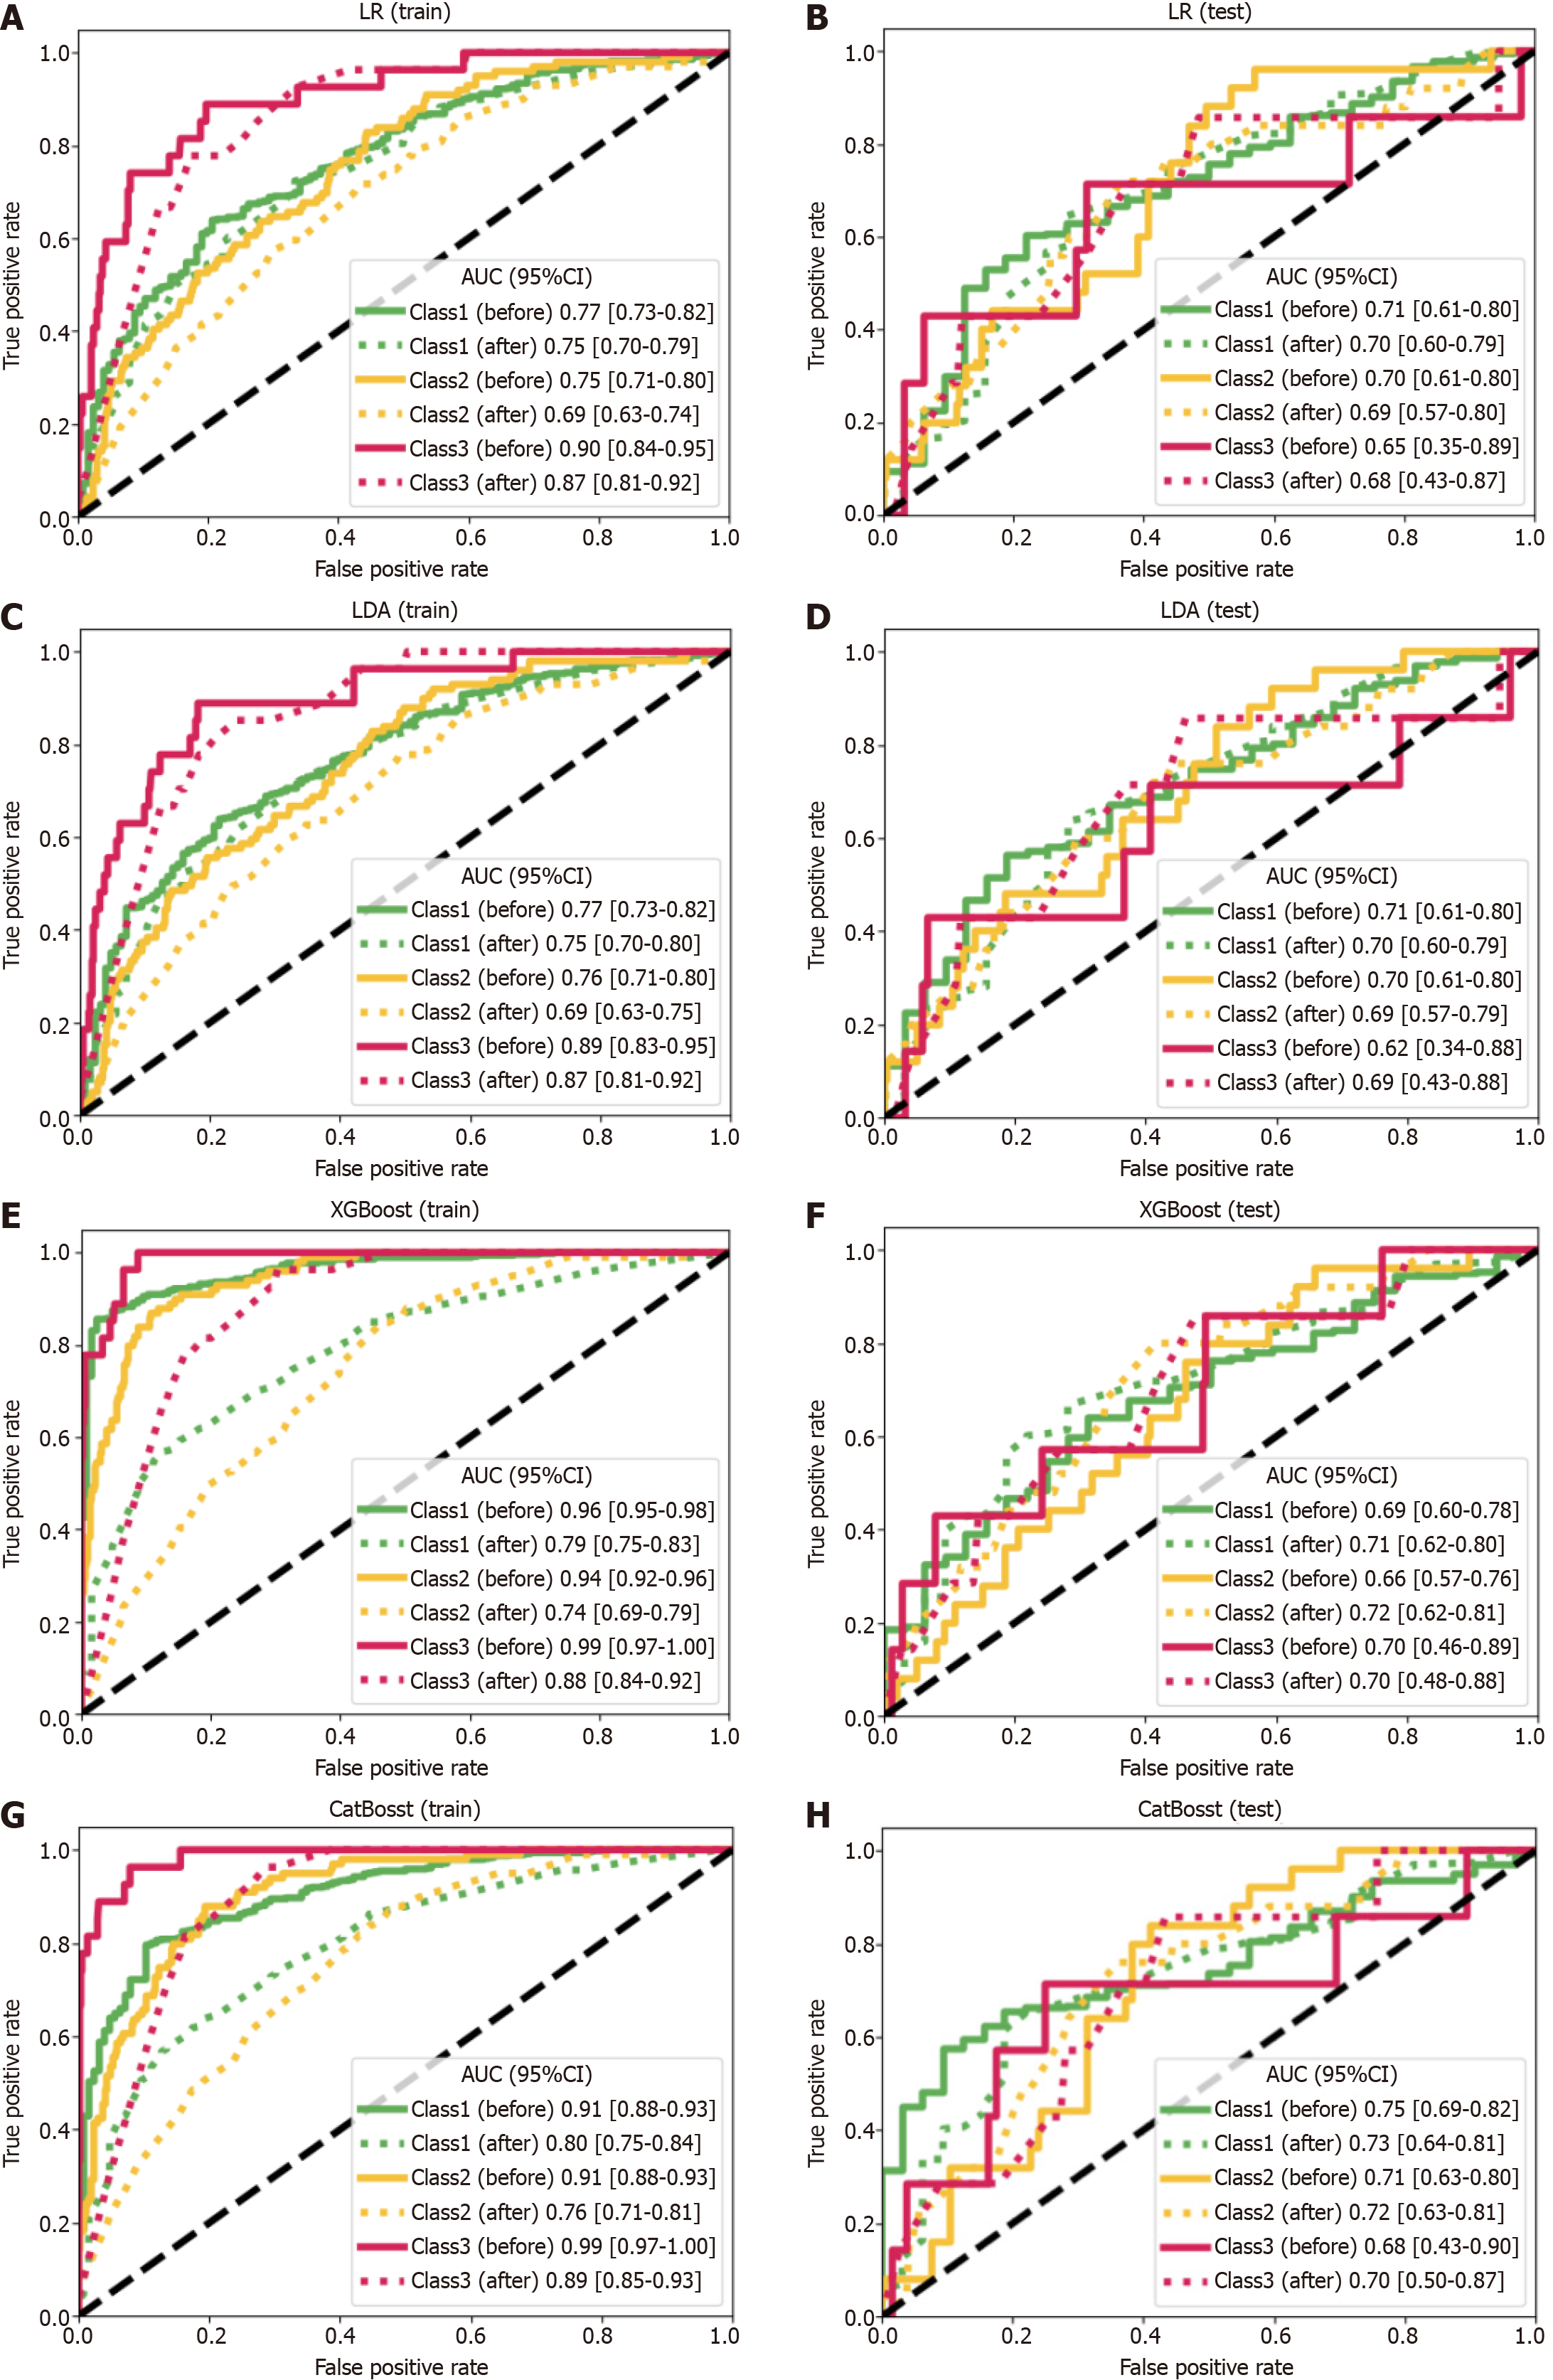
Figure 3 Prediction of disease-free survival by machine learning models.
The plots show the areas under the curve (AUCs) and their 95%CI. A: The linear regression (LR) model in the training set [class 1 (cl 1): Before: 0.77 [0.73-0.82), after: 0.75 (0.70-0.79); class 2 (cl 2): Before: 0.75 (0.71-0.80), after: 0.69 (0.63-0.74); class 3 (cl 3): Before: 0.90 (0.84-0.95), after: 0.87 (0.81-0.92)]; B: The LR model in the testing set [cl 1: Before: 0.71 (0.61-0.80), after: 0.70 (0.60-0.79); cl 2: Before: 0.70 (0.61-0.80), after: 0.69 (0.57-0.80); cl 3: Before: 0.65 (0.35-0.89), after: 0.68 (0.43-0.87)]; C: The linear discriminant analysis (LDA) model in the training set [cl 1: Before: 0.77 (0.73-0.82), after: 0.75 (0.70-0.80); cl 2: Before: 0.76 (0.71-0.80), after: 0.69 (0.63-0.75); cl 3: Before: 0.89 (0.83-0.95), after: 0.87 (0.81-0.92)]; D: The LDA model in the testing set [cl 1: Before: 0.71 (0.61-0.80), after: 0.70 (0.60-0.79); cl 2: Before: 0.70 (0.61-0.80), after: 0.69 (0.57-0.79); cl 3: Before: 0.62 (0.34-0.88), after: 0.69 (0.43-0.88)]; E: The eXtreme gradient boosting (XGBoost) model in the training set [cl 1: Before: 0.96 (0.95-0.98), after: 0.79 (0.75-0.83); cl 2: Before: 0.94 (0.92-0.96), after: 0.74 (0.69-0.79); cl 3: Before: 0.99 (0.97-1.00), after: 0.88 (0.84-0.92)]; F: The XGBoost model in the testing set [cl 1: Before: 0.69 (0.60-0.78), after: 0.71 (0.62-0.80); cl 2: Before: 0.66 (0.57-0.76), after: 0.72 (0.62-0.81); cl 3: Before: 0.70 (0.46-0.89), after: 0.70 (0.48-0.88)]; G: The categorical features and gradient boosting (CatBoost) model in the training set [cl 1: Before: 0.91 (0.88-0.93), after: 0.80 (0.75-0.84); cl 2: Before: 0.91 (0.88-0.93), after: 0.76 (0.71-0.81); cl 3: Before: 0.99 (0.97-1.00), after: 0.89 (0.85-0.93)]; H: The CatBoost model in the testing set [cl 1: Before: 0.75 (0.69-0.82), after: 0.73 (0.64-0.81); cl 2: Before: 0.71 (0.63-0.80), after: 0.72 (0.63-0.81); cl 3: Before: 0.68 (0.43-0.90), after: 0.70 (0.50-0.87)]. The curves of the models constructed with the full-variable datasets and the datasets containing only important variables are depicted with solid lines and dashed lines, respectively (abbreviated as “before” and “after” in this annotation).
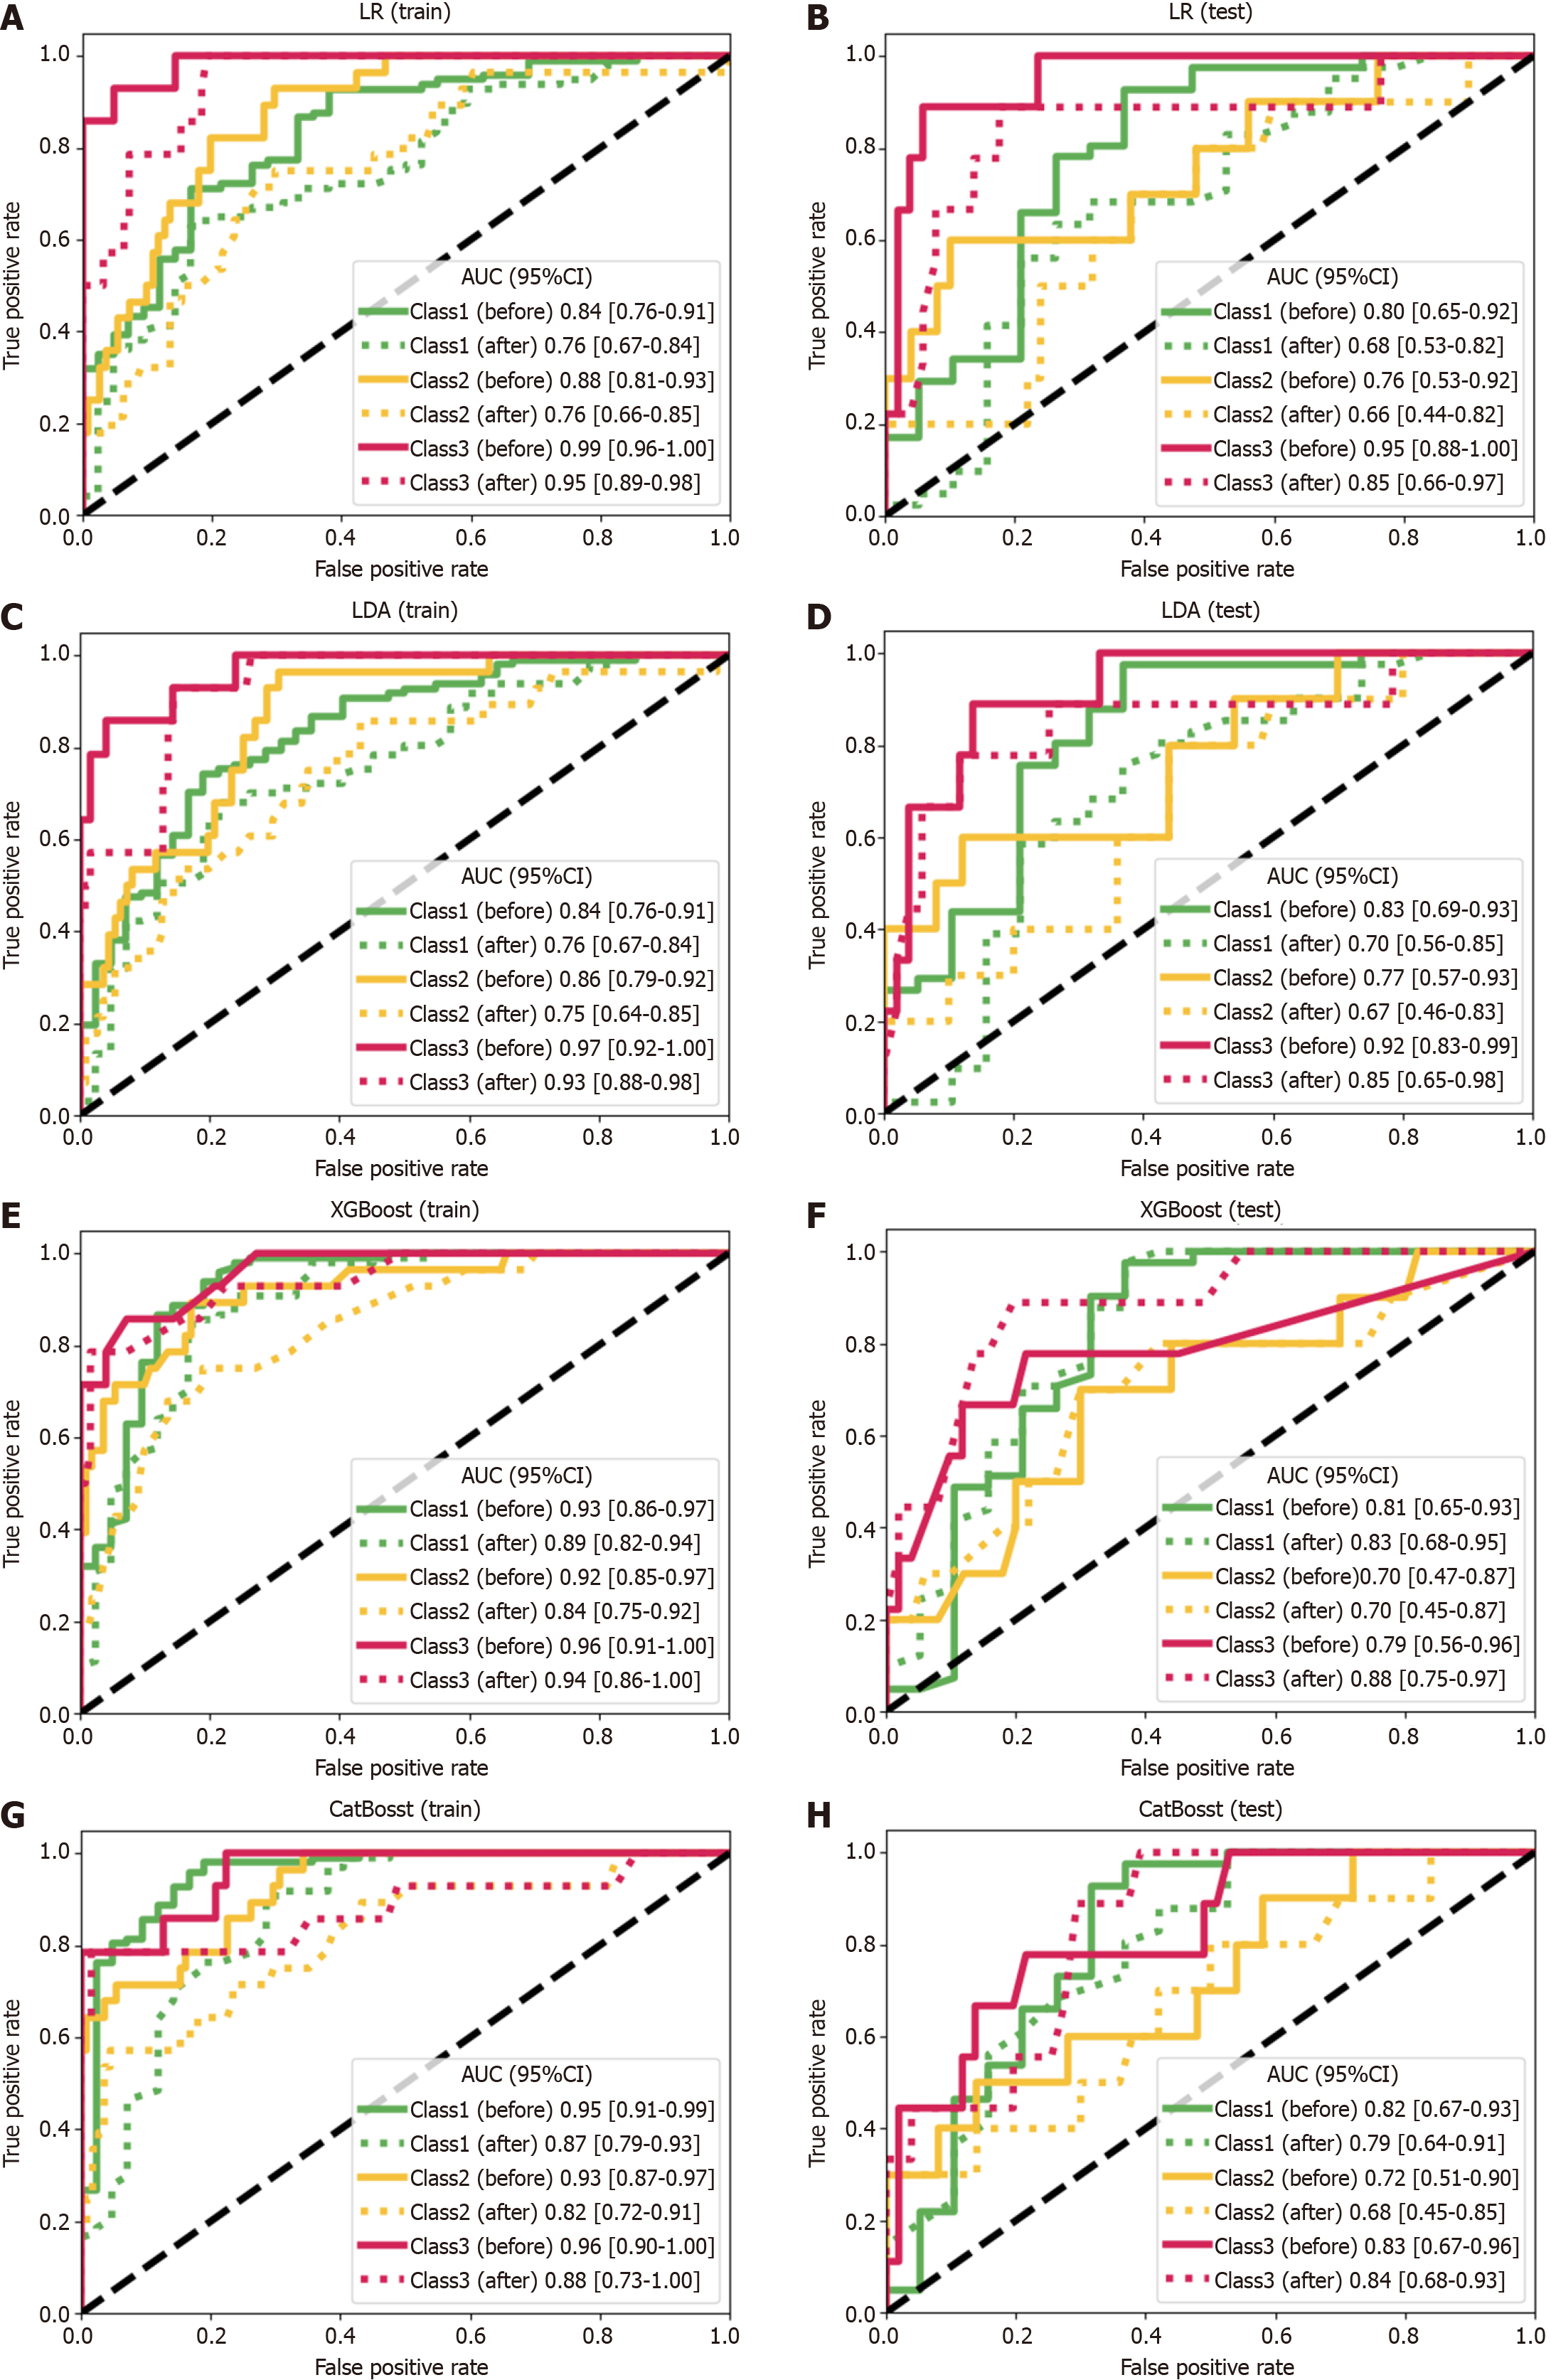
Figure 4 Prediction of recurrence-free survival by machine learning models.
The plots show the areas under the curve (AUCs) and their 95%CI. A: The linear regression (LR) model in the training set [class 1 (cl 1): Before: 0.84 (0.76-0.91), after: 0.76 (0.67-0.84); class 2 (cl 2): Before: 0.88 (0.81-0.93), after: 0.76 (0.66-0.85); class 3 (cl 3): Before: 0.99 (0.96-1.00), after: 0.95 (0.89-0.98)]; B: The LR model in the testing set [cl 1: Before: 0.80 (0.65-0.92), after: 0.68 (0.53-0.82); cl 2: Before: 0.76 (0.53-0.92), after: 0.66 (0.44-0.82); cl 3: Before: 0.95 (0.88-1.00), after: 0.85 (0.66-0.97)]; C: The linear discriminant analysis (LDA) model in the training set [cl 1: Before: 0.84 (0.76-0.91), after: 0.76 (0.67-0.84); cl 2: Before: 0.86 (0.79-0.92), after: 0.75 (0.64-0.85); cl 3: Before: 0.97 (0.92-1.00), after: 0.93 (0.88-0.98)]; D: The LDA model in the testing set [cl 1: Before: 0.83 (0.69-0.93), after: 0.70 (0.56-0.85); cl 2: Before: 0.77 (0.57-0.93), after: 0.67 (0.46-0.83); cl 3: Before: 0.92 (0.83-0.99), after: 0.85 (0.65-0.98)]; E: The eXtreme gradient boosting (XGBoost) model in the training set [cl 1: Before: 0.93 (0.86-0.97), after: 0.89 (0.82-0.94); cl 2: Before: 0.92 (0.85-0.97), after: 0.84 (0.75-0.92); cl 3: Before: 0.96 (0.91-1.00), after: 0.94 (0.86-1.00)]; F: The XGBoost model in the testing set [cl 1: Before: 0.81 (0.65-0.93), after: 0.83 (0.68-0.95); cl 2: Before: 0.70 (0.47-0.87), after: 0.70 (0.45-0.87); cl 3: Before: 0.79 (0.56-0.96), after: 0.88 (0.75-0.97)]; G: The categorical features and gradient boosting (CatBoost) model in the training set [cl 1: Before: 0.95 (0.91-0.99), after: 0.87 (0.79-0.93); cl 2: Before: 0.93 (0.87-0.97), after: 0.82 (0.72-0.91); cl 3: Before: 0.96 (0.90-1.00), after: 0.88 (0.73-1.00)]; and H: The CatBoost model in the testing set [cl 1: Before: 0.82 (0.67-0.93), after: 0.79 (0.64-0.91); cl 2: Before: 0.72 (0.51-0.90), after: 0.68 (0.45-0.85); cl 3: Before: 0.83 (0.67-0.96), after: 0.84 (0.68-0.93)]. The curves of the models constructed with the full-variable datasets and the datasets containing only important variables are depicted with solid lines and dashed lines, respectively (abbreviated as “before” and “after” in this annotation).
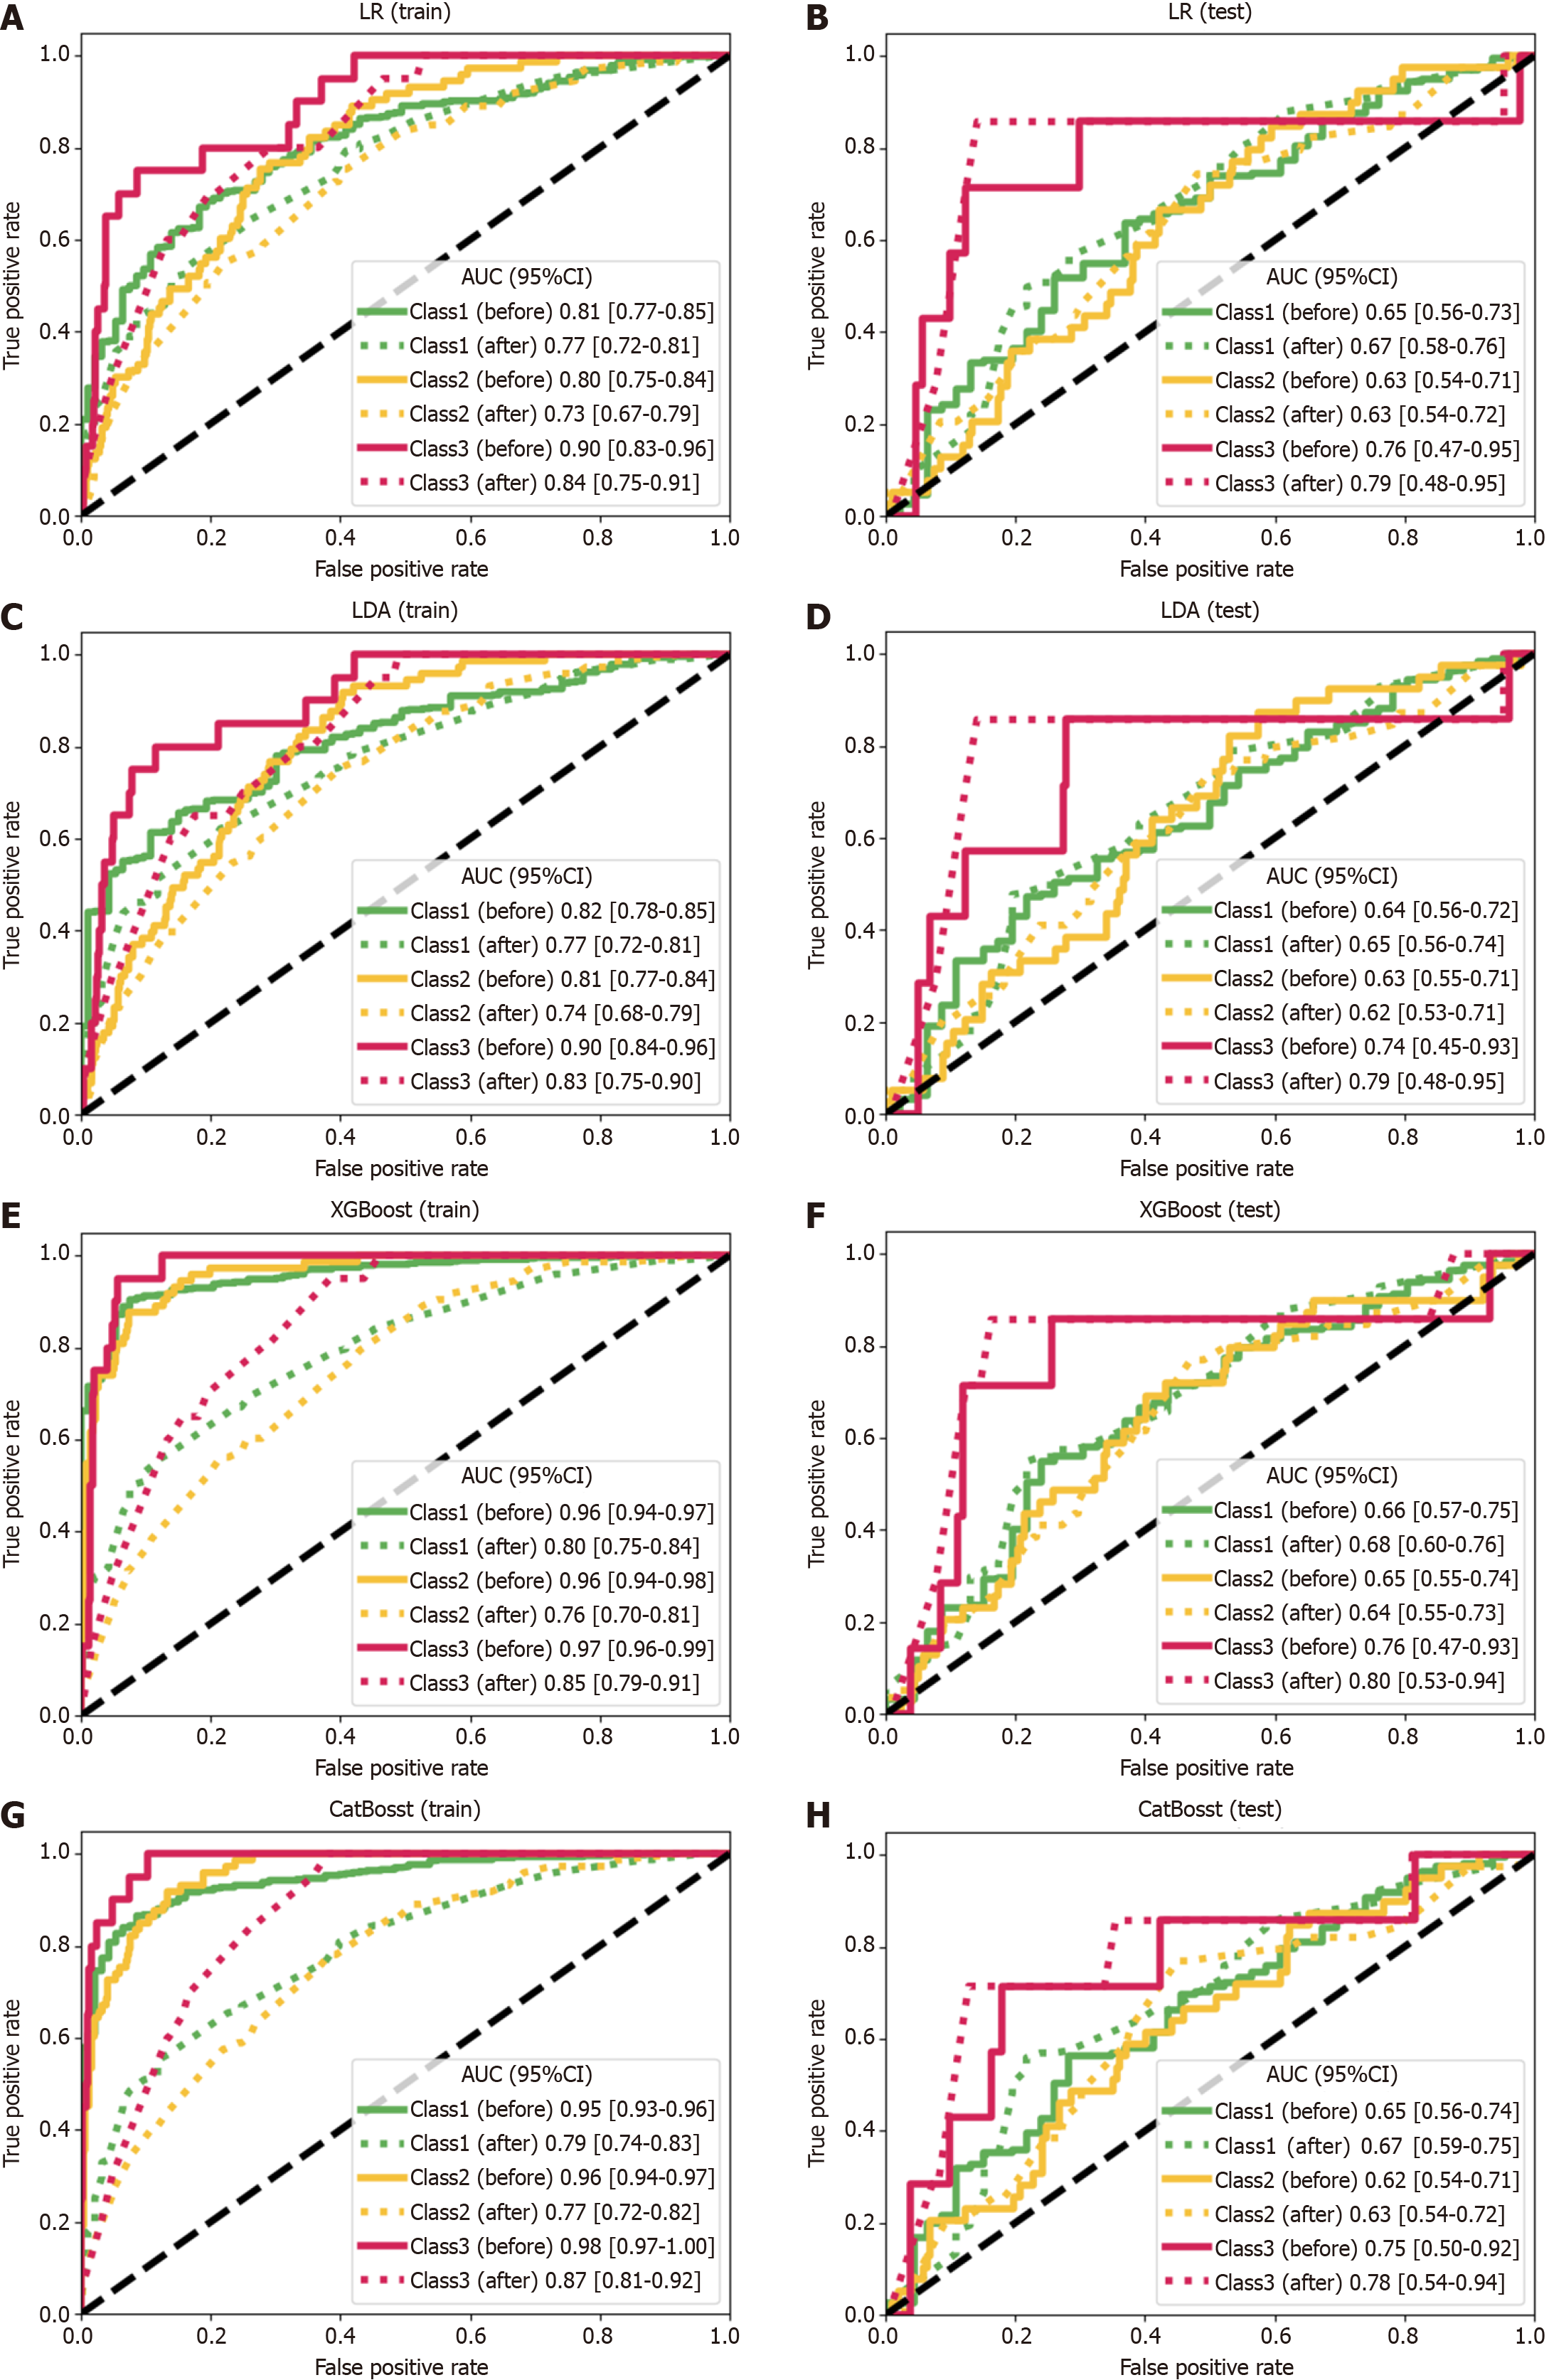
Figure 5 Prediction of distant metastasis-free survival by machine learning models.
The plots show the areas under the curve (AUCs) and their 95%CI. A: The linear regression (LR) model in the training set [class 1 (cl 1): Before: 0.81 (0.77-0.85), after: 0.77 (0.72-0.81); class 2 (cl 2): Before: 0.80 (0.75-0.84), after: 0.73 (0.67-0.79); class 3 (cl 3): Before: 0.90 (0.83-0.96), after: 0.84 (0.75-0.91)]; B: The LR model in the testing set [cl 1: Before: 0.65 (0.56-0.73), after: 0.67 (0.58-0.76); cl 2: Before: 0.63 (0.54-0.71), after: 0.63 (0.54-0.72); cl 3: Before: 0.76 (0.47-0.95), after: 0.79 (0.48-0.95)]; C: The linear discriminant analysis (LDA) model in the training set [cl 1: Before: 0.82 (0.78-0.85), after: 0.77 (0.72-0.81); cl 2: Before: 0.81 (0.77-0.84), after: 0.74 (0.68-0.79); cl 3: Before: 0.90 (0.84-0.96), after: 0.83 (0.75-0.90)]; D: The LDA model in the testing set [cl 1: Before: 0.64 (0.56-0.72), after: 0.65 (0.56-0.74); cl 2: Before: 0.63 (0.55-0.71), after: 0.62 (0.53-0.71); cl 3: Before: 0.74 (0.45-0.93), after: 0.79 (0.48-0.95)]; E: The eXtreme gradient boosting (XGBoost) model in the training set [cl 1: Before: 0.96 (0.94-0.97), after: 0.80 (0.75-0.84); cl 2: Before: 0.96 (0.94-0.98), after: 0.76 (0.70-0.81); cl 3: Before: 0.97 (0.96-0.99), after: 0.85 (0.79-0.91)]; F: The XGBoost model in the testing set [cl 1: Before: 0.66 (0.57-0.75), after: 0.68 (0.60-0.76); cl 2: Before: 0.65 (0.55-0.74), after: 0.64 (0.55-0.73); cl 3: Before: 0.76 (0.47-0.93), after: 0.80 (0.53-0.94)]; G: The categorical features and gradient boosting (CatBoost) model in the training set [cl 1: Before: 0.95 (0.93-0.96), after: 0.79 (0.74-0.83); cl 2: Before: 0.96 (0.94-0.97), after: 0.77 (0.72-0.82); cl 3: Before: 0.98 (0.97-1.00), after: 0.87 (0.81-0.92)]; H: The CatBoost model in the testing set [cl 1: Before: 0.65 (0.56-0.74), after: 0.67 (0.59-0.75); cl 2: Before: 0.62 (0.54-0.71), after: 0.63 (0.54-0.72); cl 3: Before: 0.75 (0.50-0.92), after: 0.78 (0.54-0.94)]. The curves of the models constructed with the full-variable datasets and the datasets containing only important variables are depicted with solid lines and dashed lines, respectively (abbreviated as “before” and “after” in this annotation).
- Citation: Ji XL, Xu S, Li XY, Xu JH, Han RS, Guo YJ, Duan LP, Tian ZB. Prognostic prediction models for postoperative patients with stage I to III colorectal cancer based on machine learning. World J Gastrointest Oncol 2024; 16(12): 4597-4613
- URL: https://www.wjgnet.com/1948-5204/full/v16/i12/4597.htm
- DOI: https://dx.doi.org/10.4251/wjgo.v16.i12.4597


