Copyright
©The Author(s) 2024.
World J Gastrointest Oncol. Nov 15, 2024; 16(11): 4477-4488
Published online Nov 15, 2024. doi: 10.4251/wjgo.v16.i11.4477
Published online Nov 15, 2024. doi: 10.4251/wjgo.v16.i11.4477
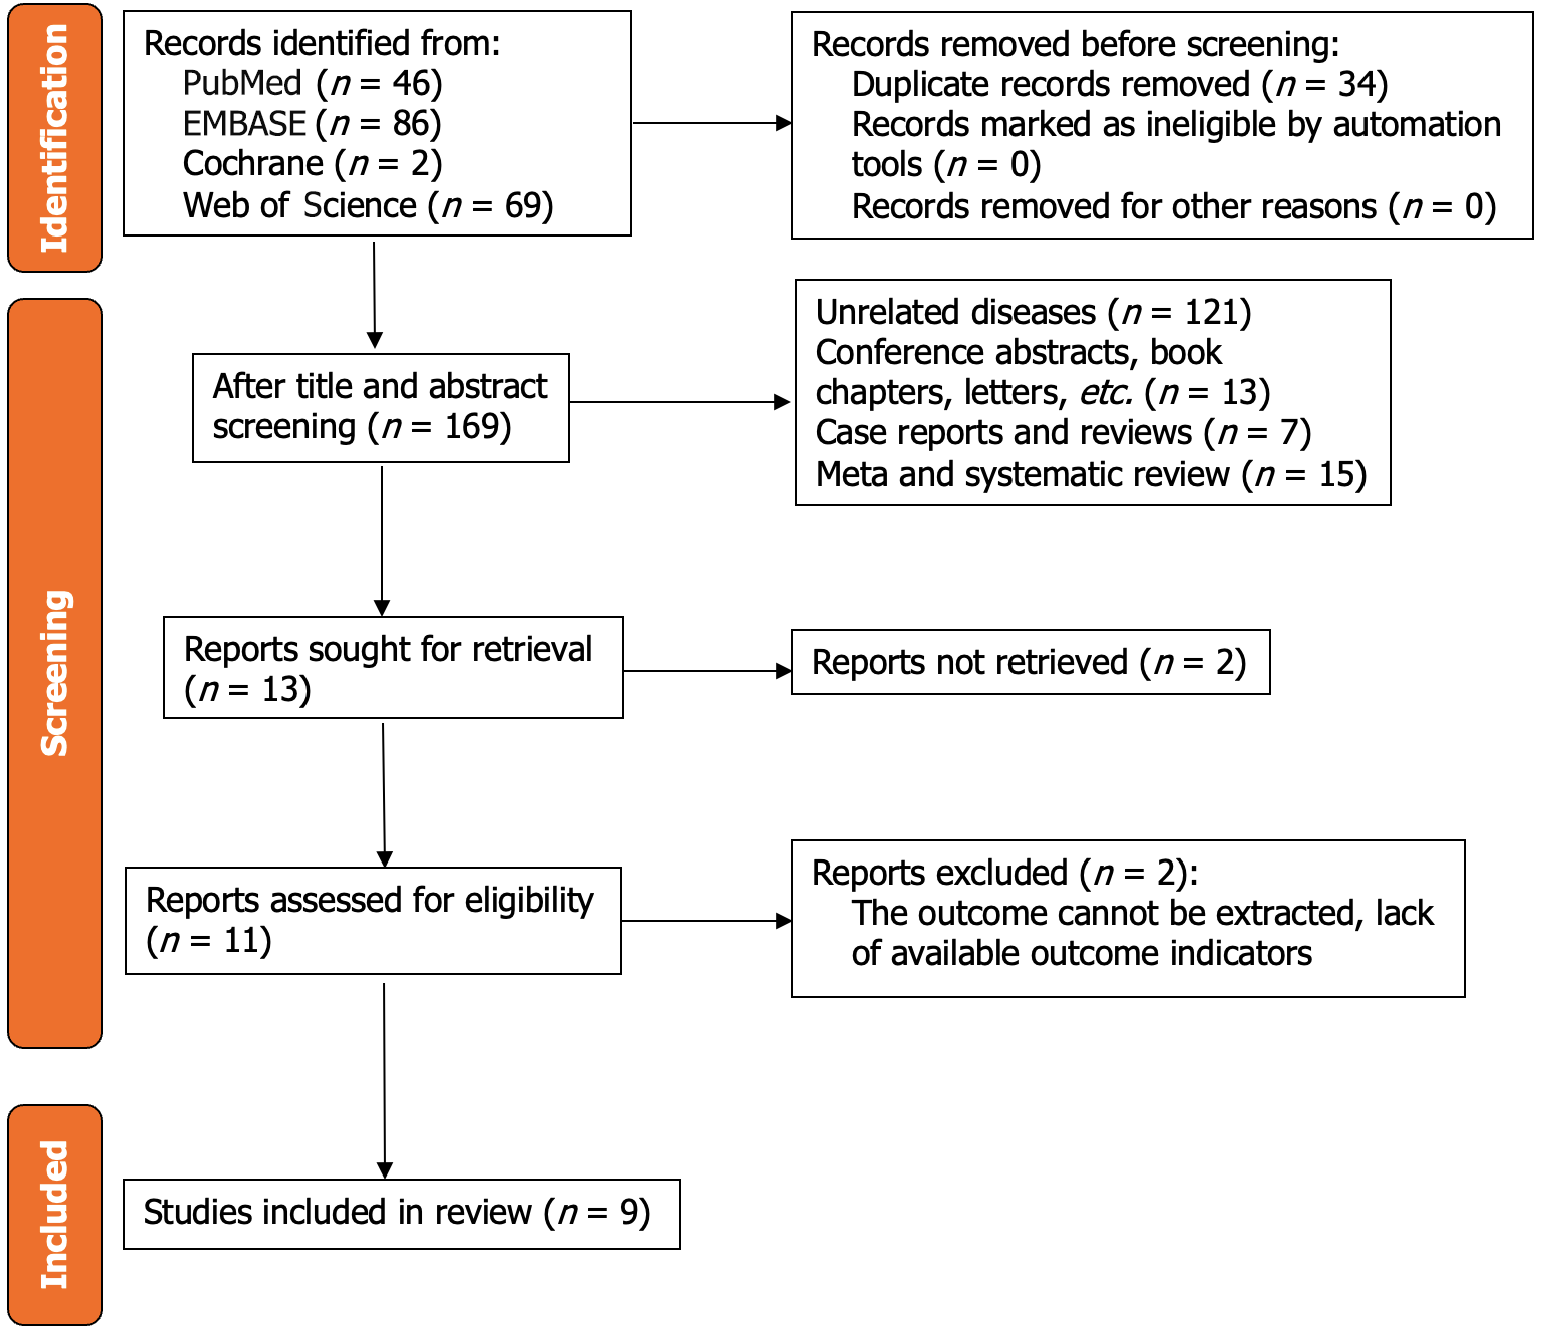
Figure 1 Flow chart of literature screening.
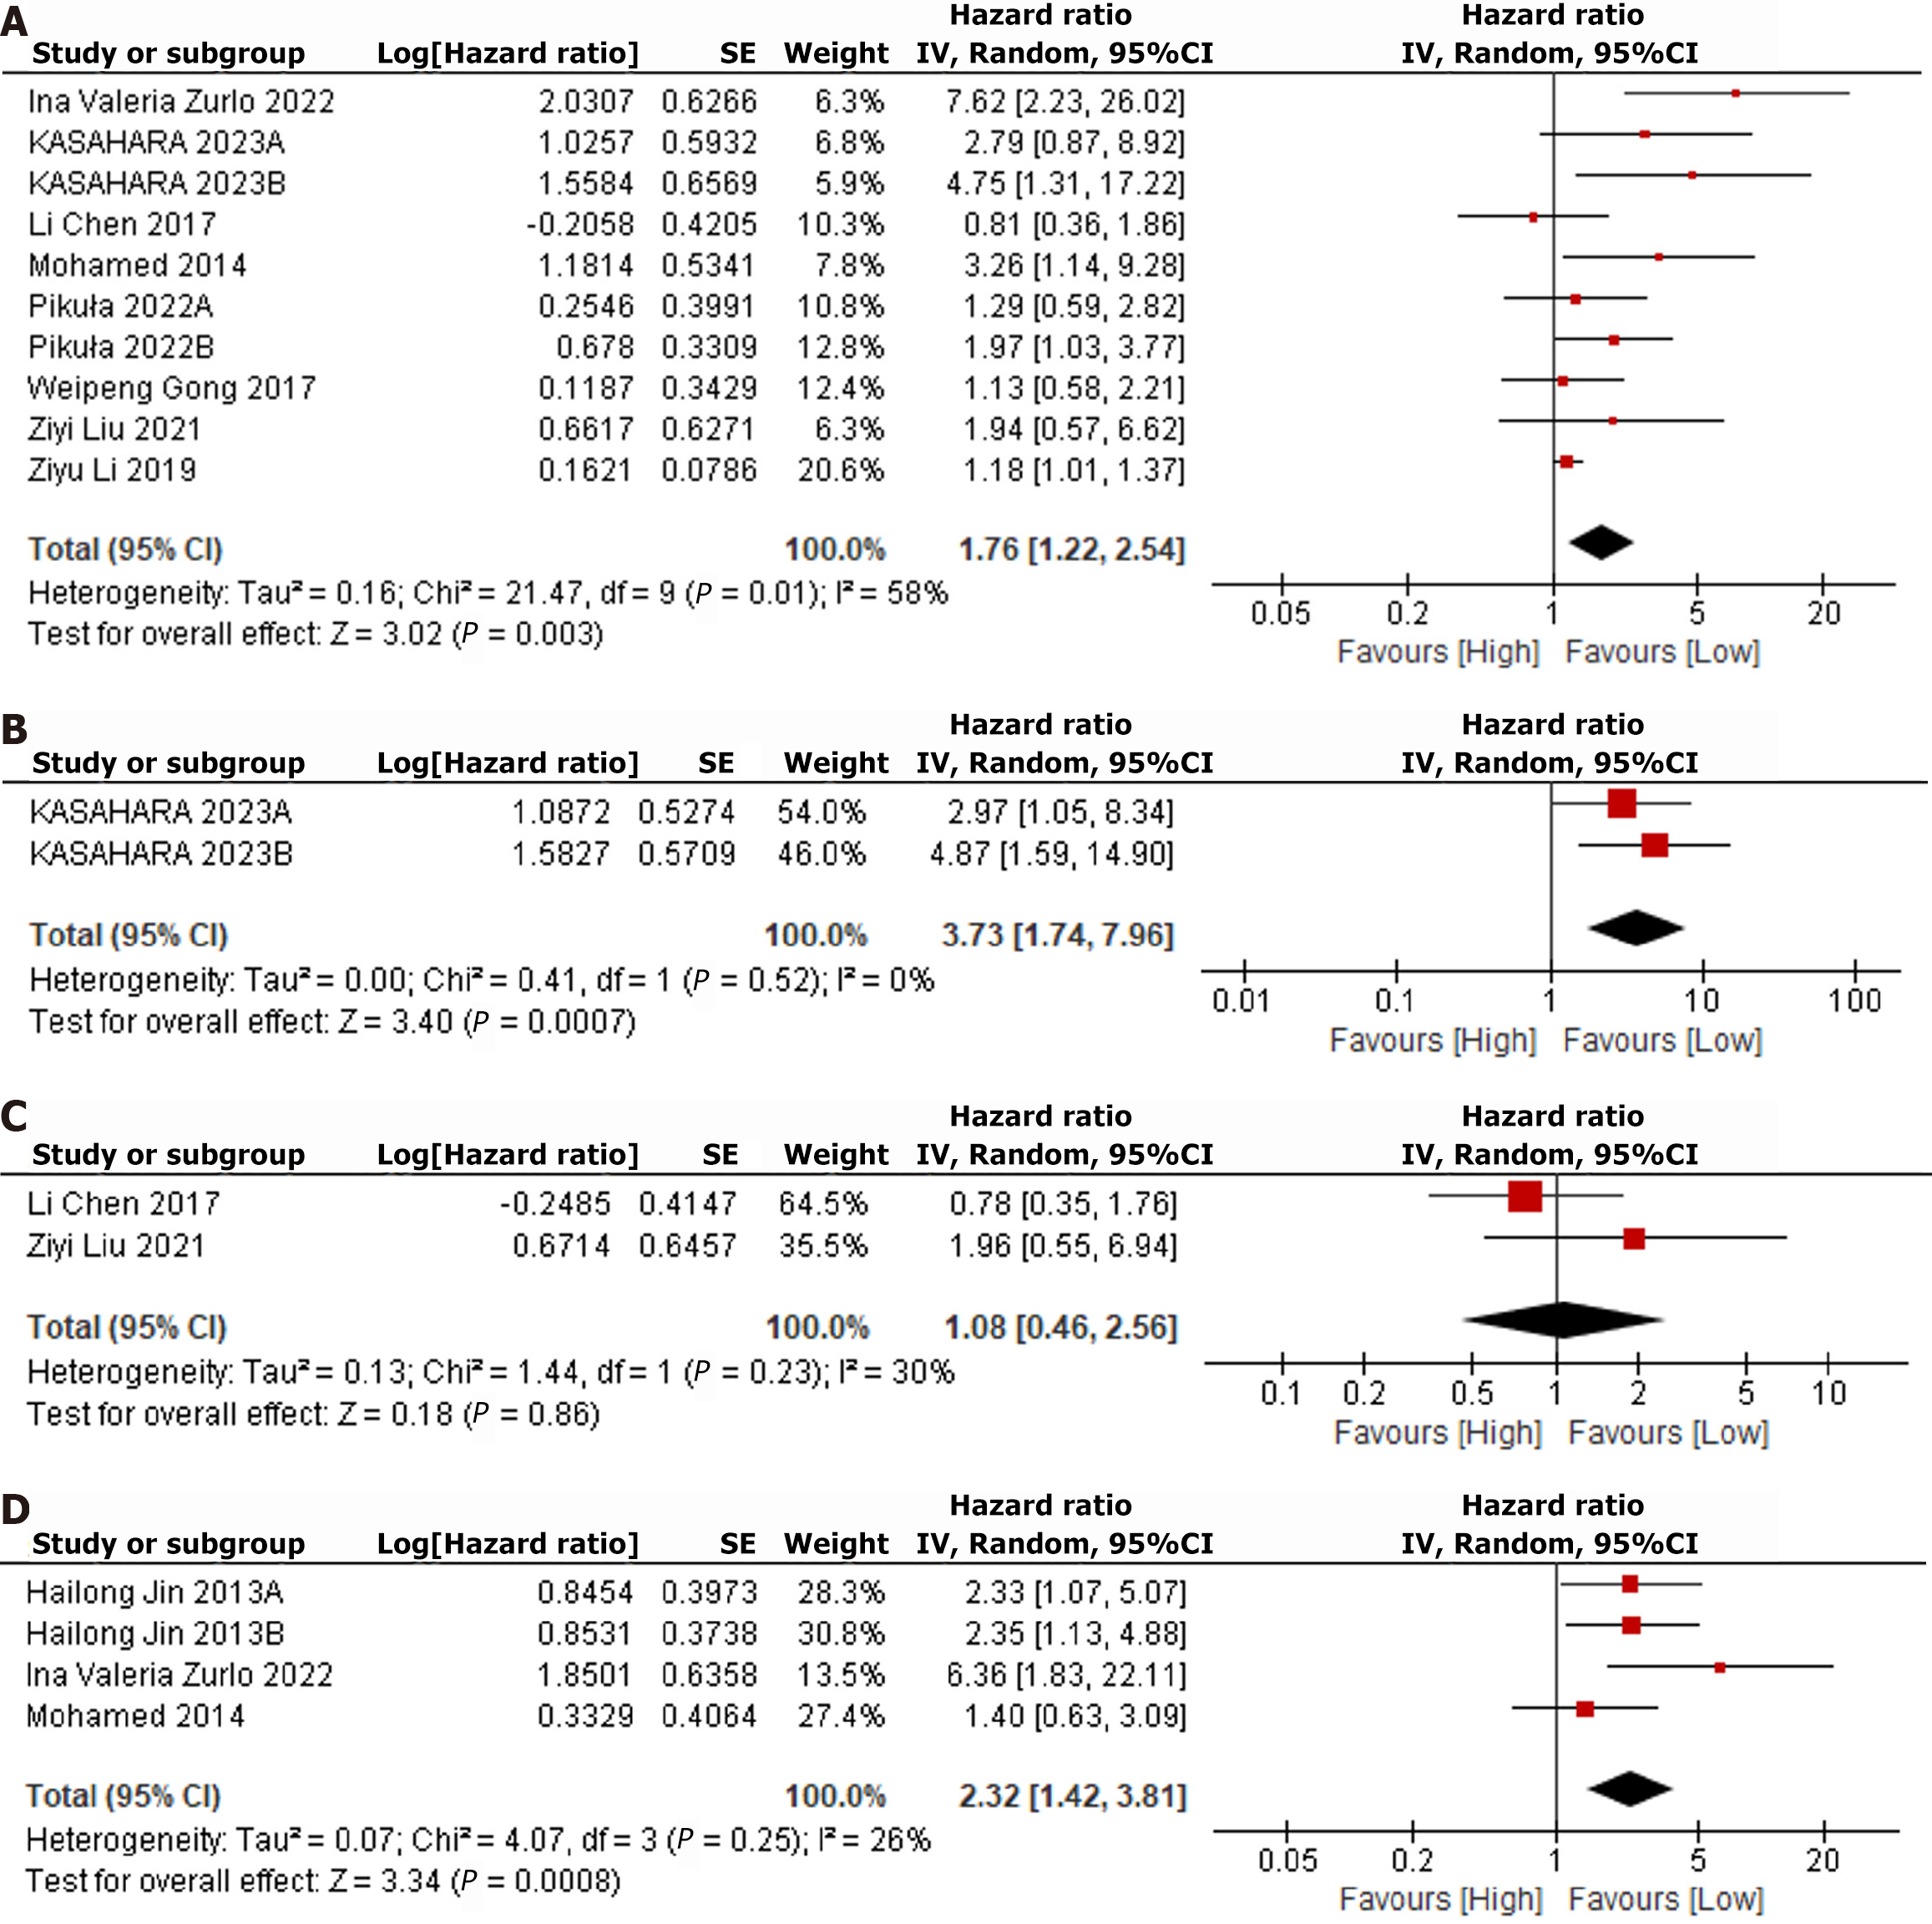
Figure 2 Forest plots for the association between neutrophil to lymphocyte ratio and overall survival, relapse-free survival, disease-free survival, progression-free survival.
A: Forest plots for the association between neutrophil to lymphocyte ratio (NLR) and overall survival; B: Forest plots for the association between NLR and relapse-free survival; C: Forest plots for the association between NLR and disease-free survival; D: Forest plots for the association between NLR and progression-free survival. CI: Confidence interval.
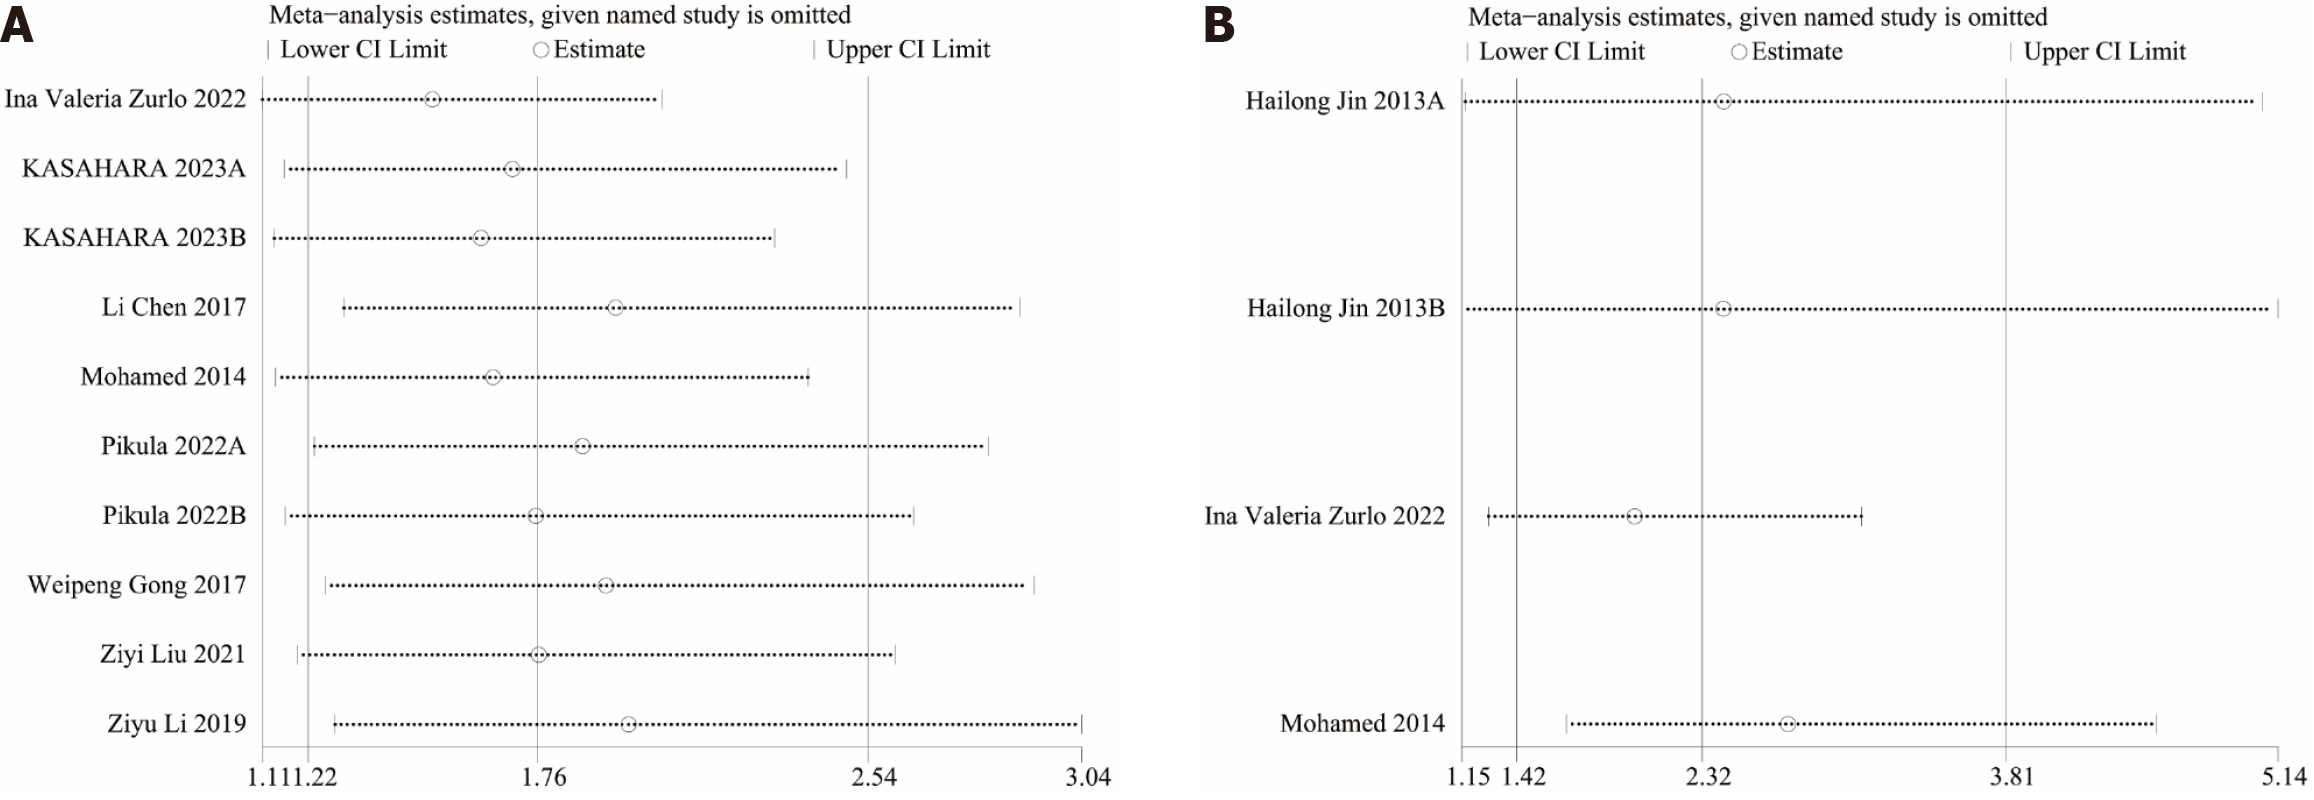
Figure 3 Sensitivity analysis of overall survival and progression-free survival.
A: Sensitivity analysis of overall survival; B: Sensitivity analysis of progression-free survival. CI: Confidence interval.
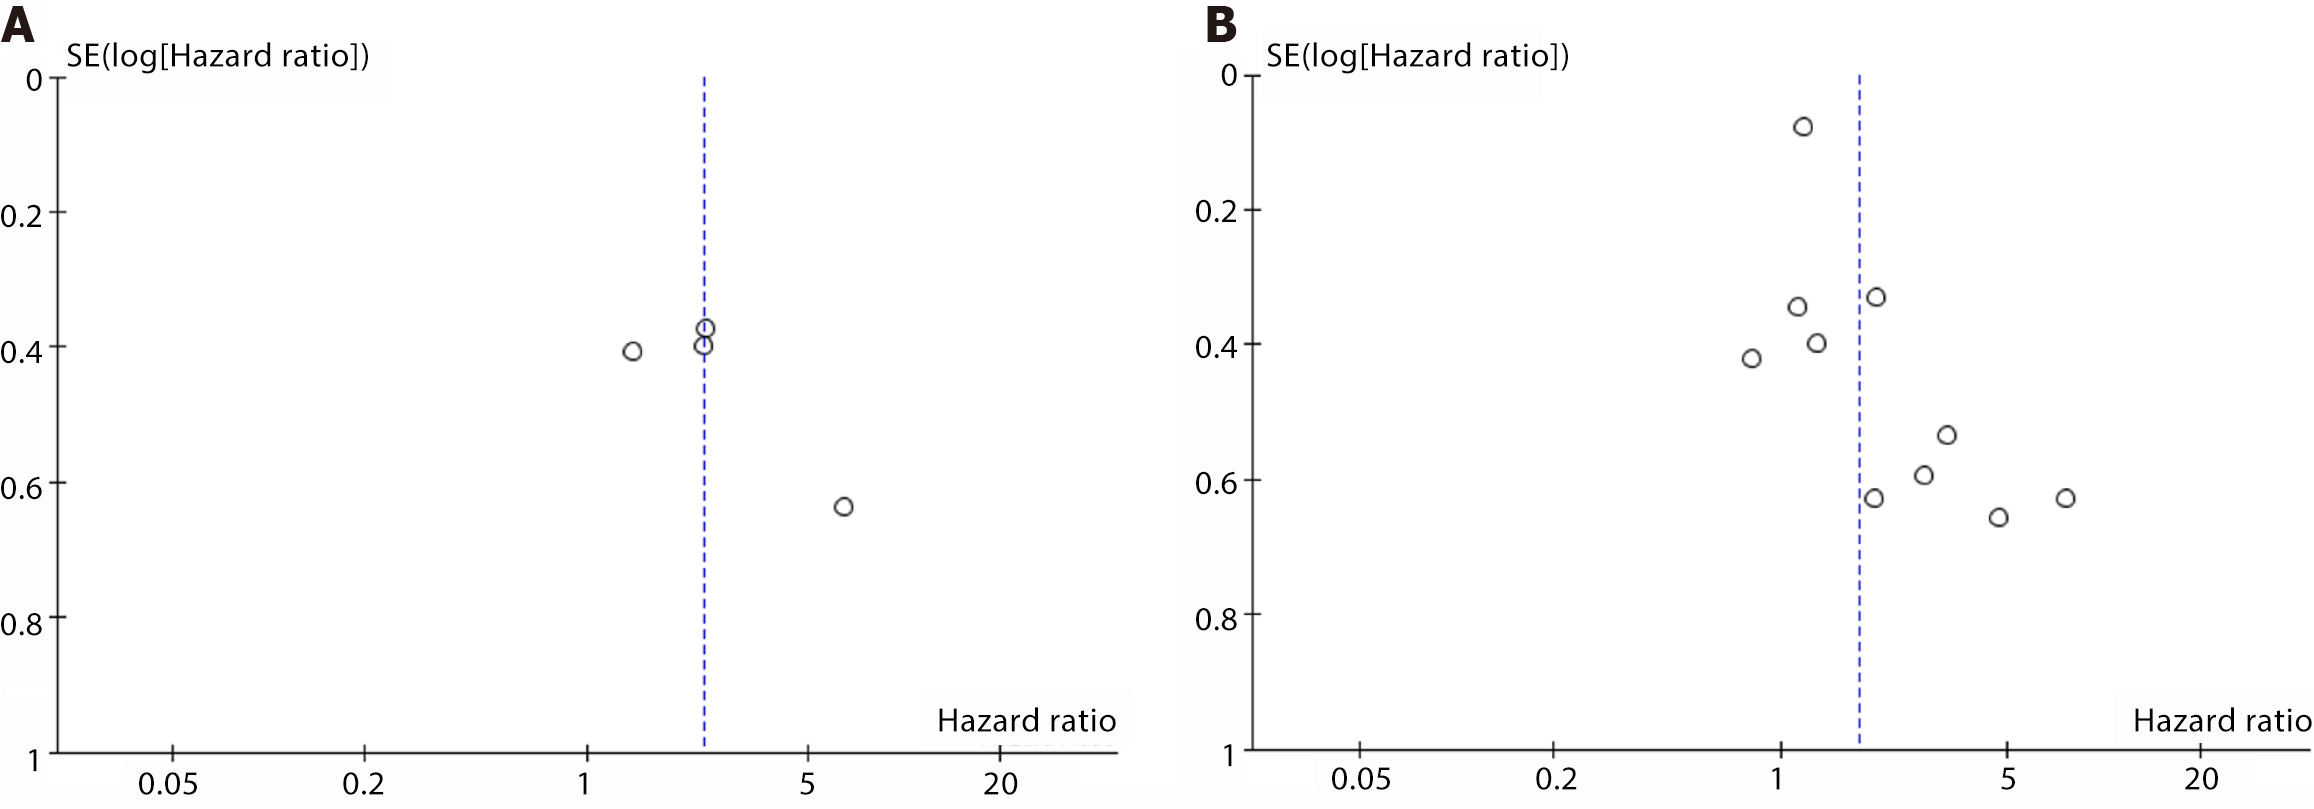
Figure 4 Funnel plot for the evaluation of publication bias for progression-free survival and overall survival.
A: Funnel plot for the evaluation of publication bias for progression-free survival; B: Funnel plot for the evaluation of publication bias for overall survival.
- Citation: Wei ZH, Tuo M, Ye C, Wu XF, Wang HH, Ren WZ, Liu G, Xiang T. Prognostic value of neutrophil-to-lymphocyte ratio in gastric cancer patients undergoing neoadjuvant chemotherapy: A systematic review and meta-analysis. World J Gastrointest Oncol 2024; 16(11): 4477-4488
- URL: https://www.wjgnet.com/1948-5204/full/v16/i11/4477.htm
- DOI: https://dx.doi.org/10.4251/wjgo.v16.i11.4477


