Copyright
©The Author(s) 2024.
World J Gastrointest Oncol. Jan 15, 2024; 16(1): 61-78
Published online Jan 15, 2024. doi: 10.4251/wjgo.v16.i1.61
Published online Jan 15, 2024. doi: 10.4251/wjgo.v16.i1.61
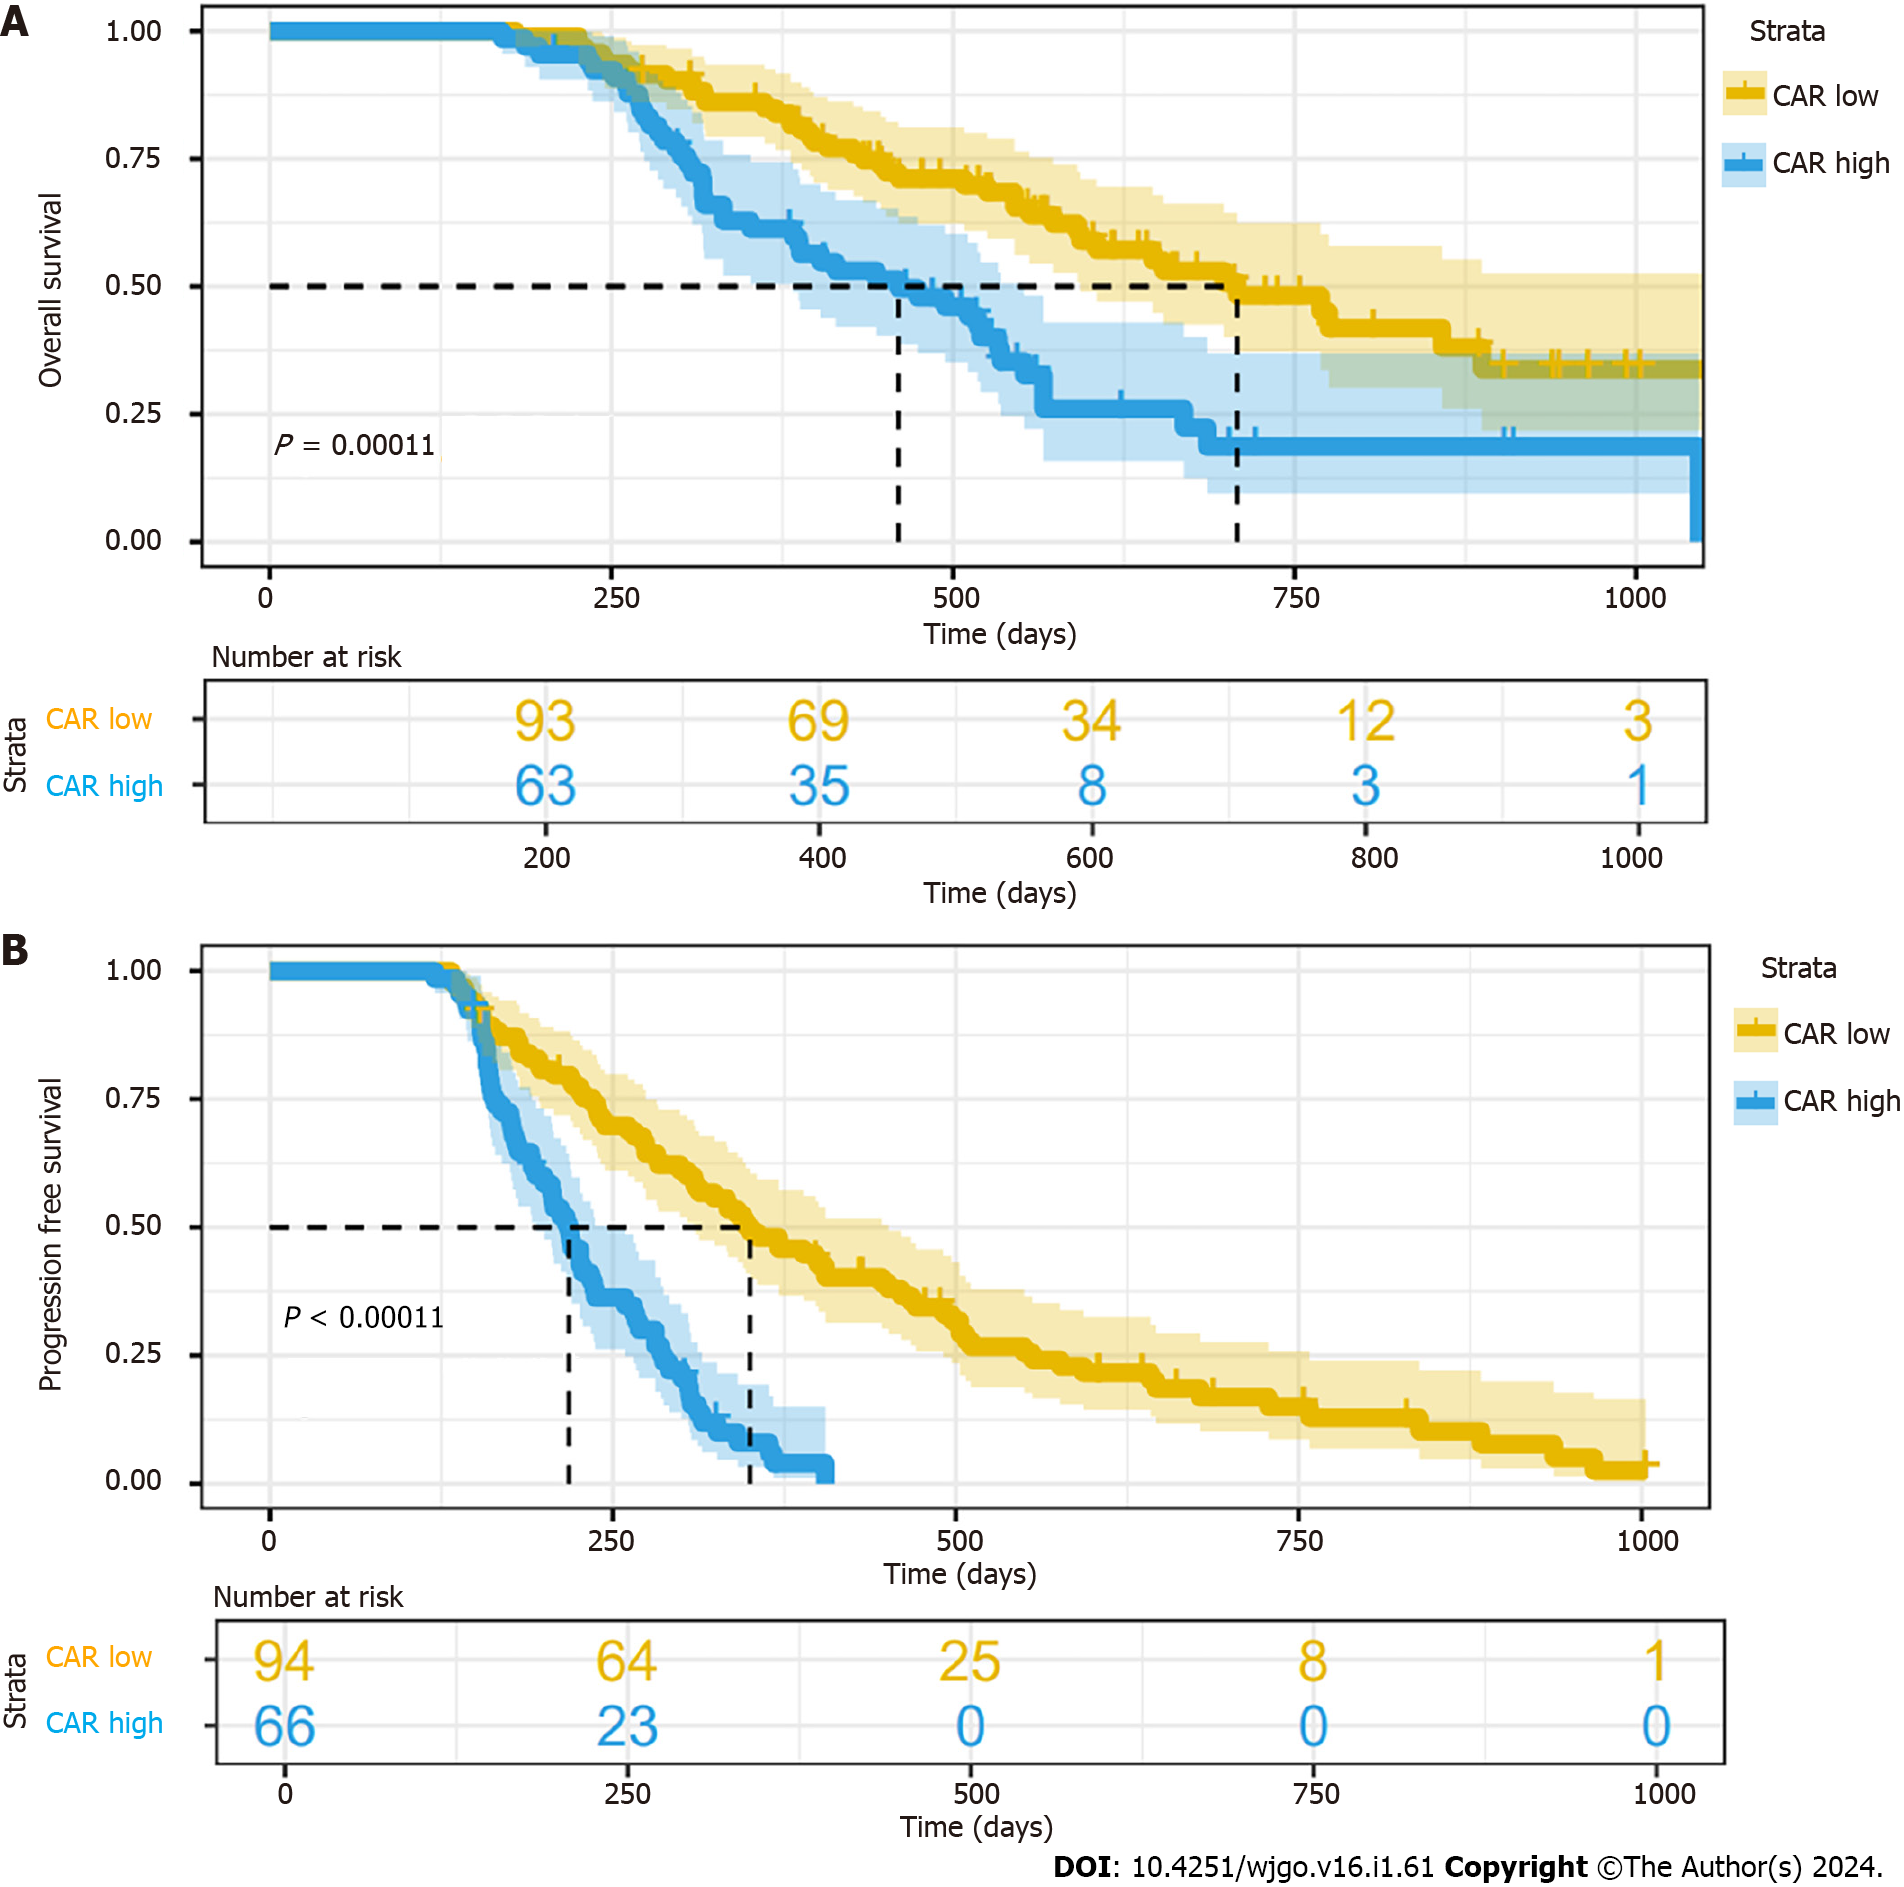
Figure 1 Kaplan-Meier survival curve of hepatocellular carcinoma in low C-reactive protein to albumin ratio group and high C-reactive protein to albumin group.
A: Overall survival; B: Progression-free survival. CAR: C-reactive protein to albumin ratio.
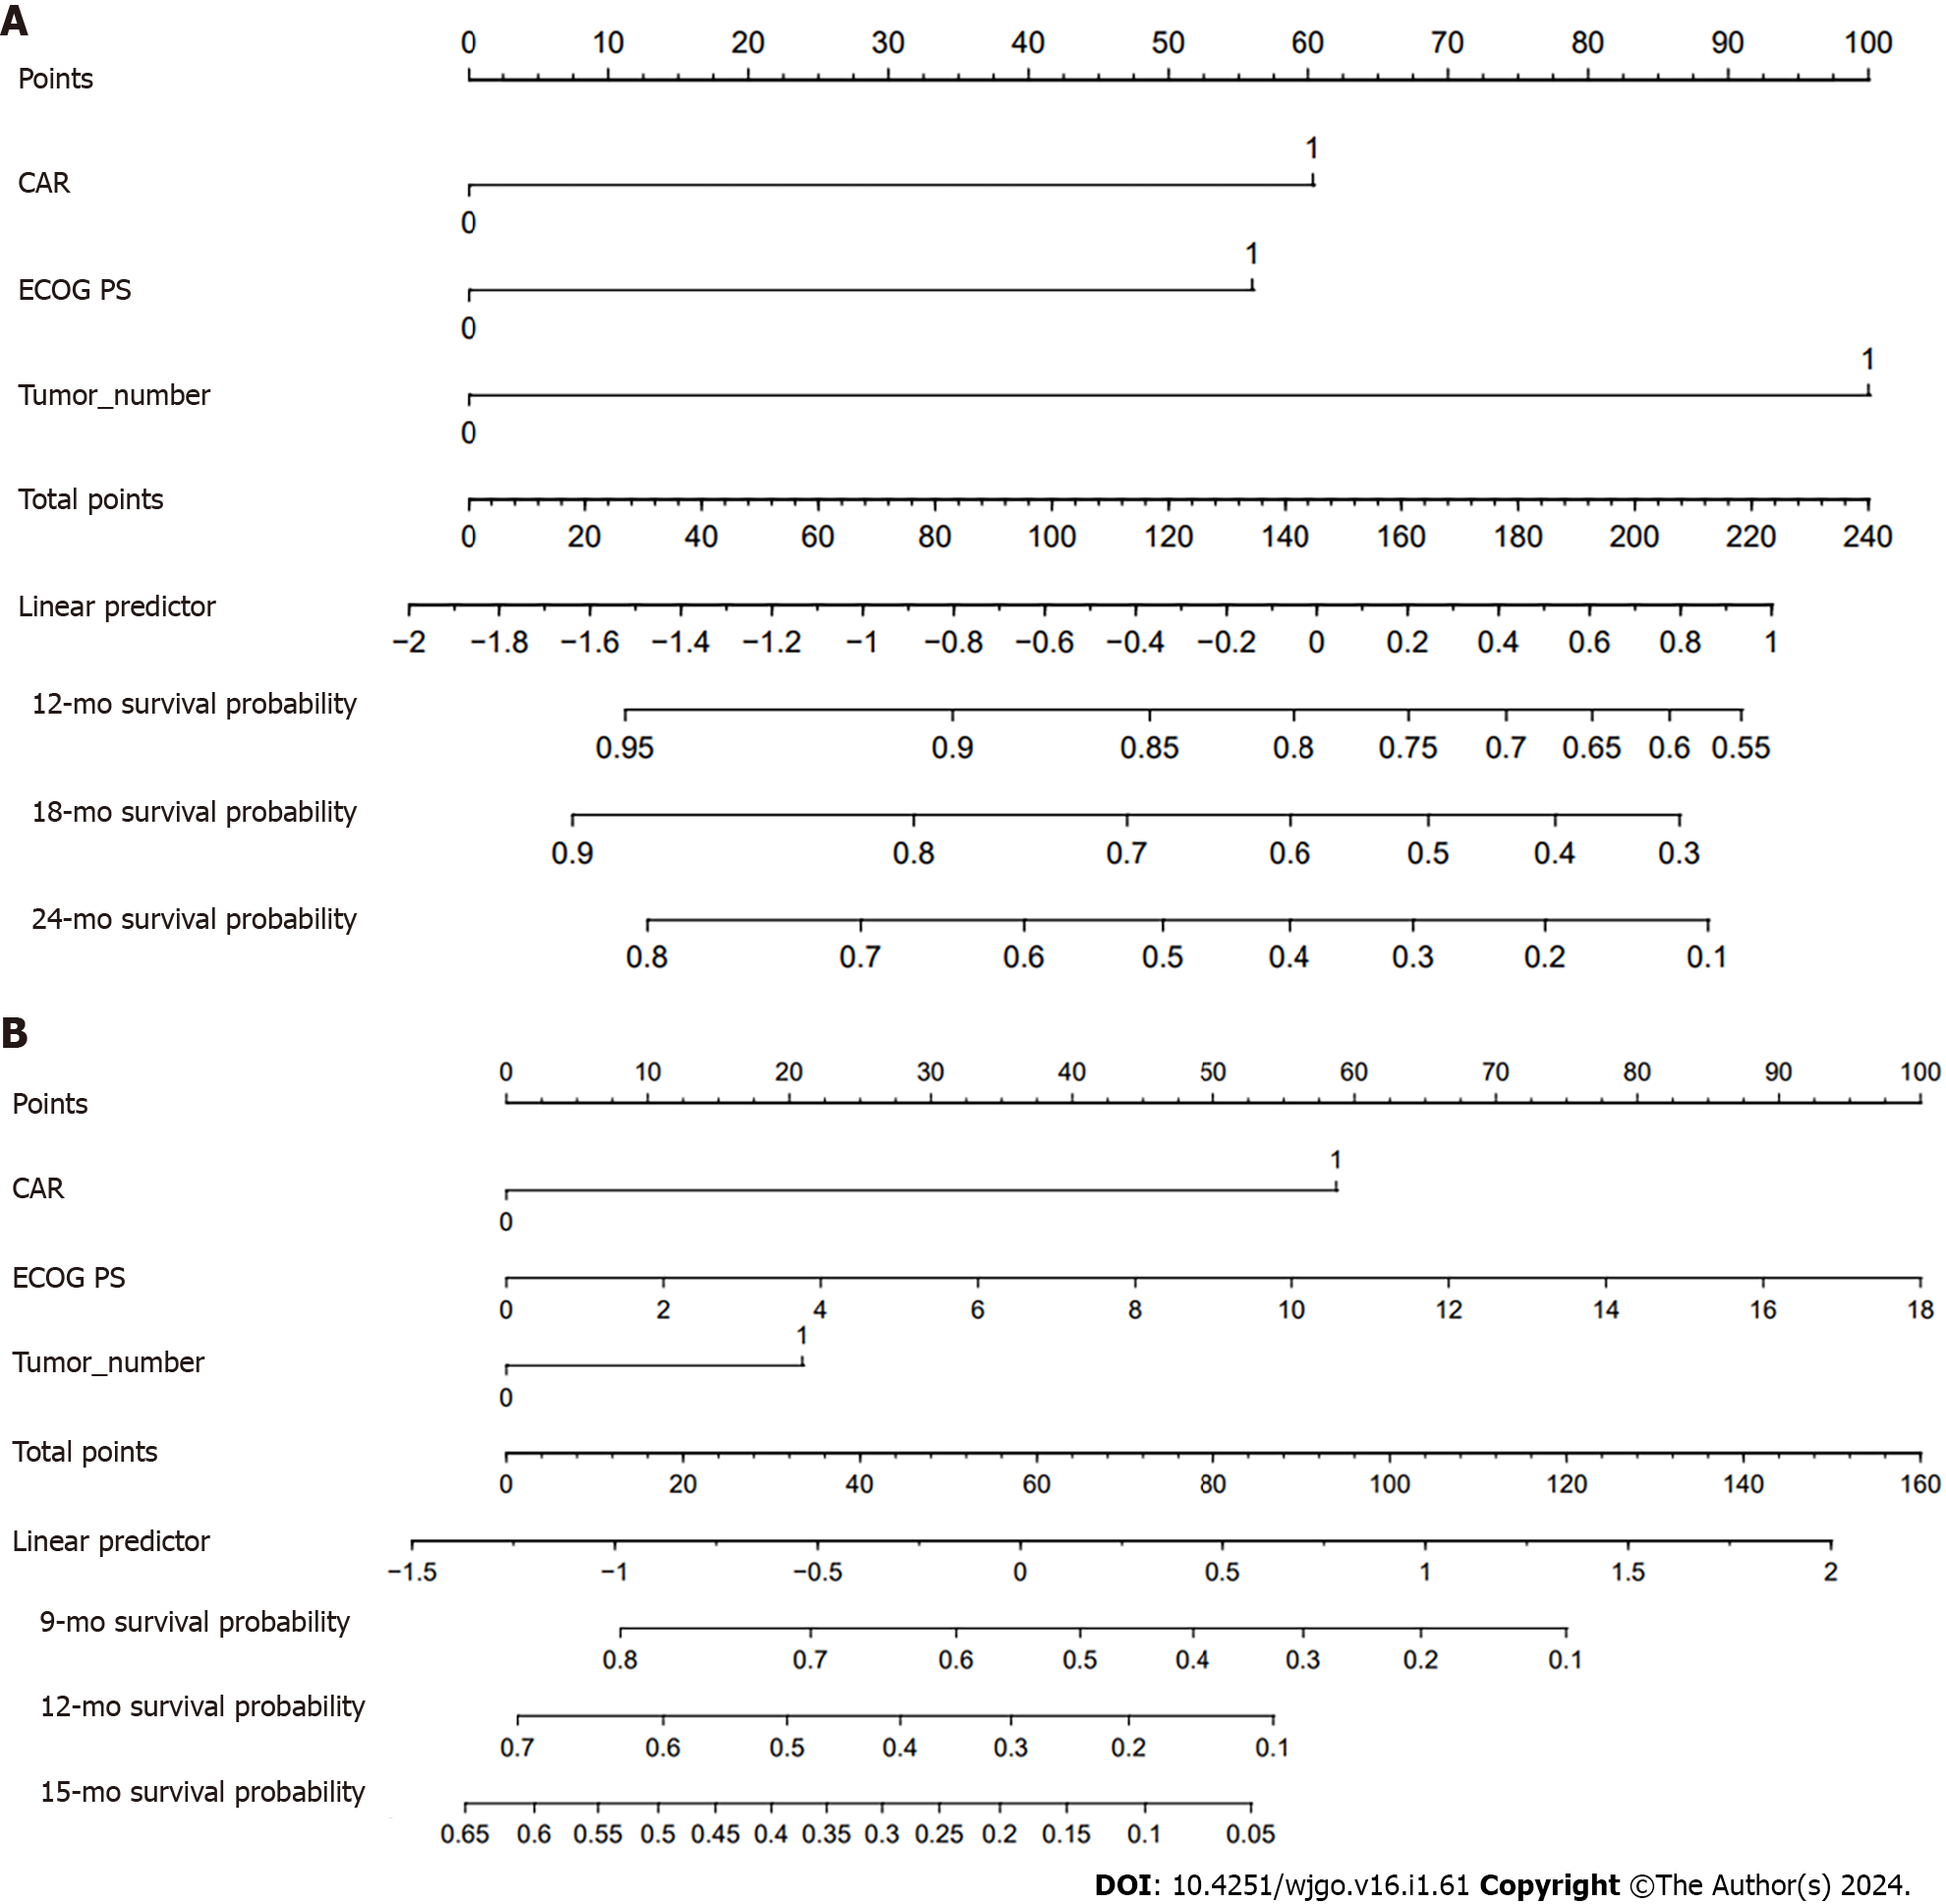
Figure 2 Nomogram models of overall survival and progression-free survival in hepatocellular carcinoma patients.
A: Nomogram models of overall survival at 12, 18 and 24 mo in hepatocellular carcinoma (HCC) patients; B: Nomogram model of progression-free survival at 9, 12 and 15 mo in HCC patients. C-reactive protein to albumin ratio (CAR) = 0 means CAR ≤ 1.20, CAR = 1 means CAR > 1.20; tumor number = 0 means single tumor, tumor number = 1 means multiple tumors. CAR: C-reactive protein to albumin ratio; NLR: Neutrophil-to-lymphocyte ratio; ECOG PS: Eastern Cooperative Oncology Group performance status.
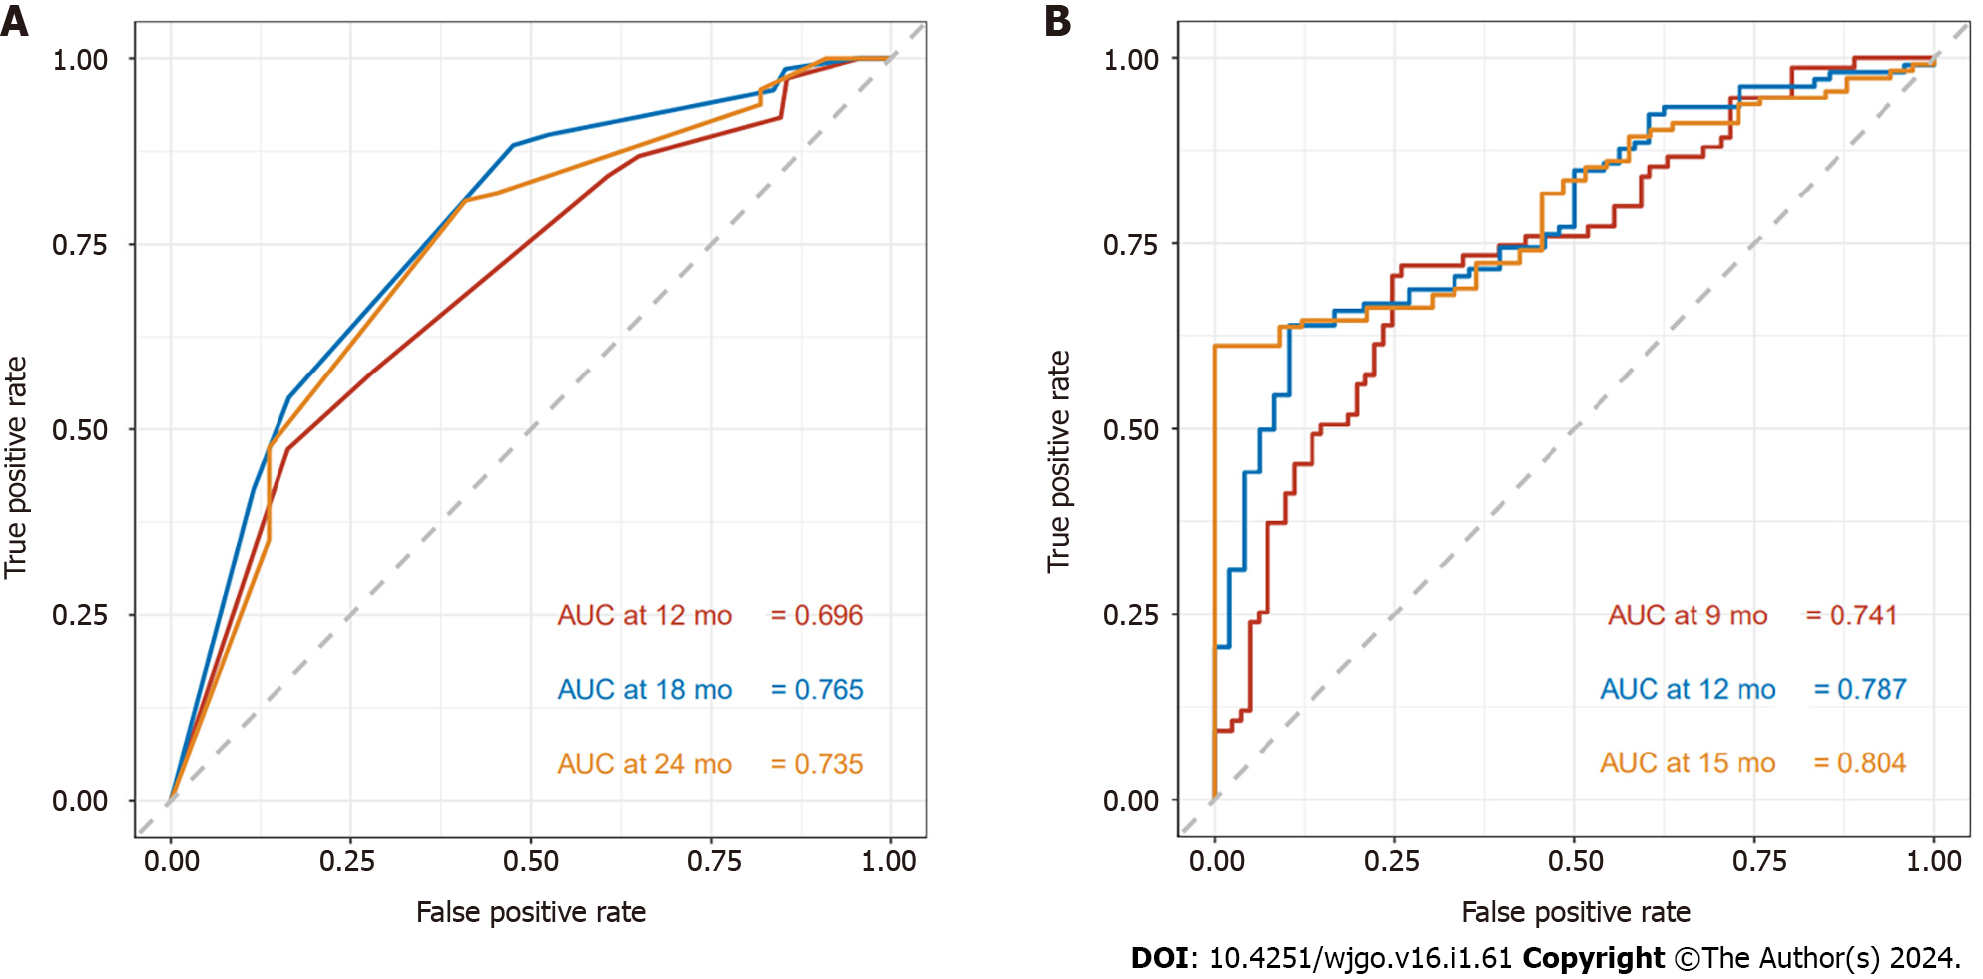
Figure 3 The area under the receiver operating characteristic curve was utilized to weigh up the performance of overall survival and progression-free survival nomogram models.
A: Receiver operating characteristic (ROC) curves for 12-mo, 18-mo, and 24-mo overall survival; B: ROC curves for 9-mo, 12-mo, and 15-mo progression-free survival. AUC: Area under the receiver operating characteristic curve.
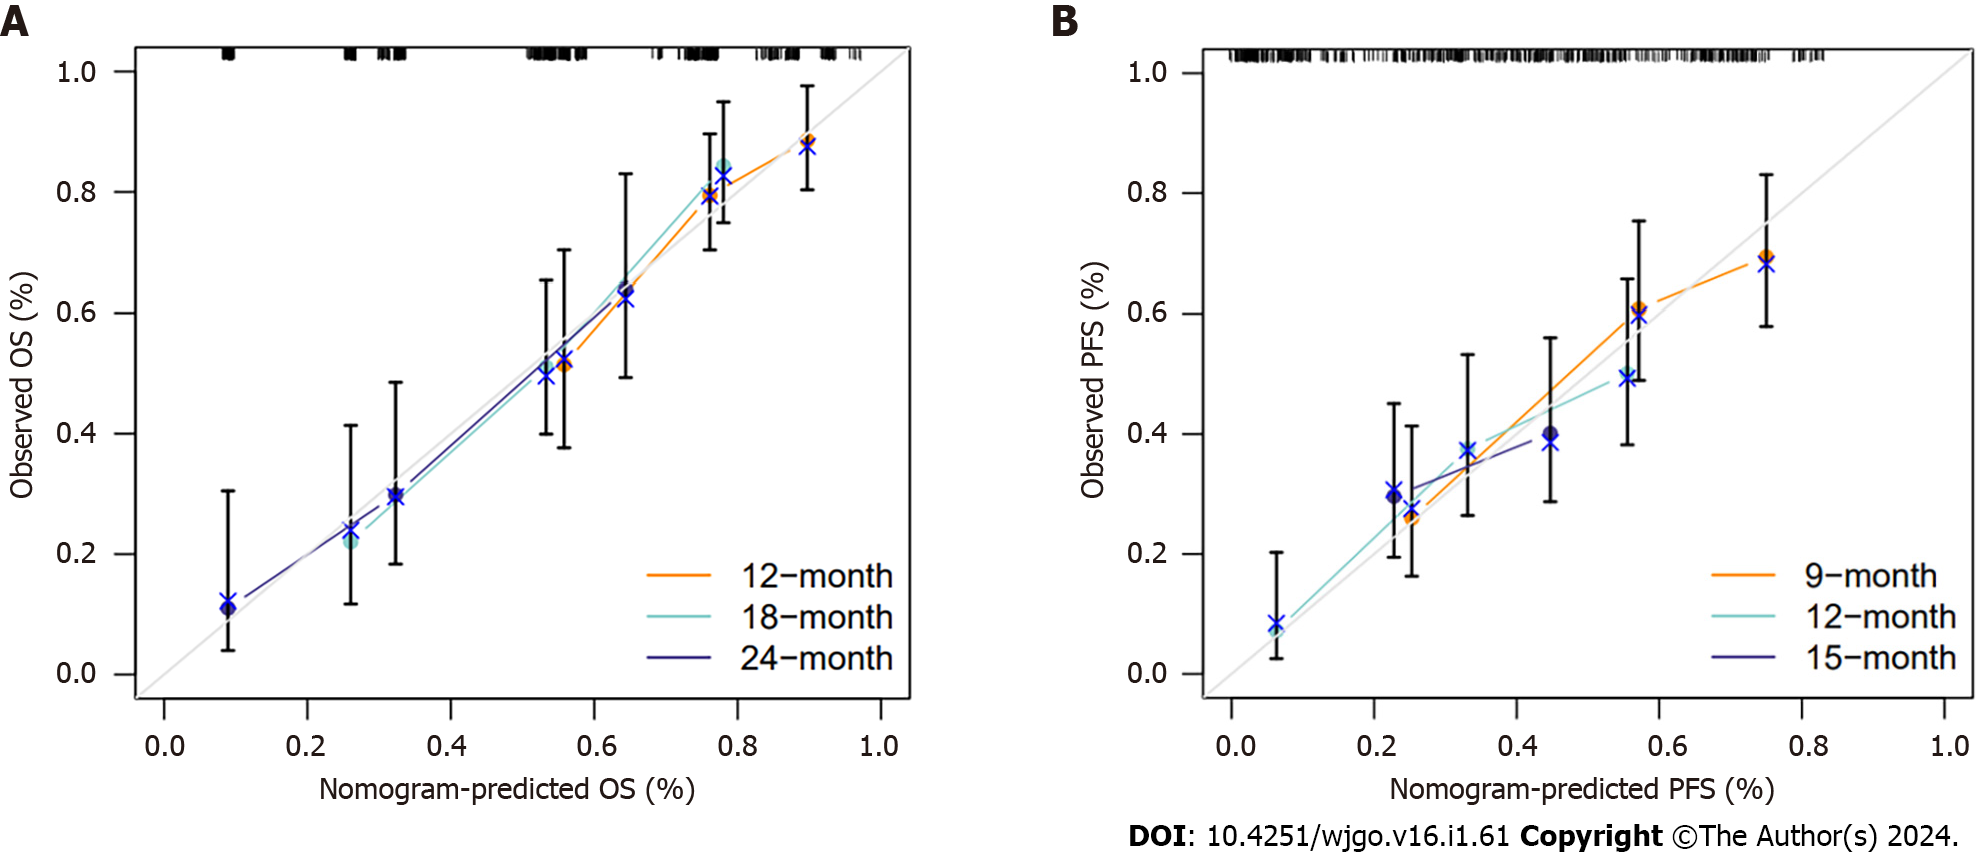
Figure 4 Calibration curves for nomogram models related to overall survival and progression-free survival.
A: Calibration curves of overall survival at 12 mo, 18 mo and 24 mo; B: Calibration curves of progression-free survival at 9 mo, 12 mo and 15 mo. OS: Overall survival; PFS: Progression-free survival.
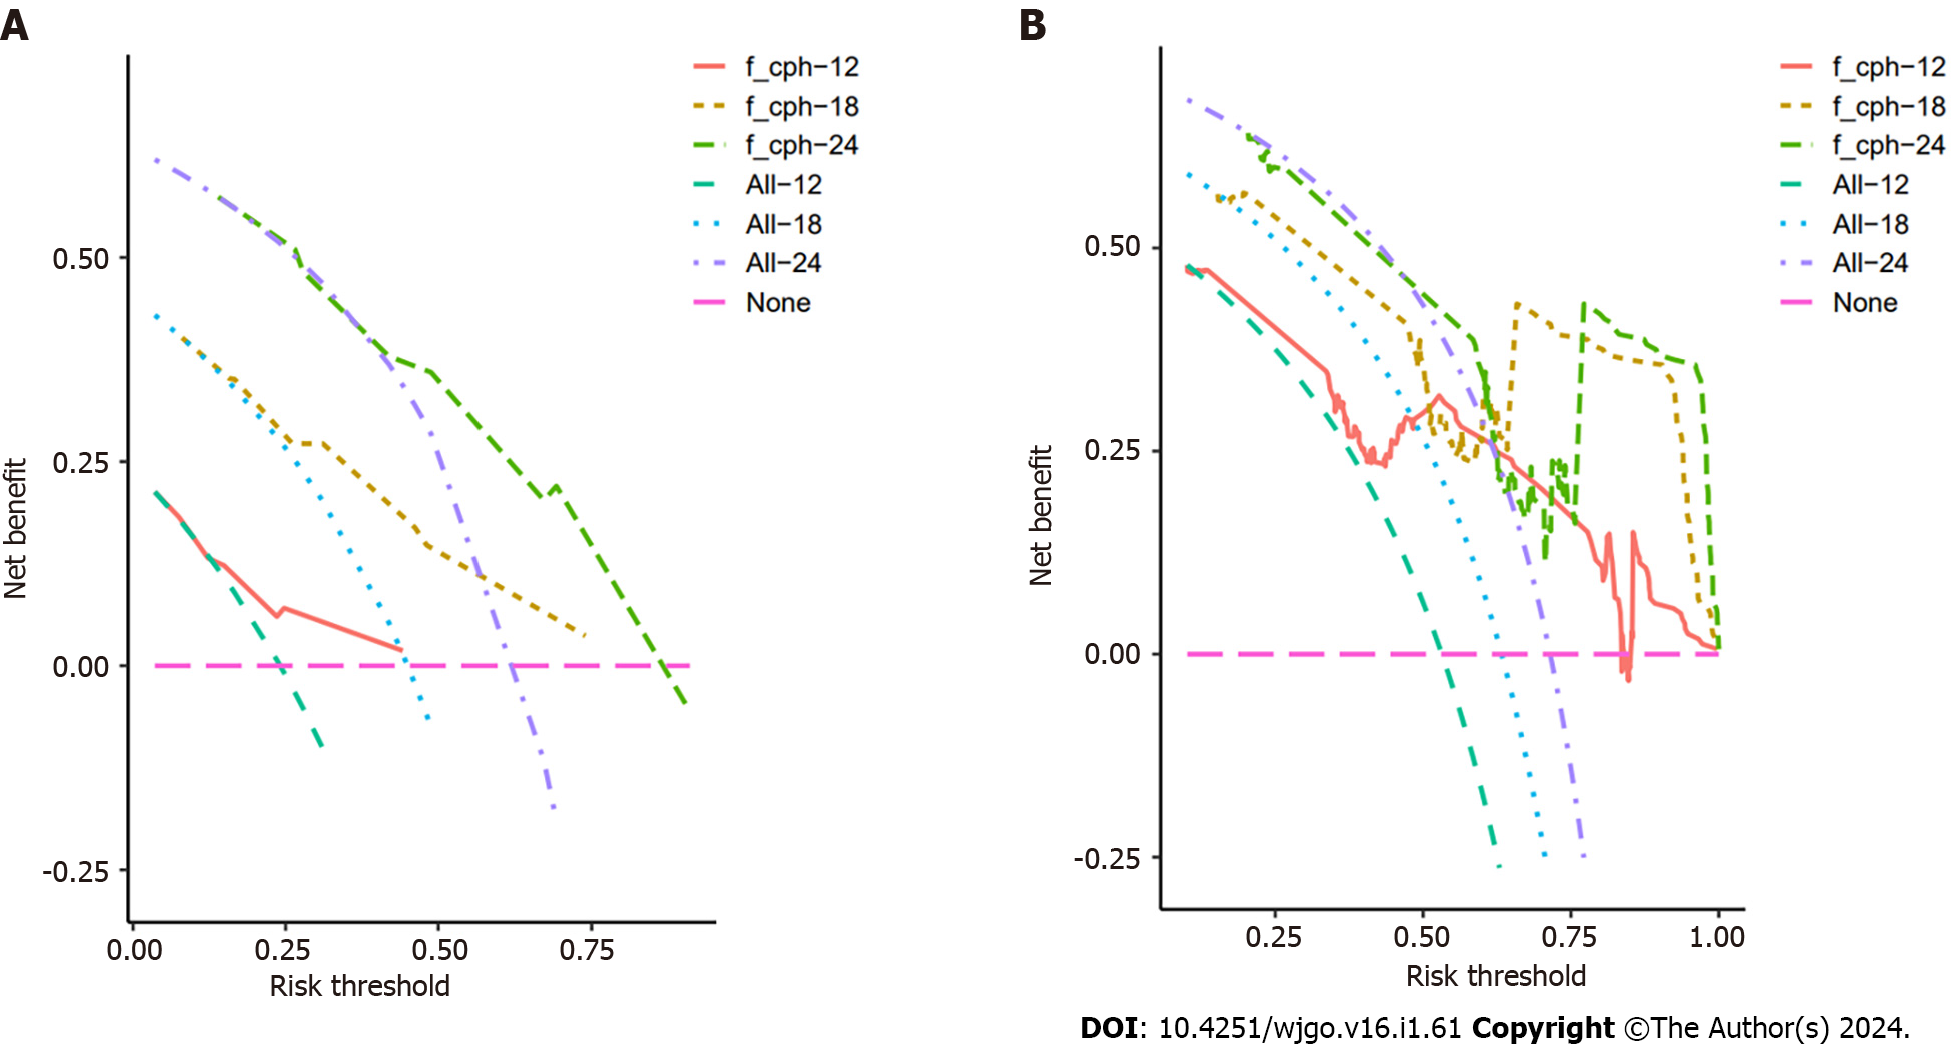
Figure 5 Decision curve analysis of overall survival and progression-free survival nomograms.
A: Decision curve analysis (DCA) of overall survival at 12, 18, and 24 mo; B: DCA of progression-free survival at 9, 12, and 15 mo.
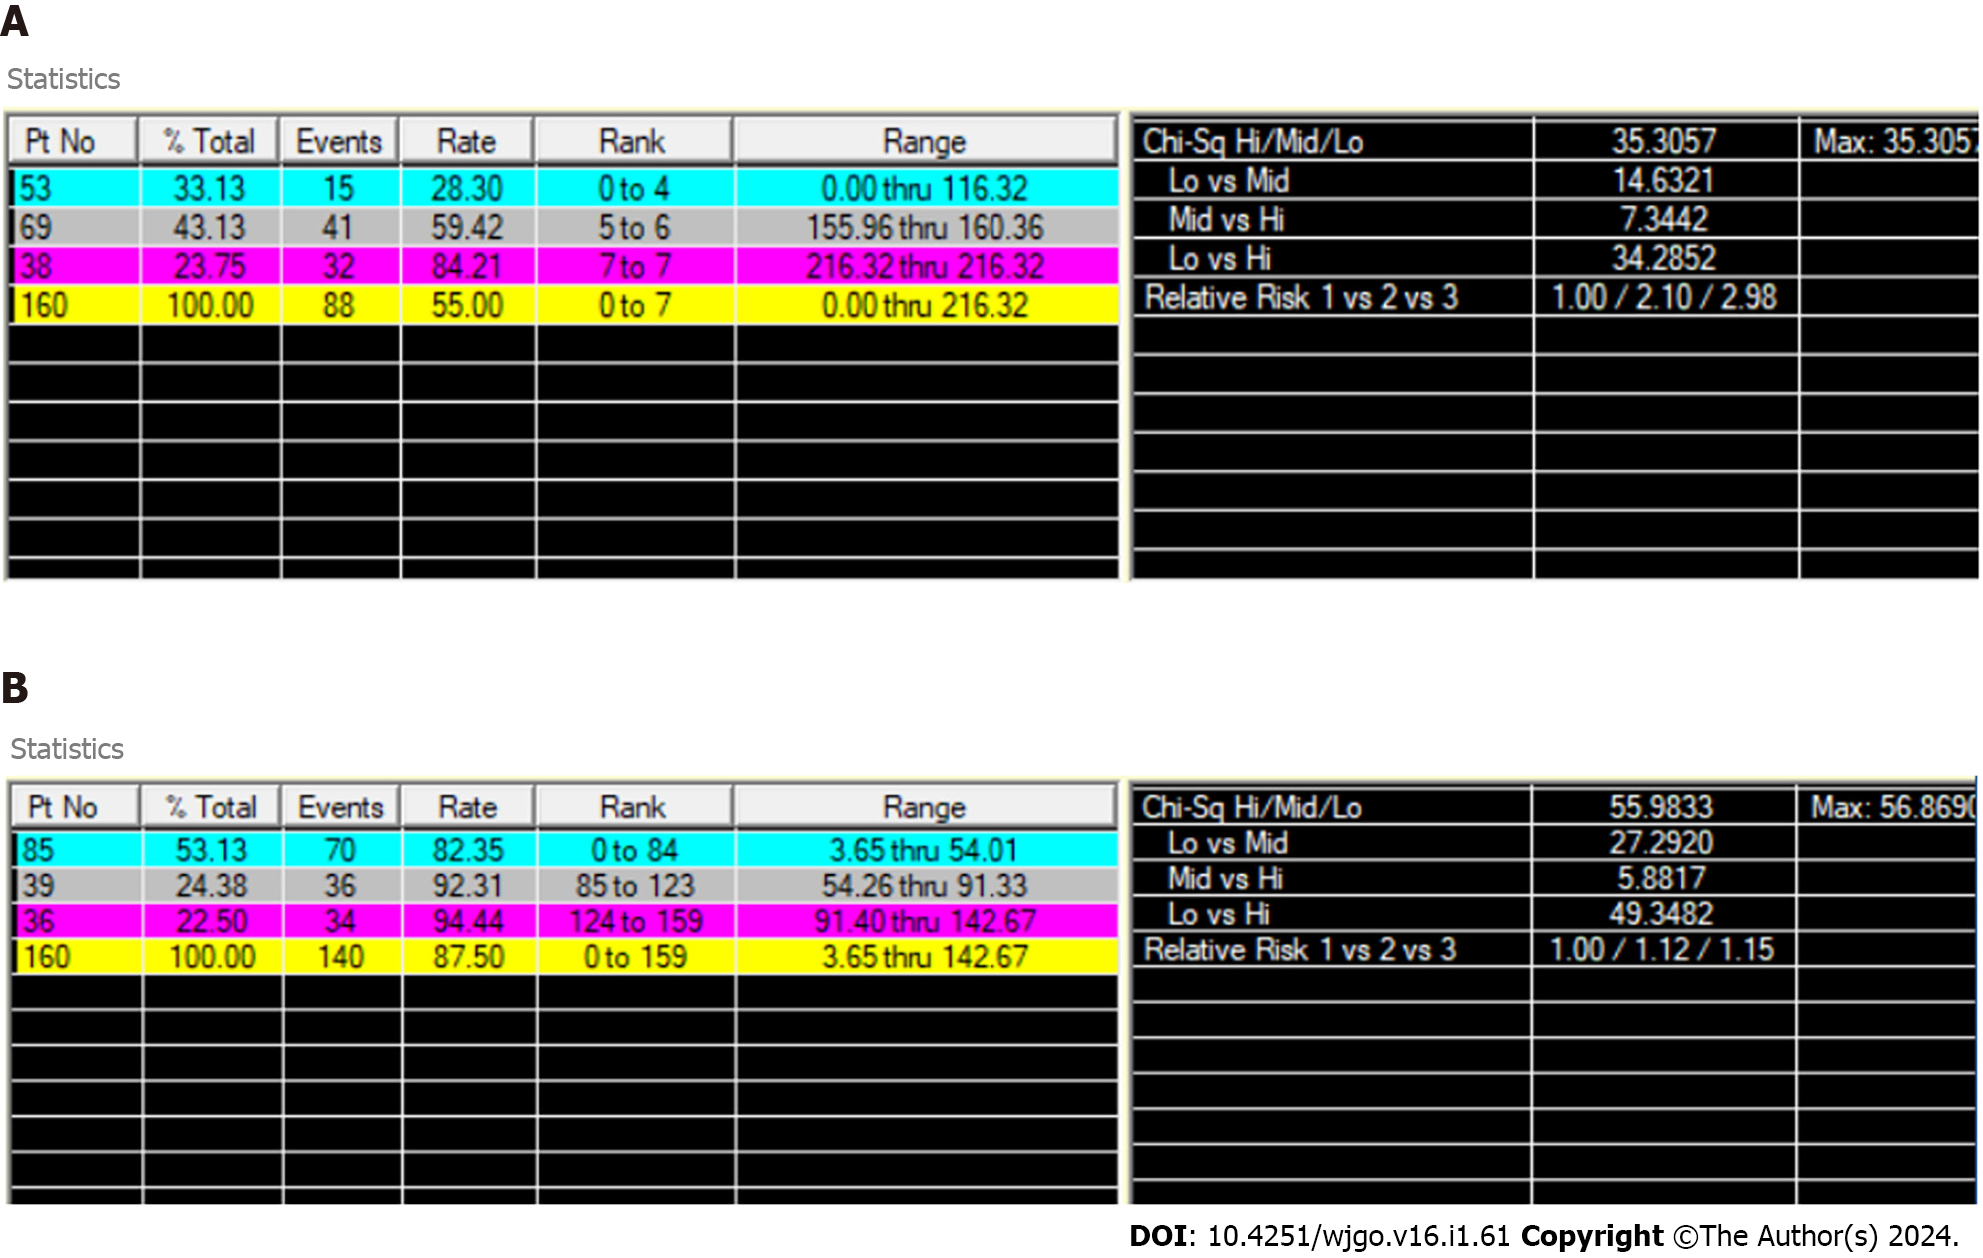
Figure 6 The X-tile software is used to determine the cut-off value of the risk score.
A: The cut-off value of the overall survival nomogram risk score; B: The cut-off value of the progression-free survival nomogram risk score.
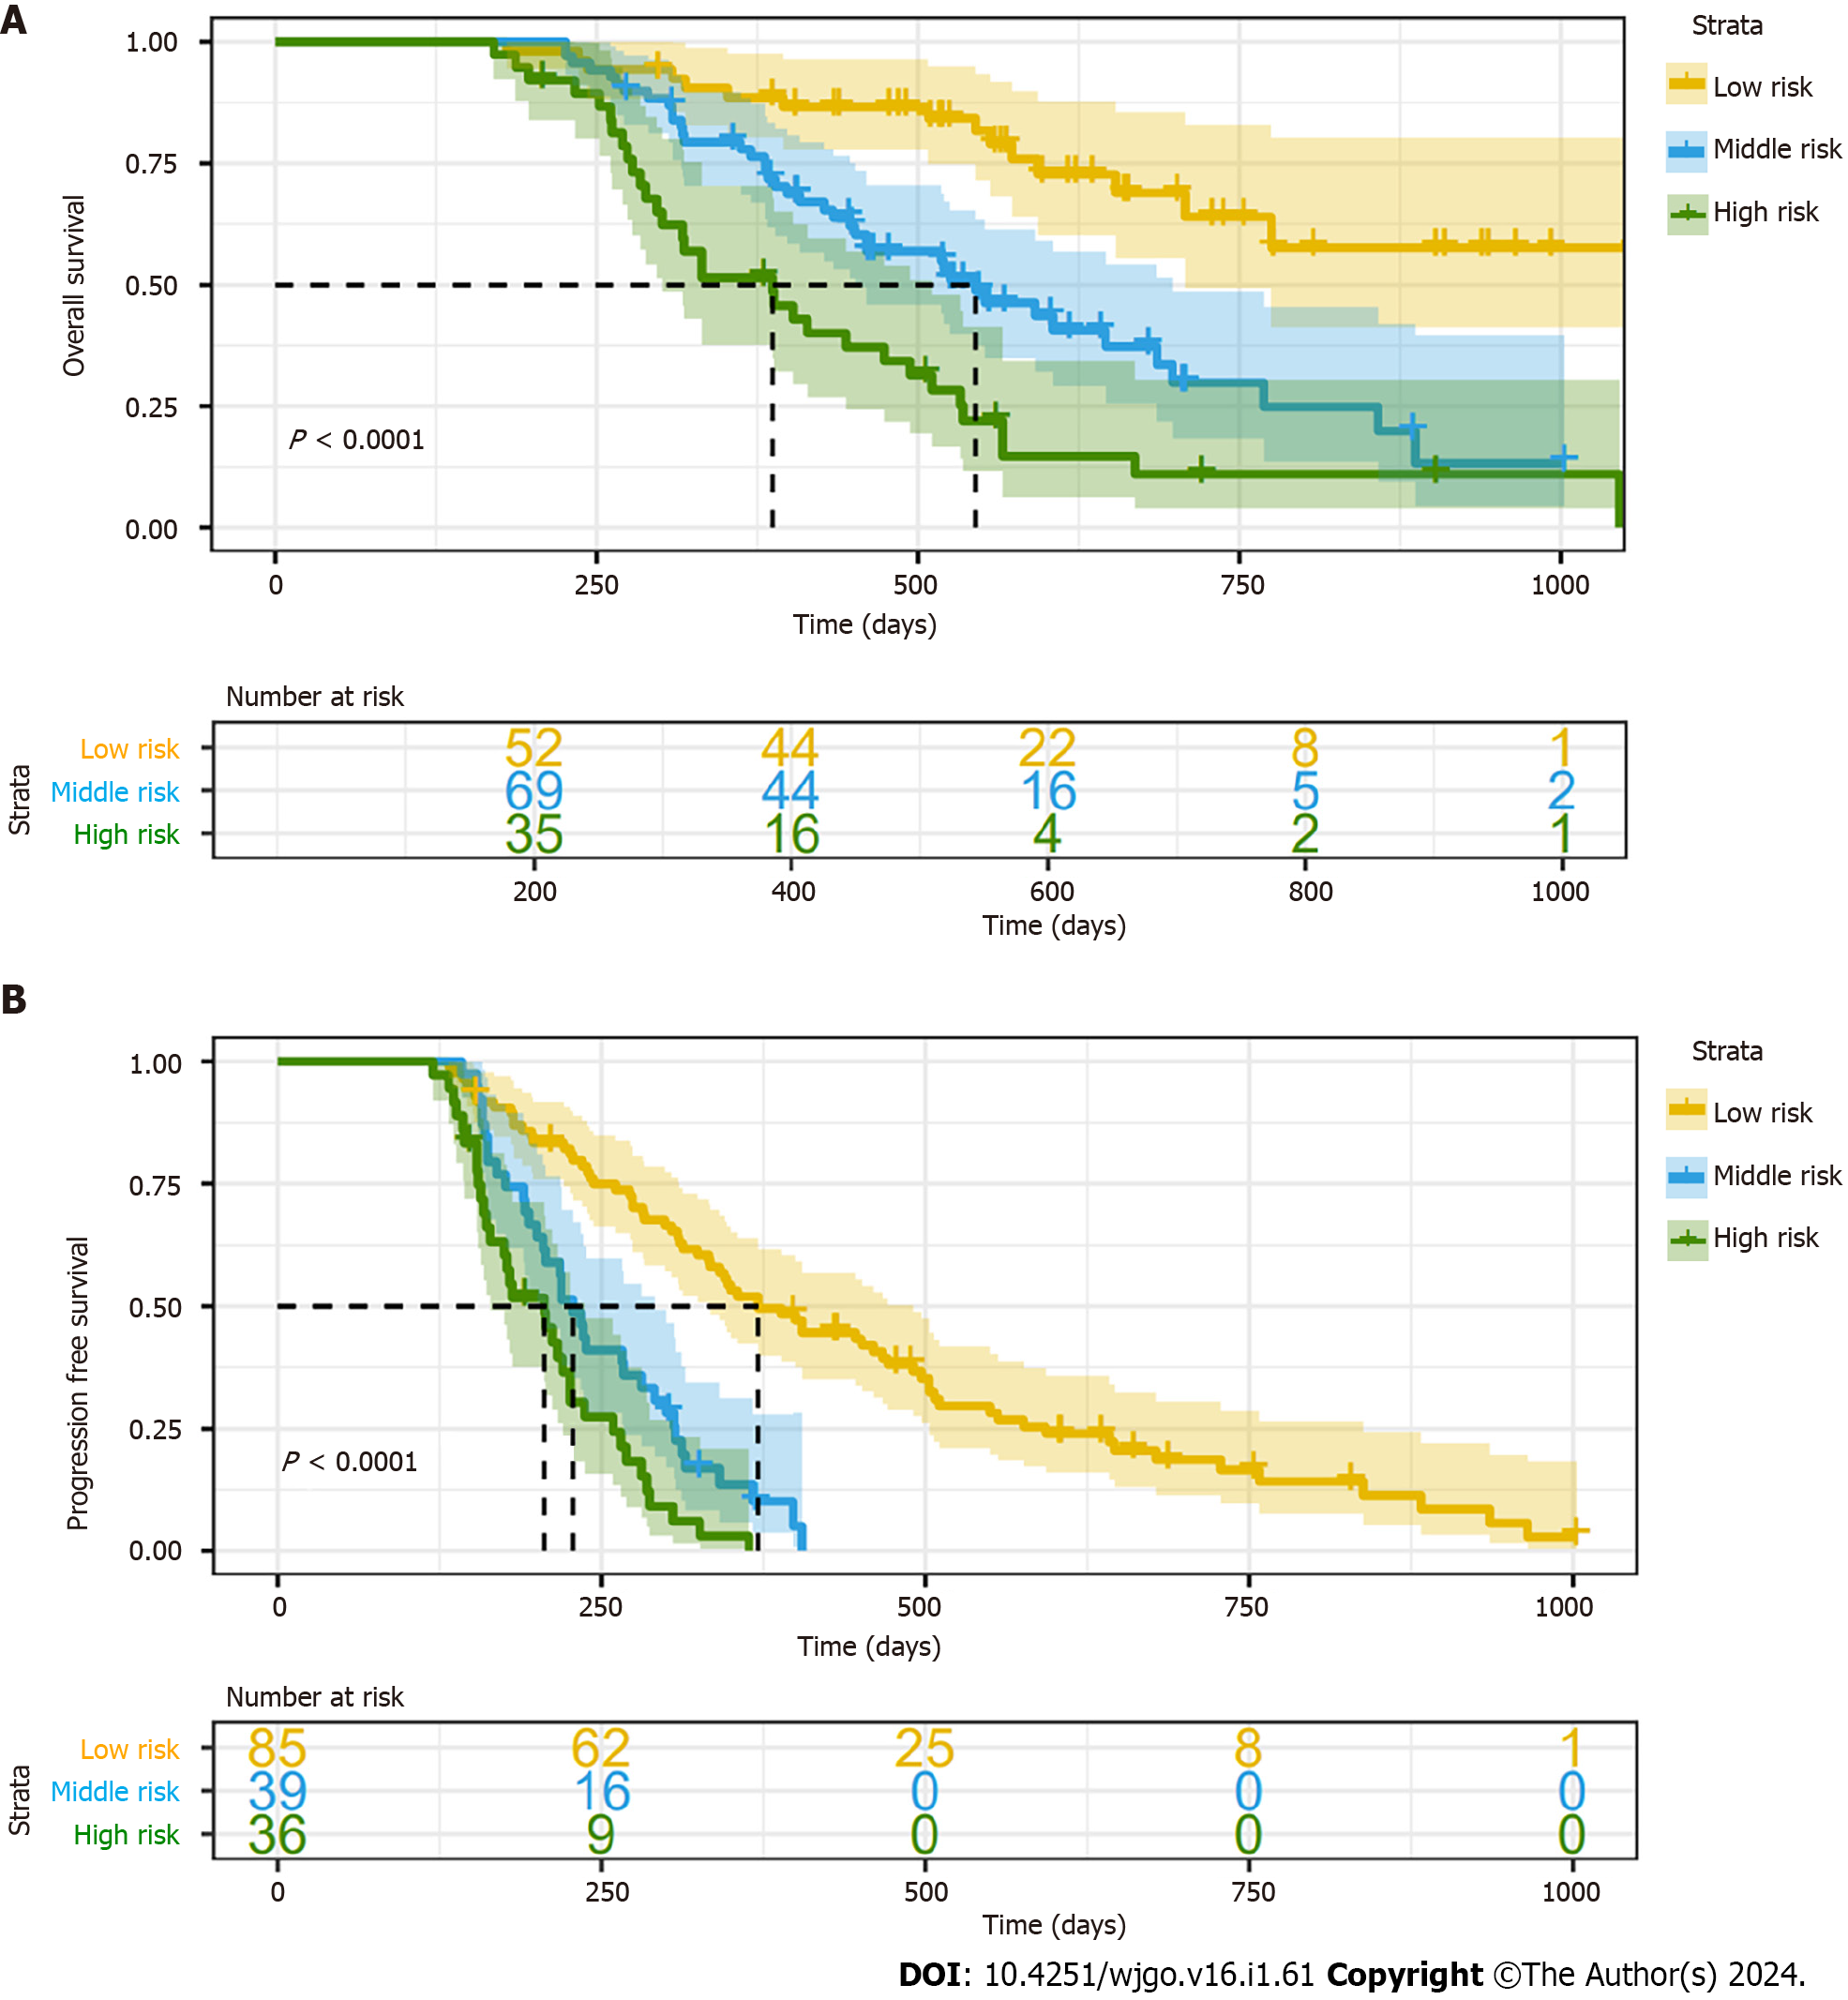
Figure 7 Kaplan-Meier curves for risk classification system based on nomogram.
A: Risk classification system of overall survival nomogram; B: Risk classification system of progression-free survival nomogram.
- Citation: Li BB, Chen LJ, Lu SL, Lei B, Yu GL, Yu SP. C-reactive protein to albumin ratio predict responses to programmed cell death-1 inhibitors in hepatocellular carcinoma patients. World J Gastrointest Oncol 2024; 16(1): 61-78
- URL: https://www.wjgnet.com/1948-5204/full/v16/i1/61.htm
- DOI: https://dx.doi.org/10.4251/wjgo.v16.i1.61


