Copyright
©The Author(s) 2023.
World J Gastrointest Oncol. Sep 15, 2023; 15(9): 1567-1594
Published online Sep 15, 2023. doi: 10.4251/wjgo.v15.i9.1567
Published online Sep 15, 2023. doi: 10.4251/wjgo.v15.i9.1567
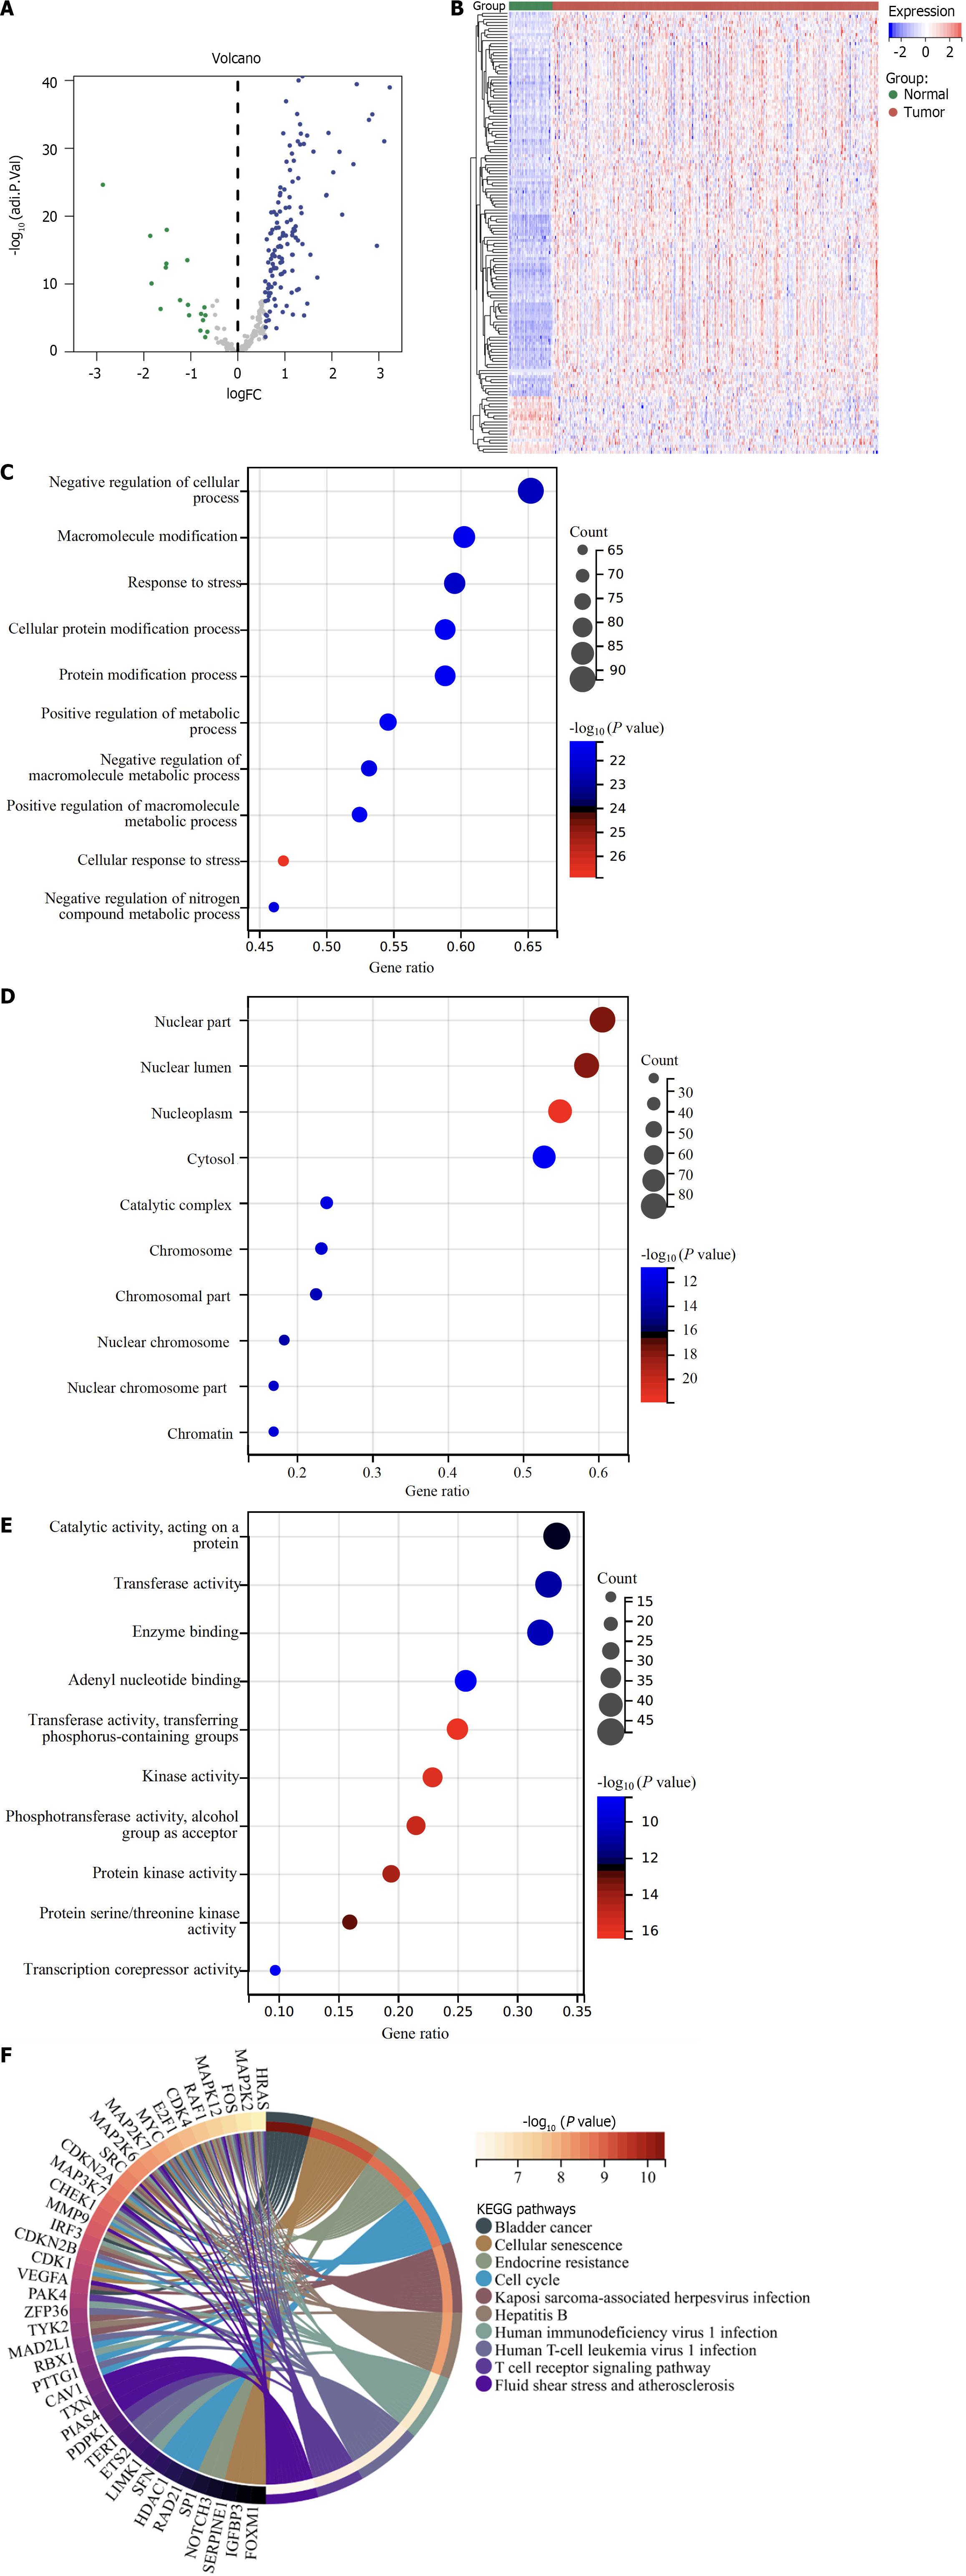
Figure 1 Differentially expressed cellular senescence genes in hepatocellular carcinoma and biological significance.
A: Volcano diagram of the abnormal expression of cellular senescence genes in hepatocellular carcinoma (HCC) relative to normal liver tissues in the TCGA-LIHC dataset. Blue dots denote differentially expressed cellular senescence genes, with grey dots for the not differentially expressed genes; B: Heatmap of the transcript levels of differentially expressed cellular senescence genes in HCC and normal liver tissues; C–E: Bubble diagrams of the top 10 biological process, cellular component, molecular function terms enriched by differentially expressed genes. The bubble size indicates the count of genes enriched. The closer the color is to red, the smaller the adjusted p; F: Circle graph of the Kyoto Encyclopedia of Genes and Genomes pathways enriched by differentially expressed genes.
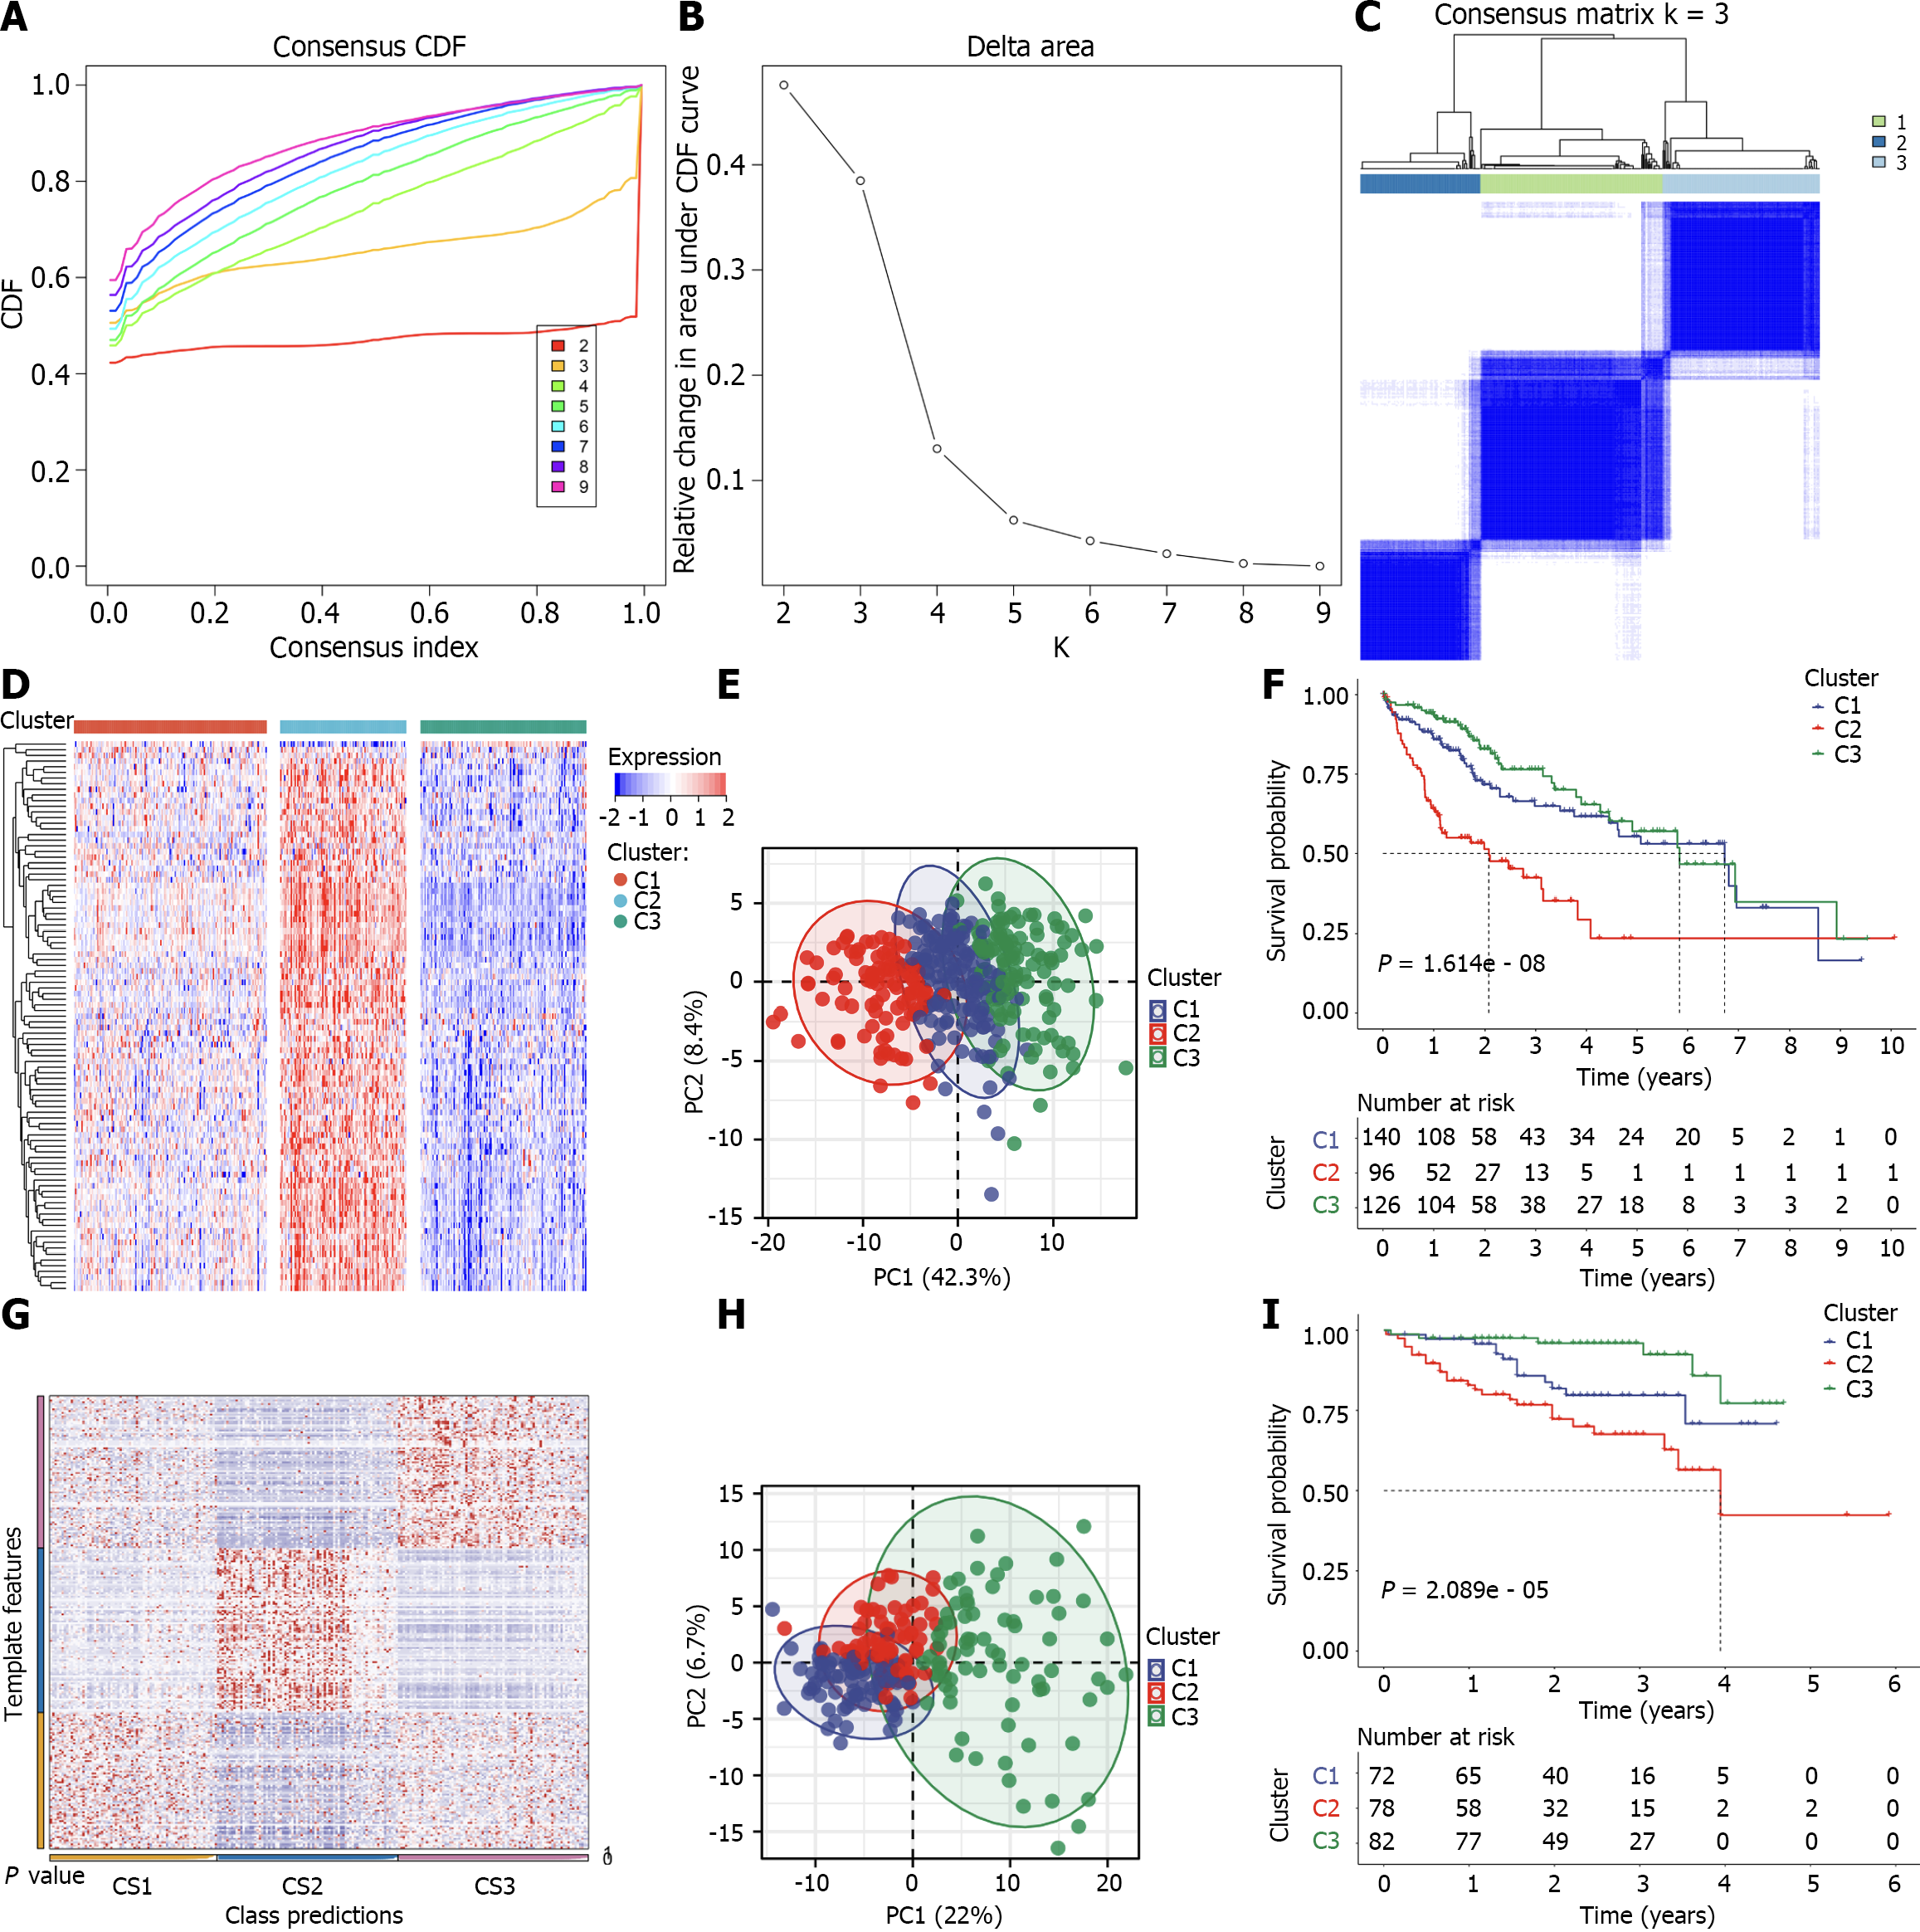
Figure 2 Classification of TCGA-LIHC patients as three cellular senescence subtypes and external dataset validation.
A–C: Consensus cumulative distribution function (CDF), relative alteration in area under CDF curve, and consensus matrix k = 3 based upon the transcriptome of prognostic differentially expressed cellular senescence genes across TCGA-LIHC patients; D: The transcript levels of differentially expressed cellular senescence genes with prognostic implications across three subtypes; E: Principal component analysis (PCA) plots of the discrepancy in transcript levels among subtypes; F: Kaplan–Meier (K-M) curves of overall survival in TCGA-LIHC; G: Nearest template prediction for verifying the subtypes in the International Cancer Genome Consortium (ICGC) cohort; H and I: PCA plots of the transcriptome difference and K-M curves of overall survival among subtypes in the ICGC cohort.
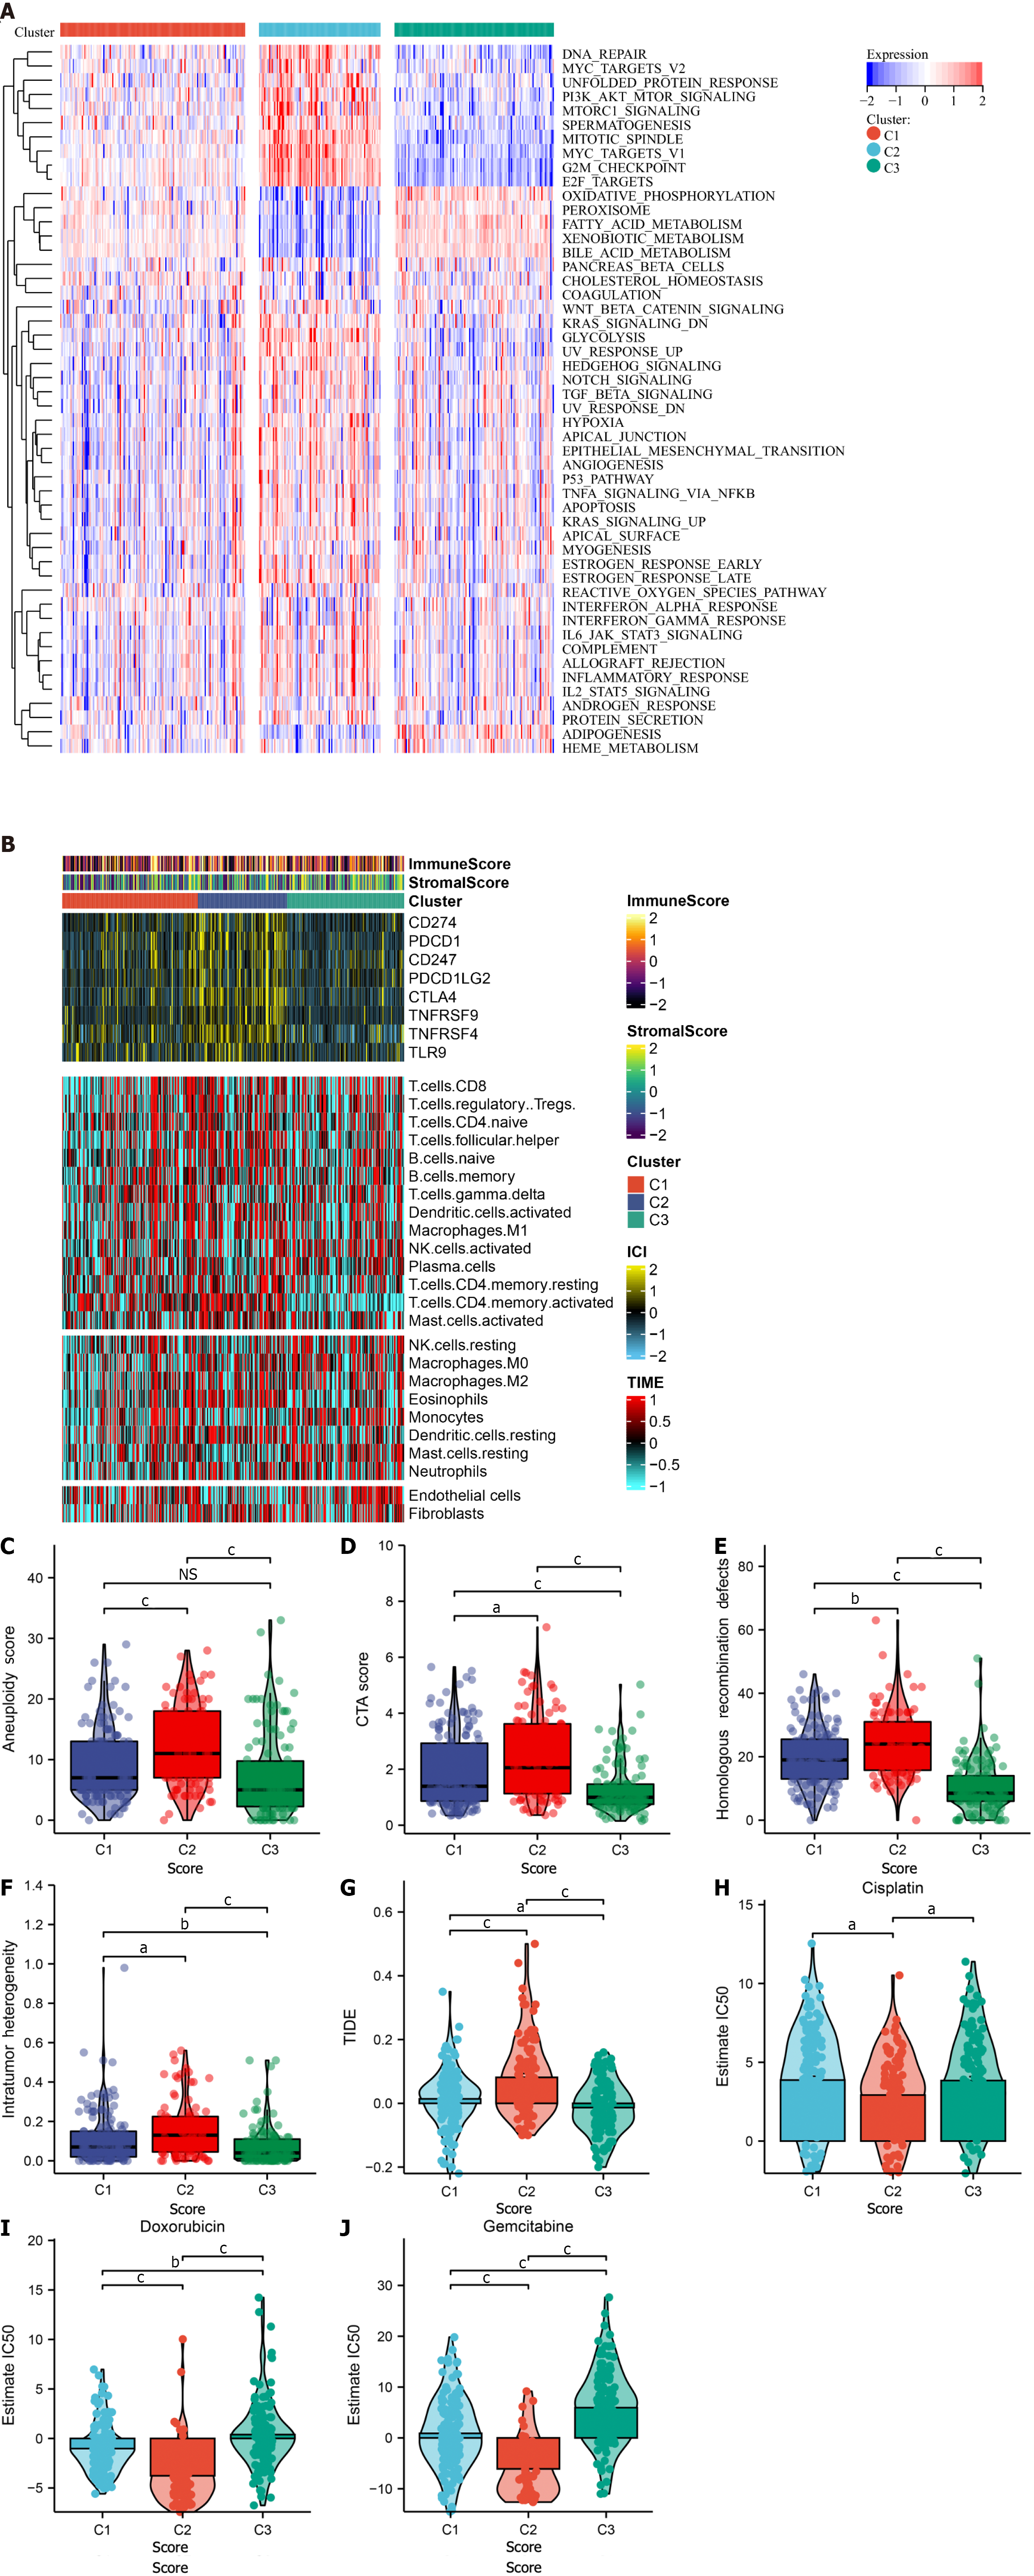
Figure 3 Immunogenomic landscape of three cellular senescence subtypes across TCGA-LIHC.
A: The activity of 50 hallmark pathways in three subtypes; B: Abundance of the tumor microenvironment components, transcript levels of immune checkpoints, and stromal and immune scores across subtypes; C–F: Differences in aneuploidy score, cancer-testicular antigen score, homologous recombination defects, and intratumor heterogeneity between subtypes; G: Difference in TIDE score between subtypes; H–J: Differences in IC50 values of cisplatin, doxorubicin and gemcitabine between subtypes. aP < 0.05; bP < 0.01; cP < 0.001. NS: Not significant; TIDE: Tumor Immune Dysfunction and Exclusion.
Figure 4 Genetic alterations of three cellular senescence subtypes.
A–C: Significant mutated genes in The Cancer Genome Atlas hepatocellular carcinomas stratified by cellular senescence subtypes; D–F: Copy number amplification plots in three subtypes. The green line denotes the significance threshold (q = 0.25); G–I: Copy number deletion plots in three subtypes.
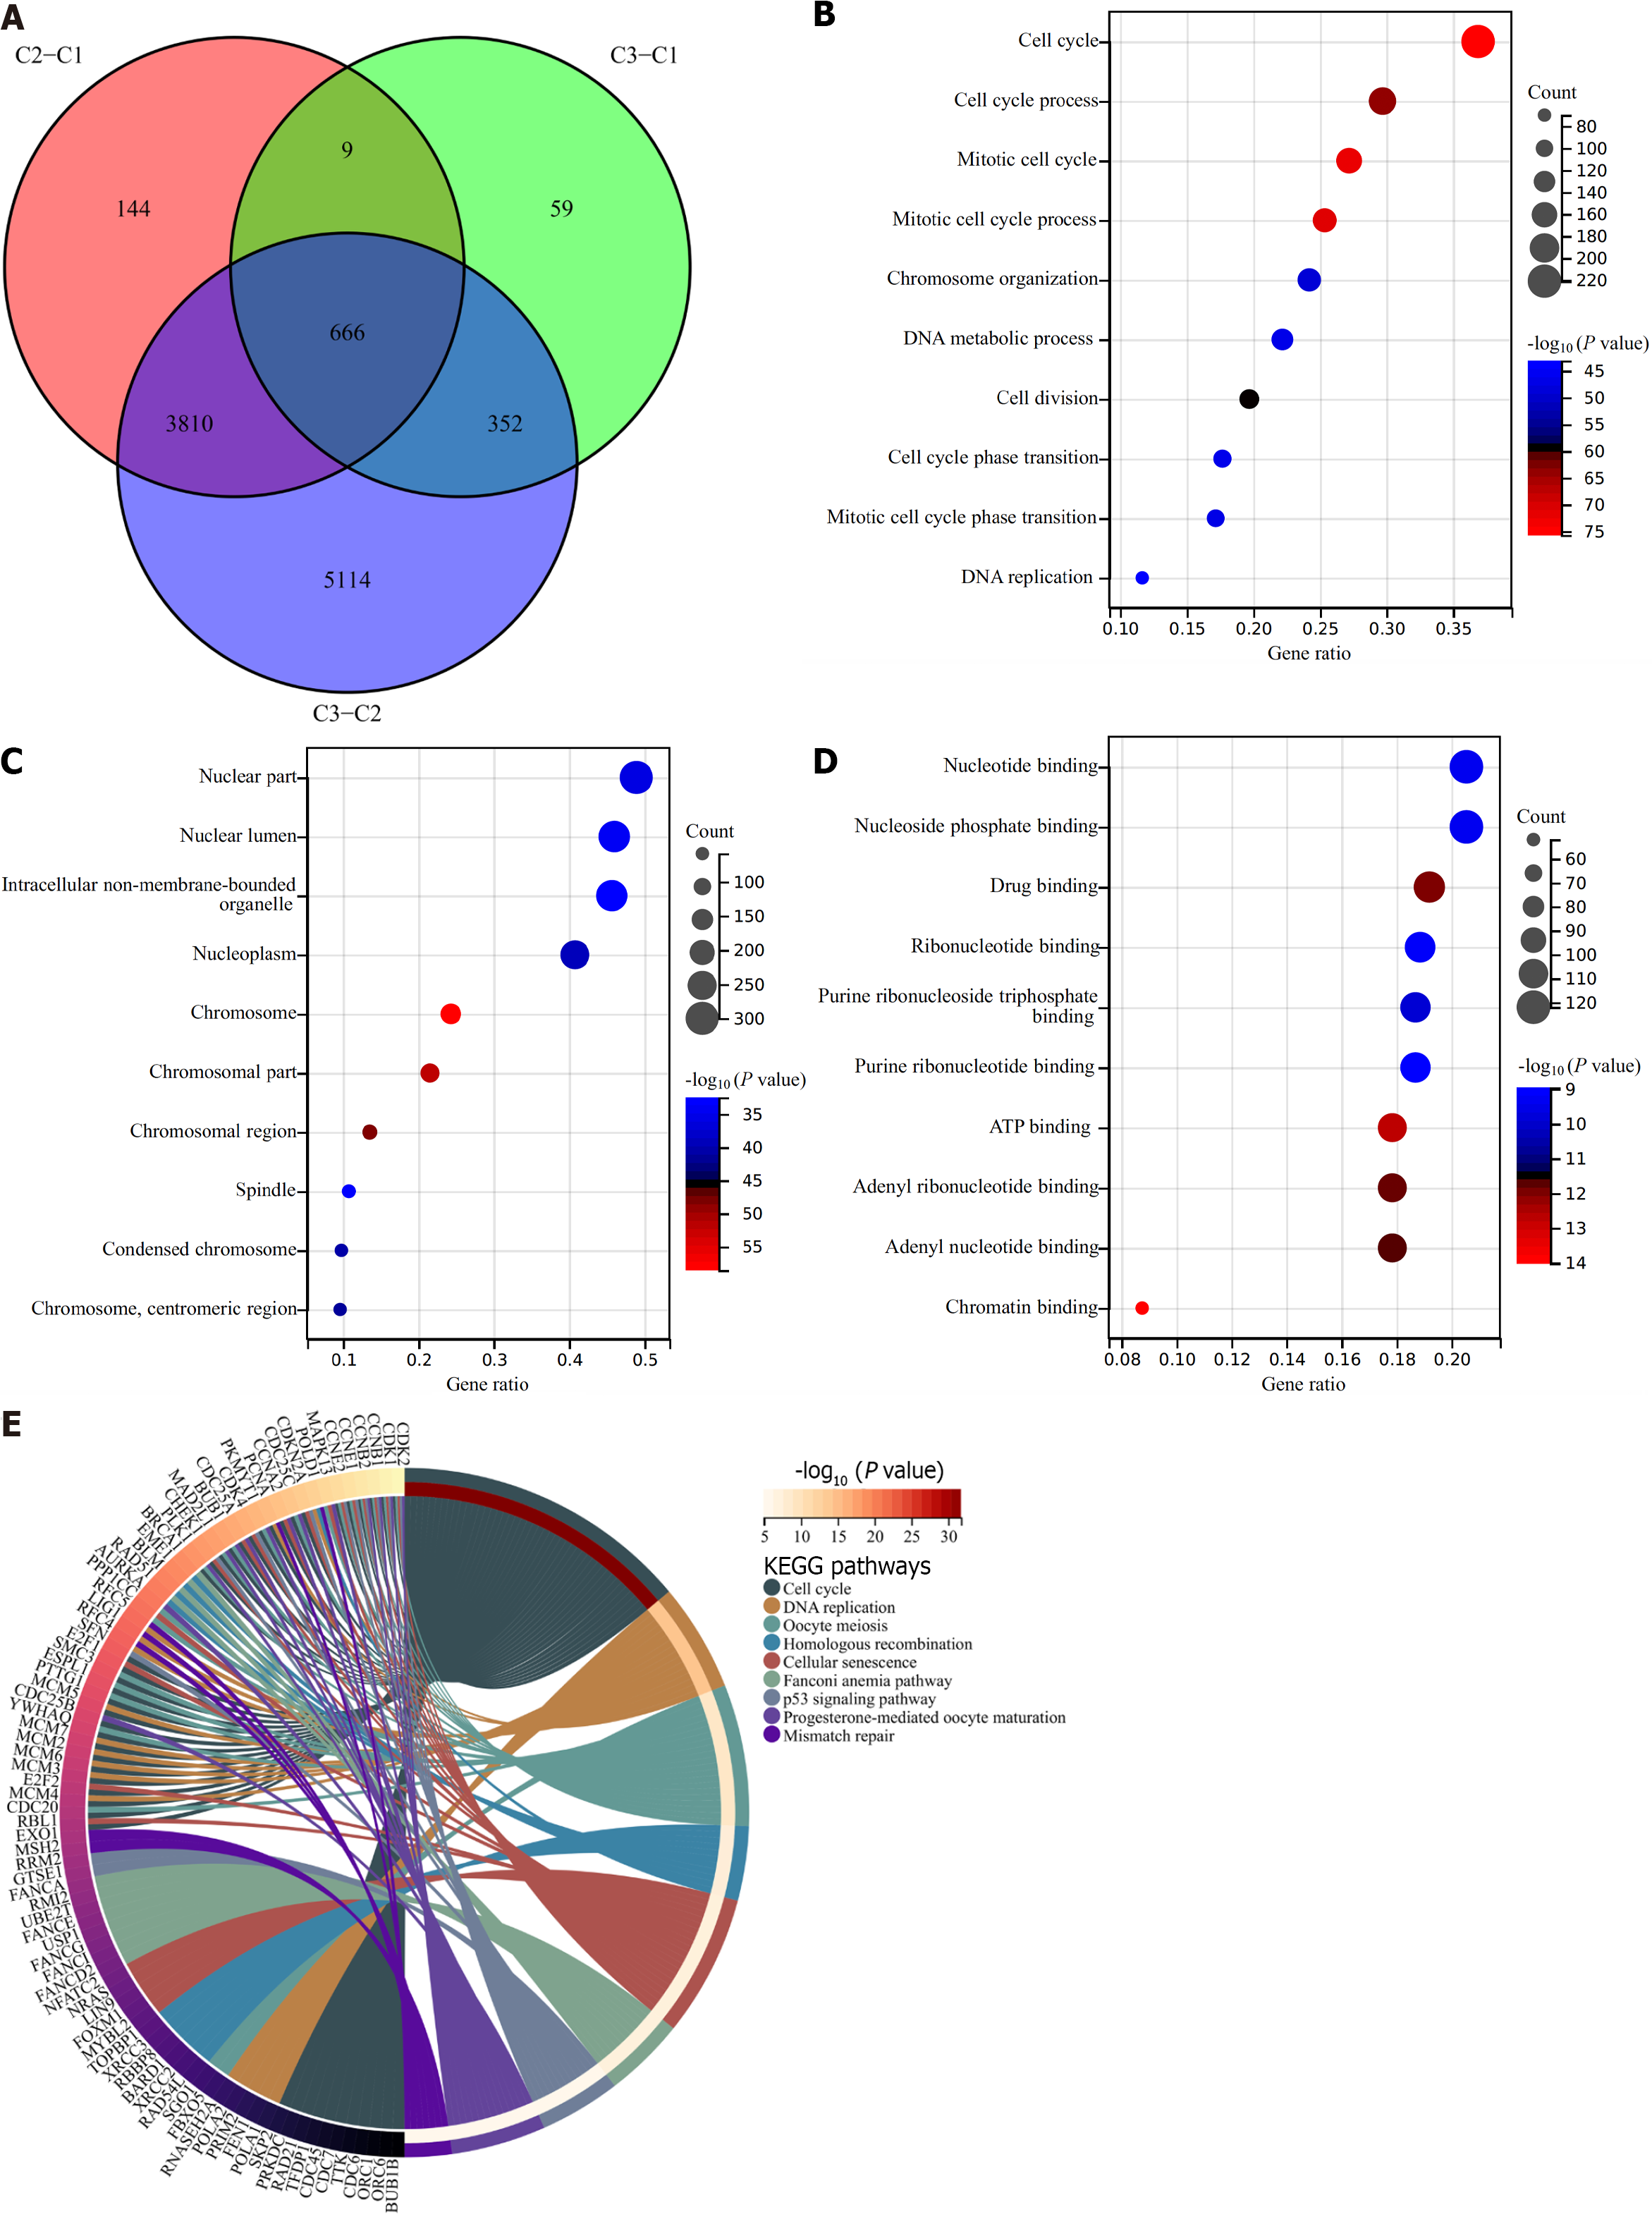
Figure 5 Identification of cellular senescence subtype-relevant genes and functional implications.
A: Venn diagram of the intersected genes from differentially expressed genes between cellular senescence subtypes in TCGA-LIHC cohort; B–D: The top 10 biological processes, cellular components, together with molecular functions of cellular senescence subtype-relevant genes; E: Kyoto Encyclopedia of Genes and Genomes pathways significantly enriched by these genes.
Figure 6 Definition and external verification of a cellular-senescence-relevant gene signature.
A: Cross-validation for tuning the parameter selection in the least absolute shrinkage and selection operator (LASSO) analysis in TCGA-LIHC dataset; B: LASSO coefficient profiling; C: Distribution of RiskScore, survival status, and transcript levels of genes in the signature; D: Kaplan–Meier (curves of overall survival in low- and high-RiskScore hepatocellular carcinomas; E: Receiver operator characteristic curves (ROCs) at 1-, 3- and 5-year survival; F: External verification of distribution of RiskScore, survival status, and transcript levels of genes in the International Cancer Genome Consortium (ICGC) dataset; G: Kaplan–Meier curves of overall survival in two groups in the ICGC dataset; H: ROCs at 1- and 3-year survival based upon RiskScore in the ICGC dataset; I: External validation of distribution of RiskScore, survival status, and transcript levels of genes in the GSE14520 dataset; J: Kaplan–Meier curves of overall survival in two groups in the GSE14520 dataset; K: ROCs at 1- and 3-year survival in the GSE14520 dataset.
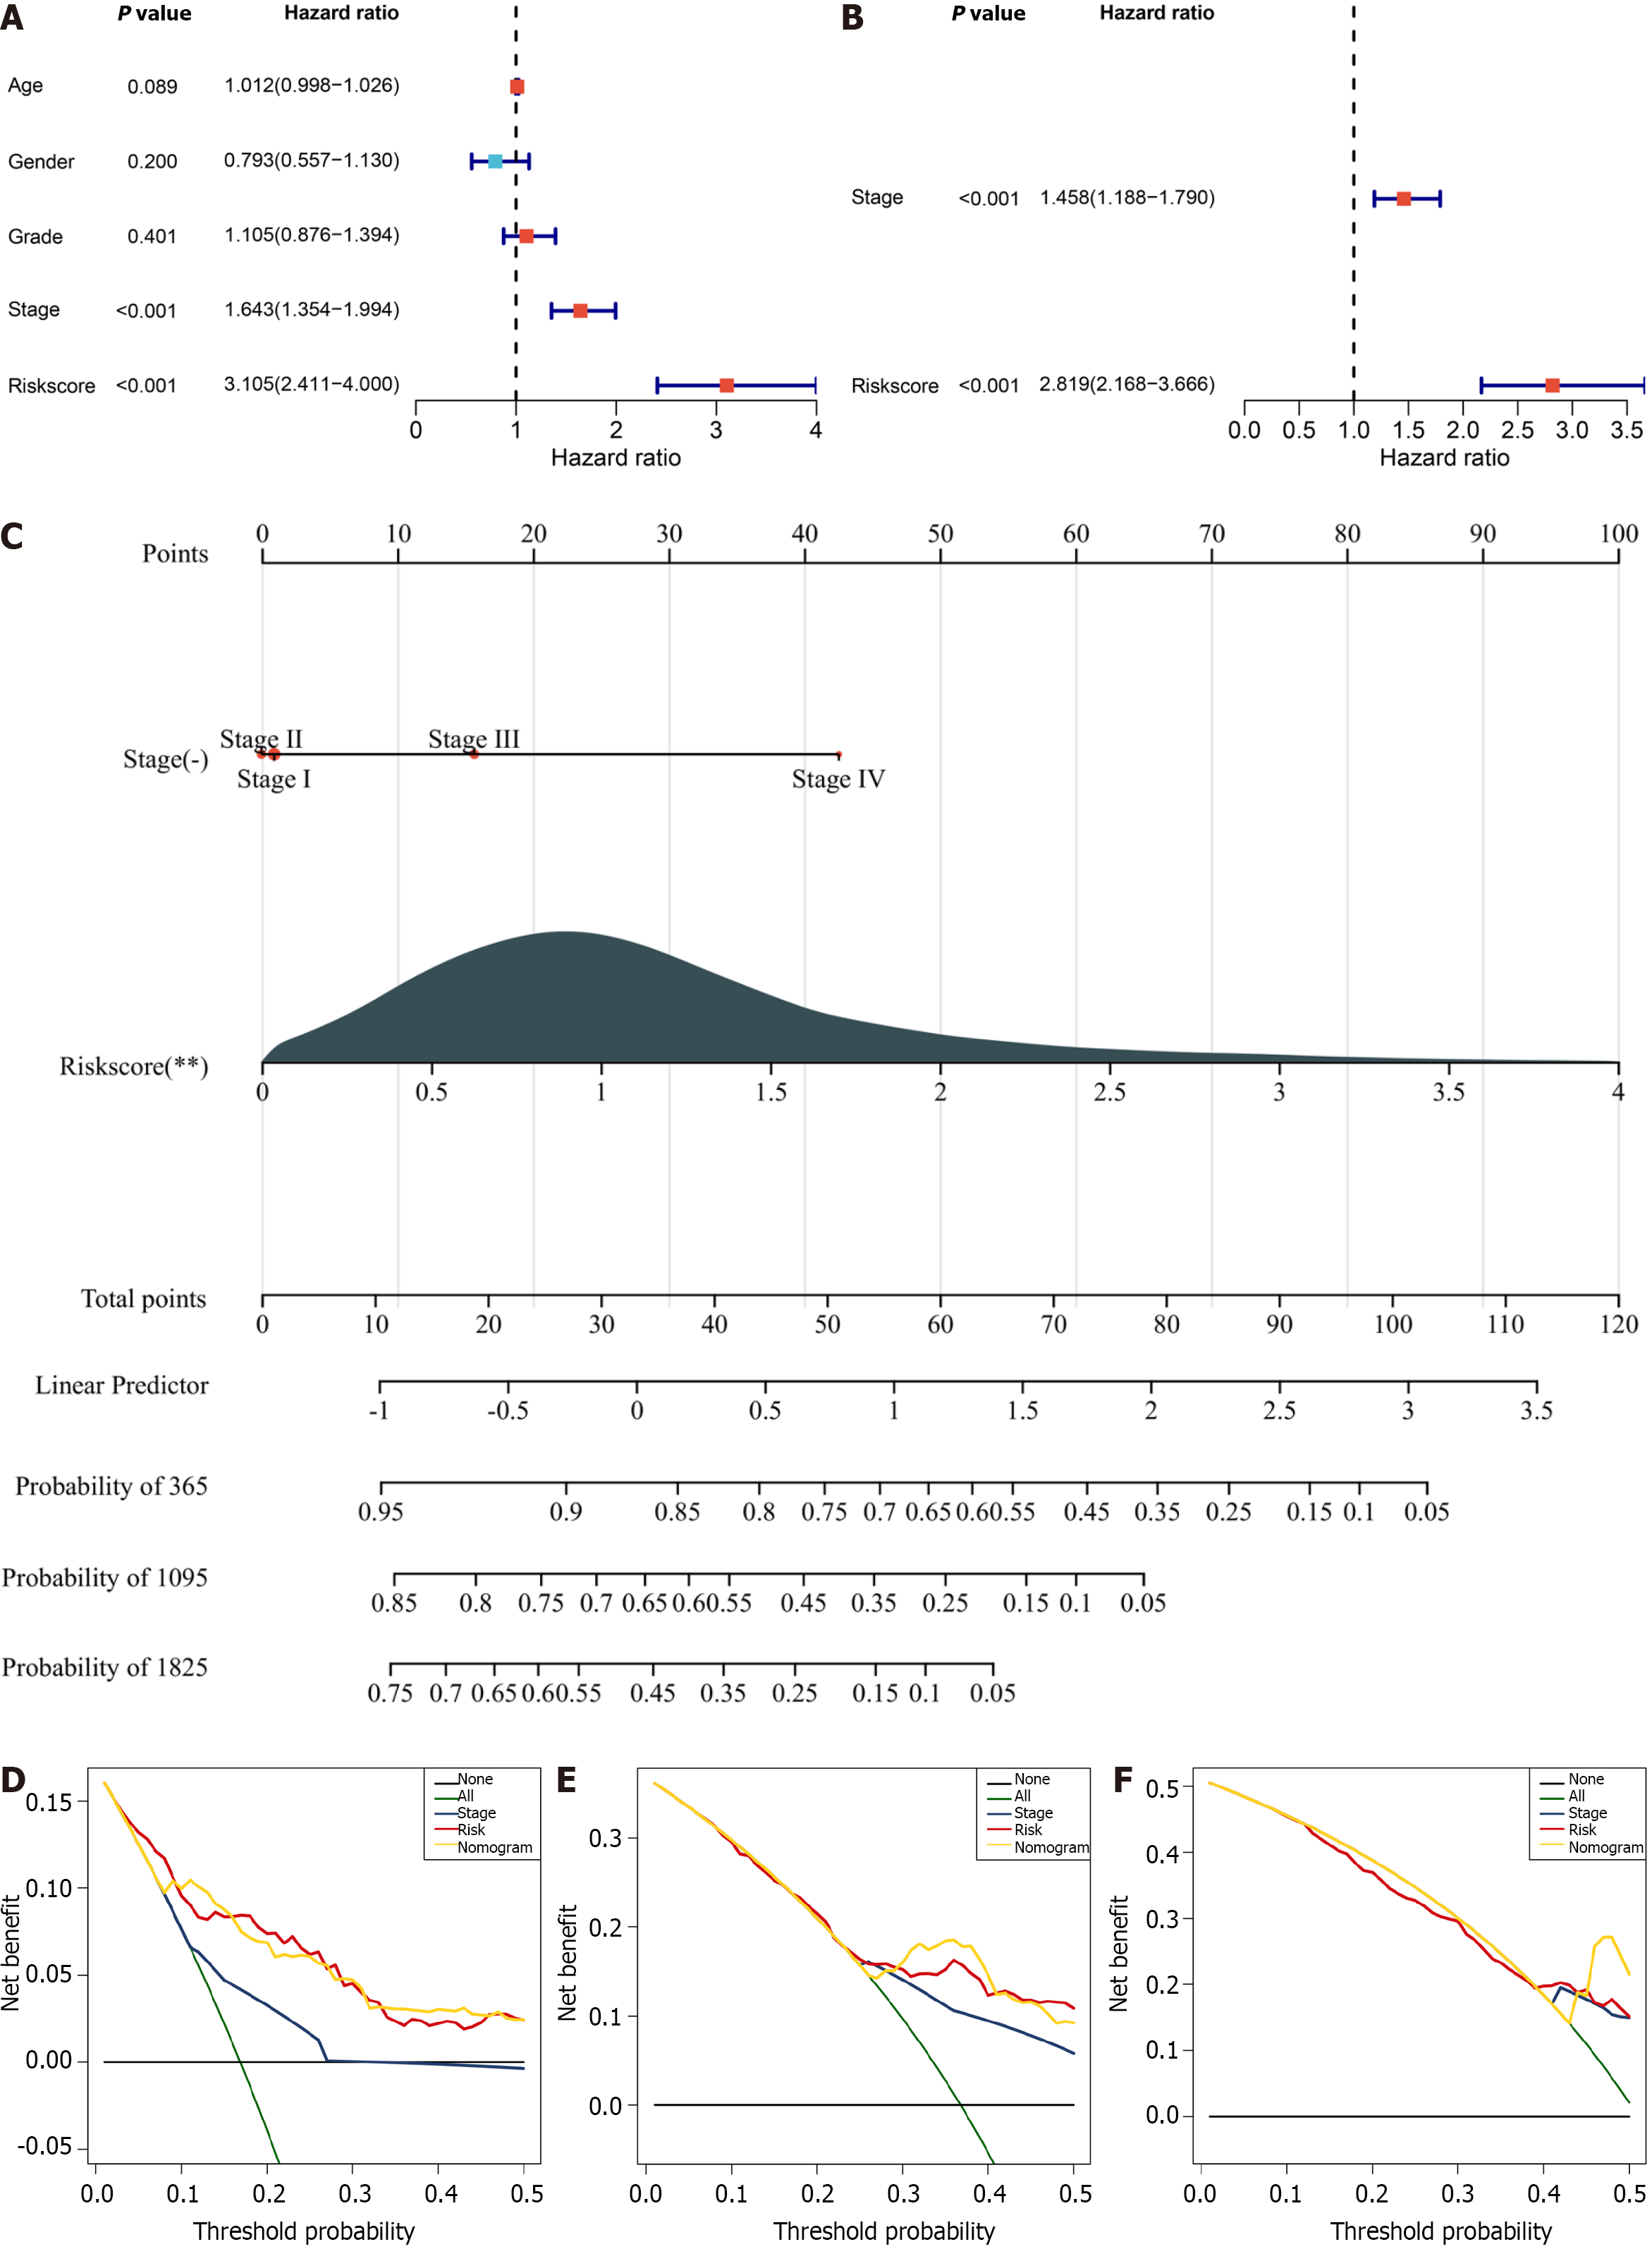
Figure 7 Establishment of a prognostic nomogram for clinical practice in the TCGA-LIHC dataset.
A: Univariate-cox regression results of the cellular-senescence-relevant gene signature and conventional clinicopathological parameters with hepatocellular carcinoma prognosis; B: Multivariate Cox regression for selecting independent prognostic parameters; C: Generation of a nomogram based on stage and the cellular senescence-relevant RiskScore; D–F: Decision curve analysis at 1-, 1-, and 5-year survival.
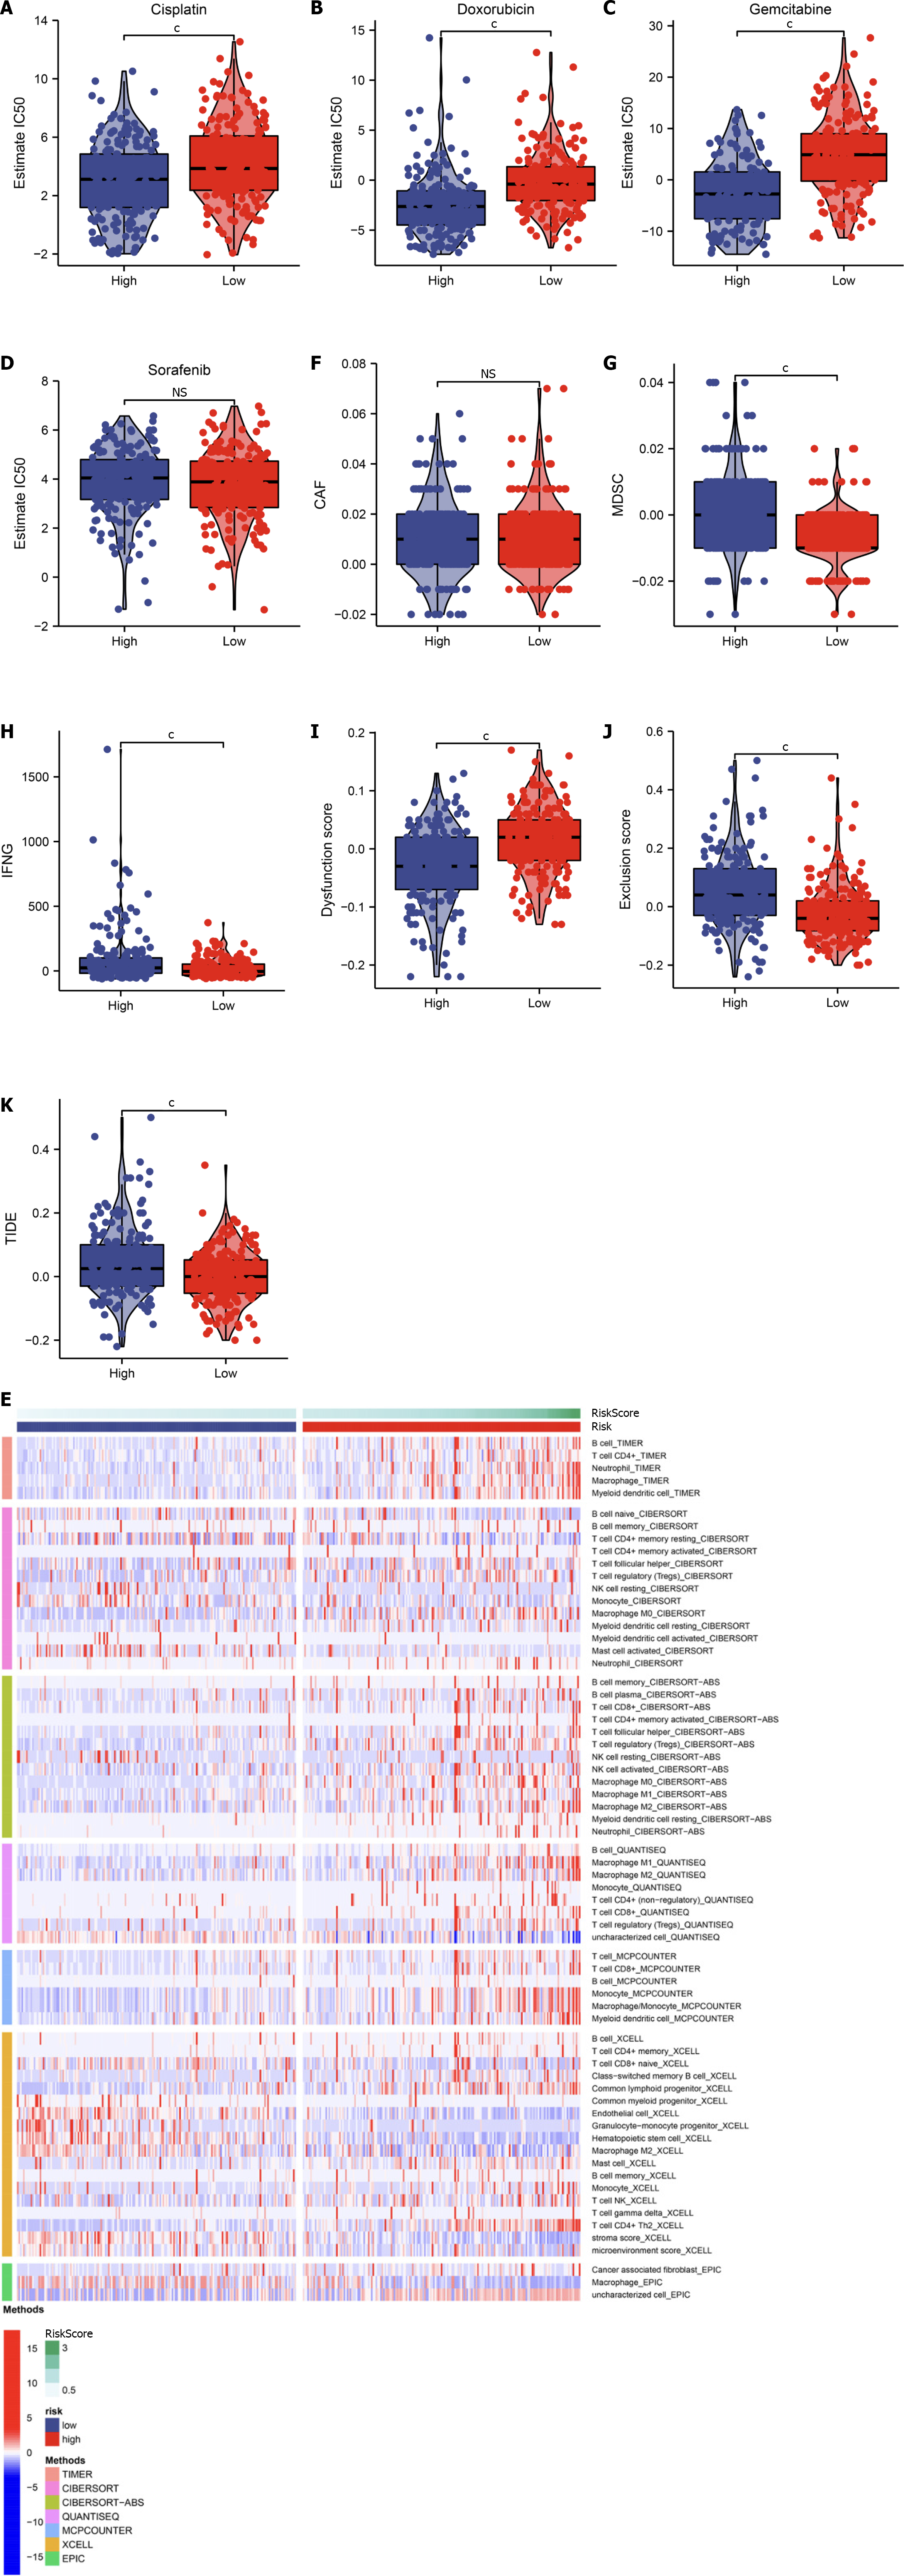
Figure 8 Assessment of the cellular senescence-relevant gene signature in predicting efficacy of pharmacological interventions in TCGA-LIHC dataset.
A–D: IC50 value of cisplatin, doxorubicin, gemcitabine, and sorafenib in low- and high-RiskScore hepatocellular carcinomas (HCCs); E: Abundance of the tumor microenvironment components inferred by multiple algorithms; F–K: Comparison of carcinoma-associated fibroblast (CAF), myeloid-derived suppressor cell (MDSC), interferon gamma (IFNG), dysfunction score, exclusion score and Tumor Immune Dysfunction and Exclusion levels in low- and high-RiskScore HCCs. cP < 0.001. ns: No significant difference.
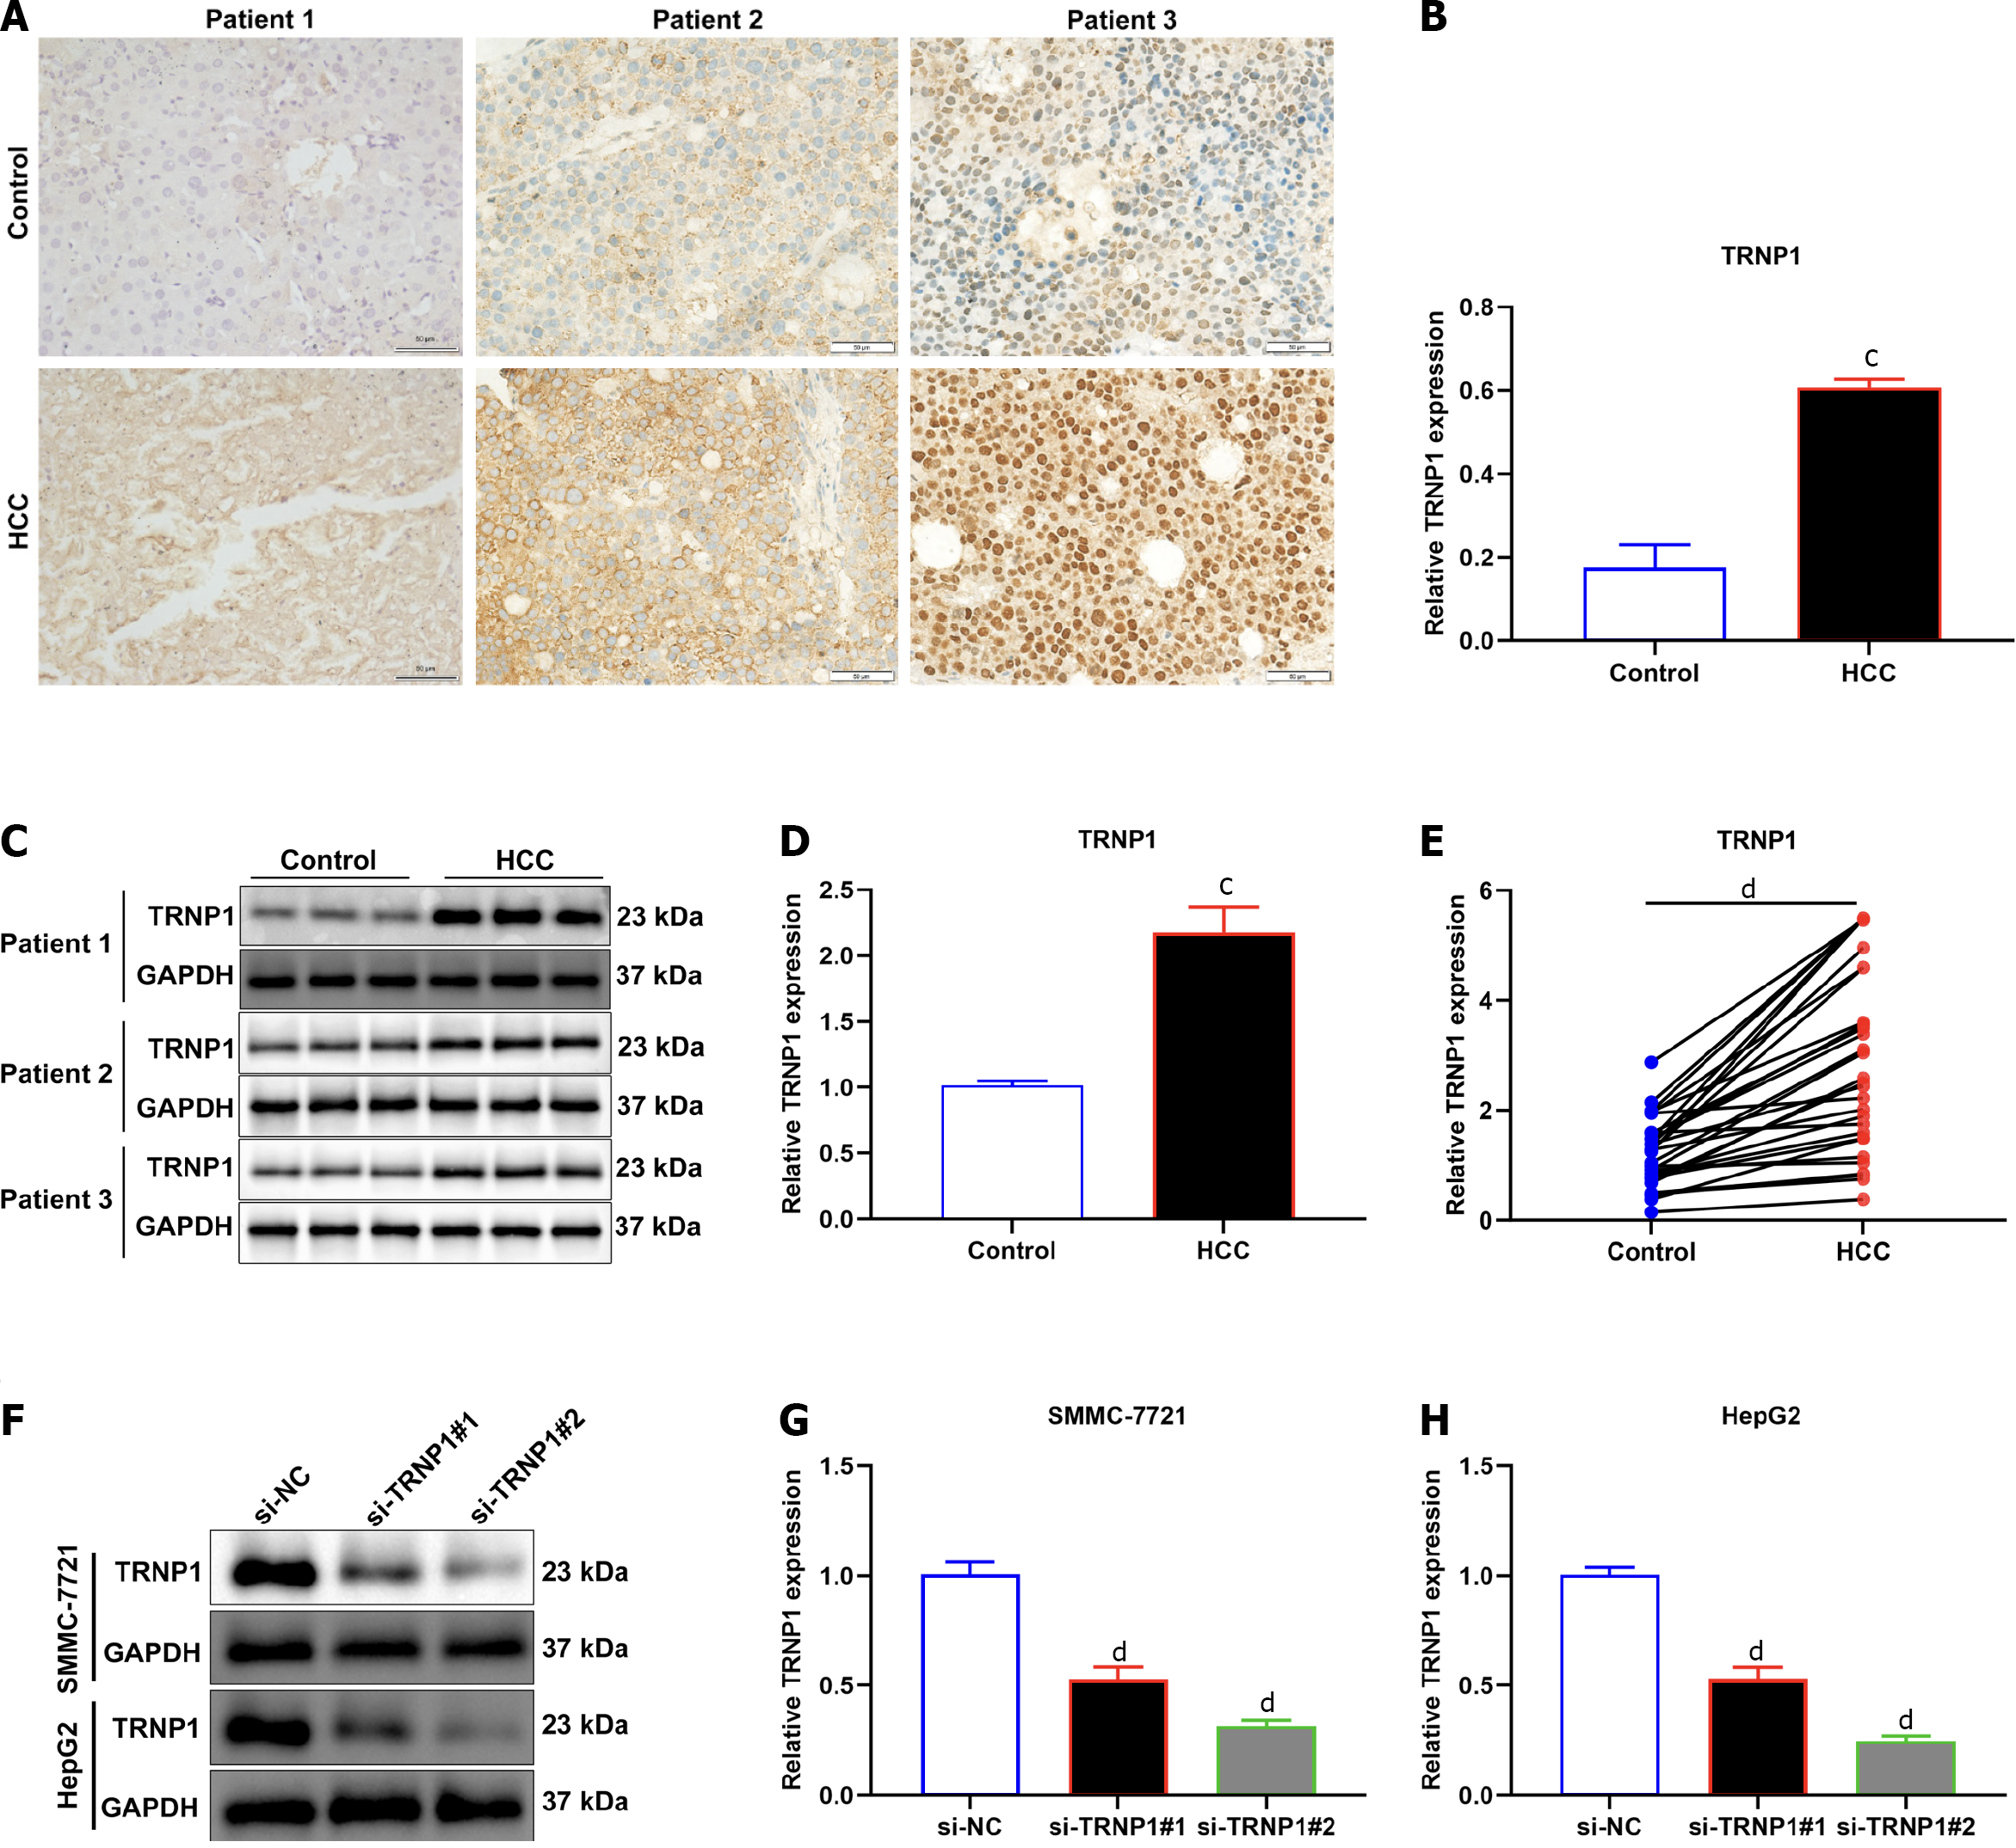
Figure 9 Experimental verification of expression of TRNP1 in hepatocellular carcinomas.
A and B: Representative immunohistochemistry of TRNP1 expression in human hepatocellular carcinomas (HCCs) and normal tissues. Bar, 50 μm; C and D: Representative immunoblotting of TRNP1 expression in human HCCs and normal tissues; E: Quantitative real-time polymerase chain reaction of TRNP1 expression in 30 pairs of human HCCs and normal tissues; F–H: Immunoblotting of TRNP1 expression in SMMC-7721 and HepG2 cells transfected with specific siRNAs of TRNP1. cP < 0.001; dP < 0.0001.
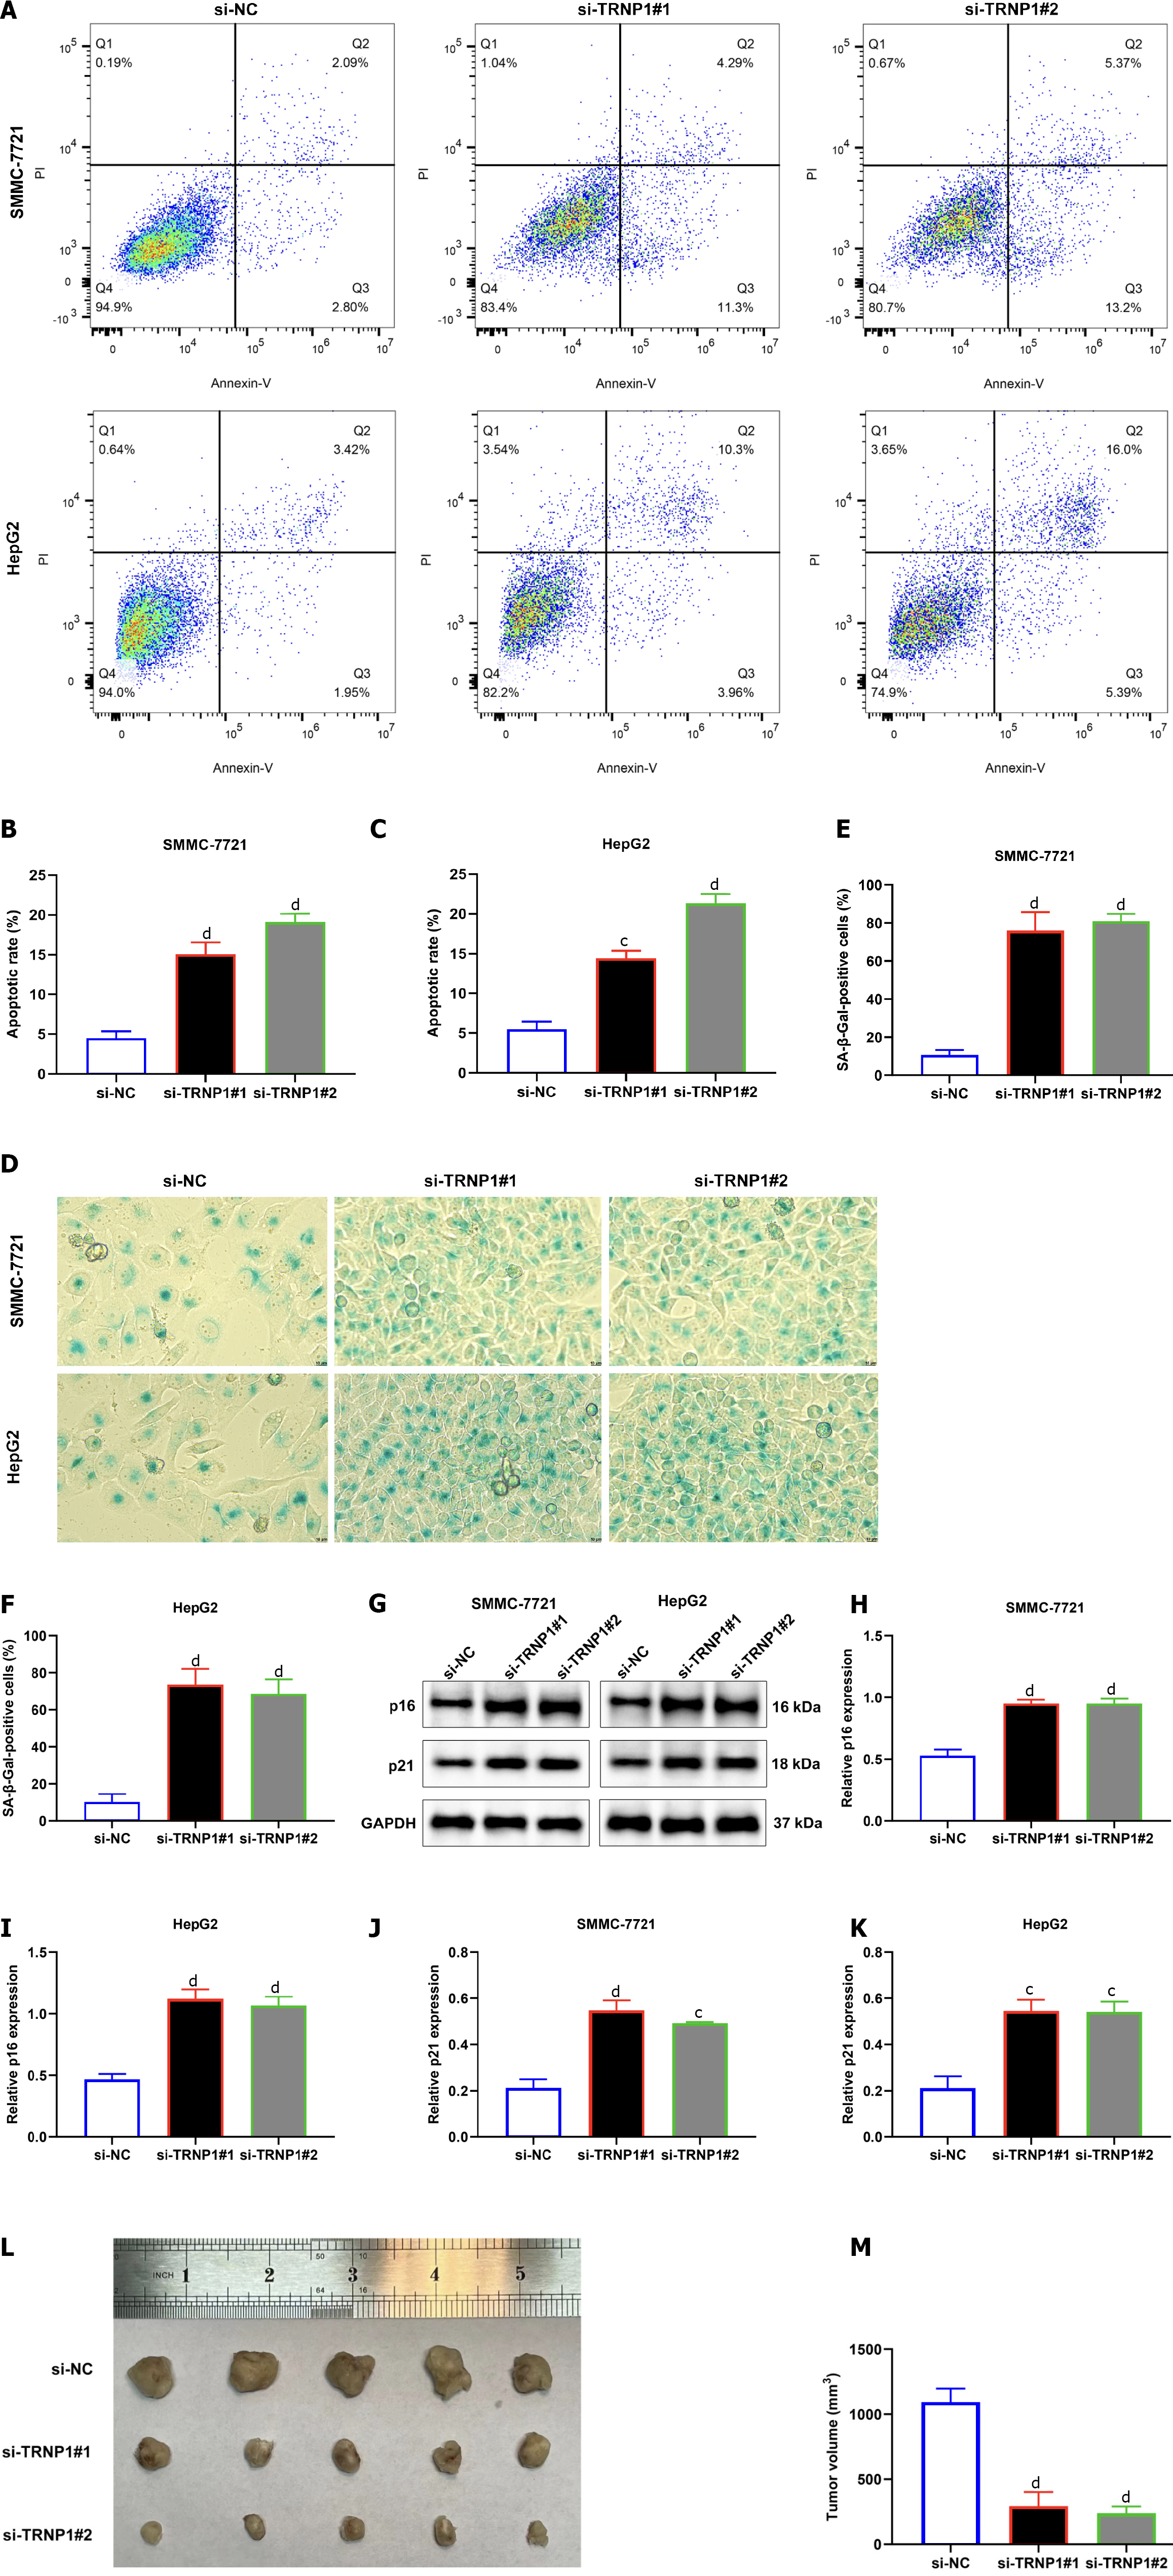
Figure 10 Suppression of TRNP1 induces apoptosis and senescence of hepatocellular carcinoma cells and attenuates tumor growth.
A–C: Flow cytometry for measuring the apoptotic rate of in SMMC-7721 and HepG2 cells with transfection of specific siRNAs of TRNP1; D-F: SA-β-galactosidase (SA-β-Gal) staining for evaluating senescence of transfected hepatocellular carcinoma cells. Bar, 10 μm; G–K: Immunoblotting of p16 and p21 expression in transfected cells; L: Representative photographs of tumors from mice of si-NC, si-TRNP1#1 and si-TRNP1#2 groups; M: Calculation of tumor volume in above groups. cP < 0.001; dP < 0.0001.
- Citation: Wang HH, Chen WL, Cui YY, Gong HH, Li H. Cellular senescence throws new insights into patient classification and pharmacological interventions for clinical management of hepatocellular carcinoma. World J Gastrointest Oncol 2023; 15(9): 1567-1594
- URL: https://www.wjgnet.com/1948-5204/full/v15/i9/1567.htm
- DOI: https://dx.doi.org/10.4251/wjgo.v15.i9.1567


