Copyright
©The Author(s) 2023.
World J Gastrointest Oncol. Jul 15, 2023; 15(7): 1215-1226
Published online Jul 15, 2023. doi: 10.4251/wjgo.v15.i7.1215
Published online Jul 15, 2023. doi: 10.4251/wjgo.v15.i7.1215
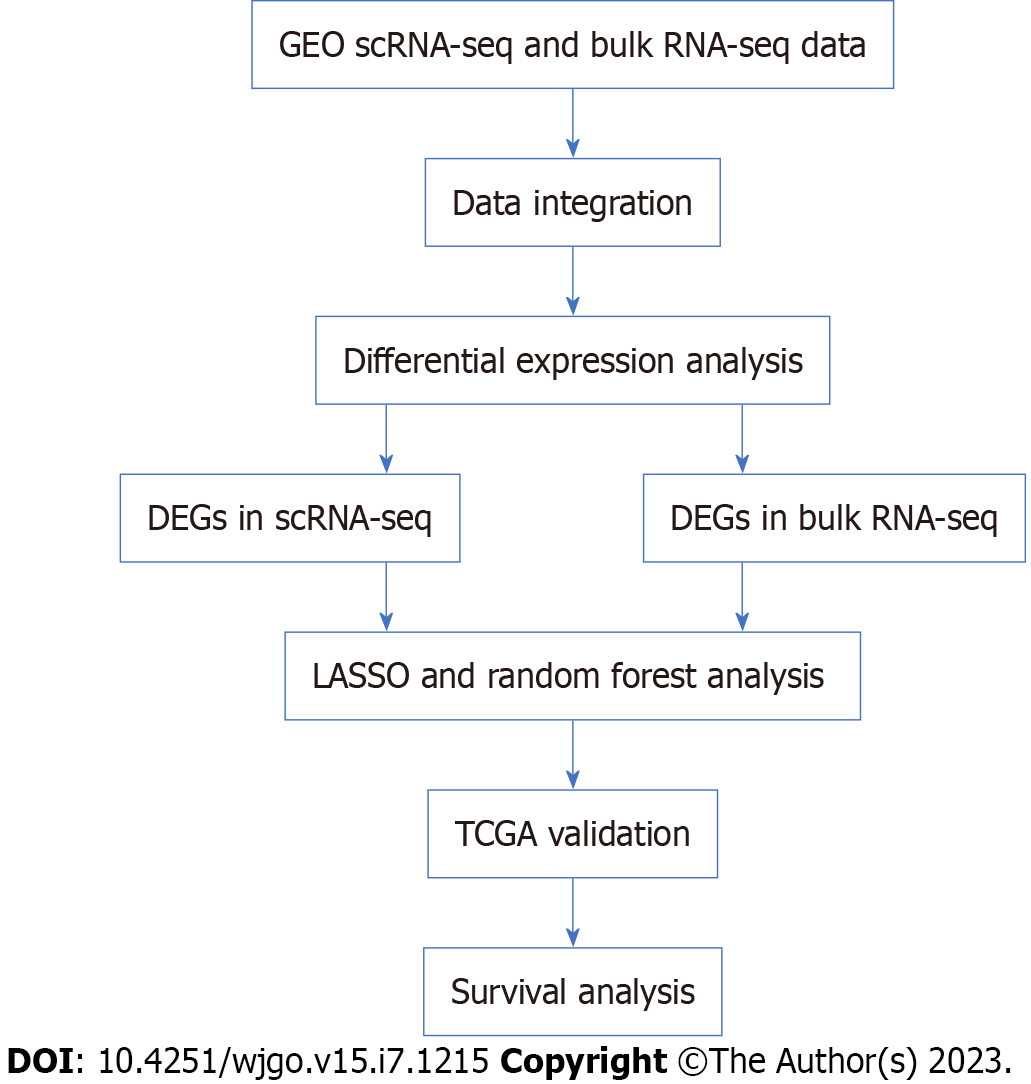
Figure 1 Workflow of the study.
Bulk RNA-seq: Bulk RNA sequencing; DEGs: Differentially expressed genes; LASSO: Least absolute shrinkage and selection operator; scRNA-seq: Single-cell RNA sequencing; GEO: Gene Expression Omnibus.
Figure 2 Analysis results of single-cell sequencing.
A: UMAP of integrated samples, color-coded by cell clusters; B: UMAP of integrated samples, color-coded by cell types; C: Violin plot of expression of typical marker genes in different cell types; D: Heatmap of expression of typical marker genes in different cell clusters; E: Bar plot showing the proportion of each cell type in different tissues [normal gastric tissue (NAG), chronic atrophic gastritis (CAG), gastric cancer (GC)]; F: Bar plot showing the proportion of each cell type in different tissues [NAG, CAG, intestinal metaplasia (IM), intestinal GC, mixed GC, diffuse GC].
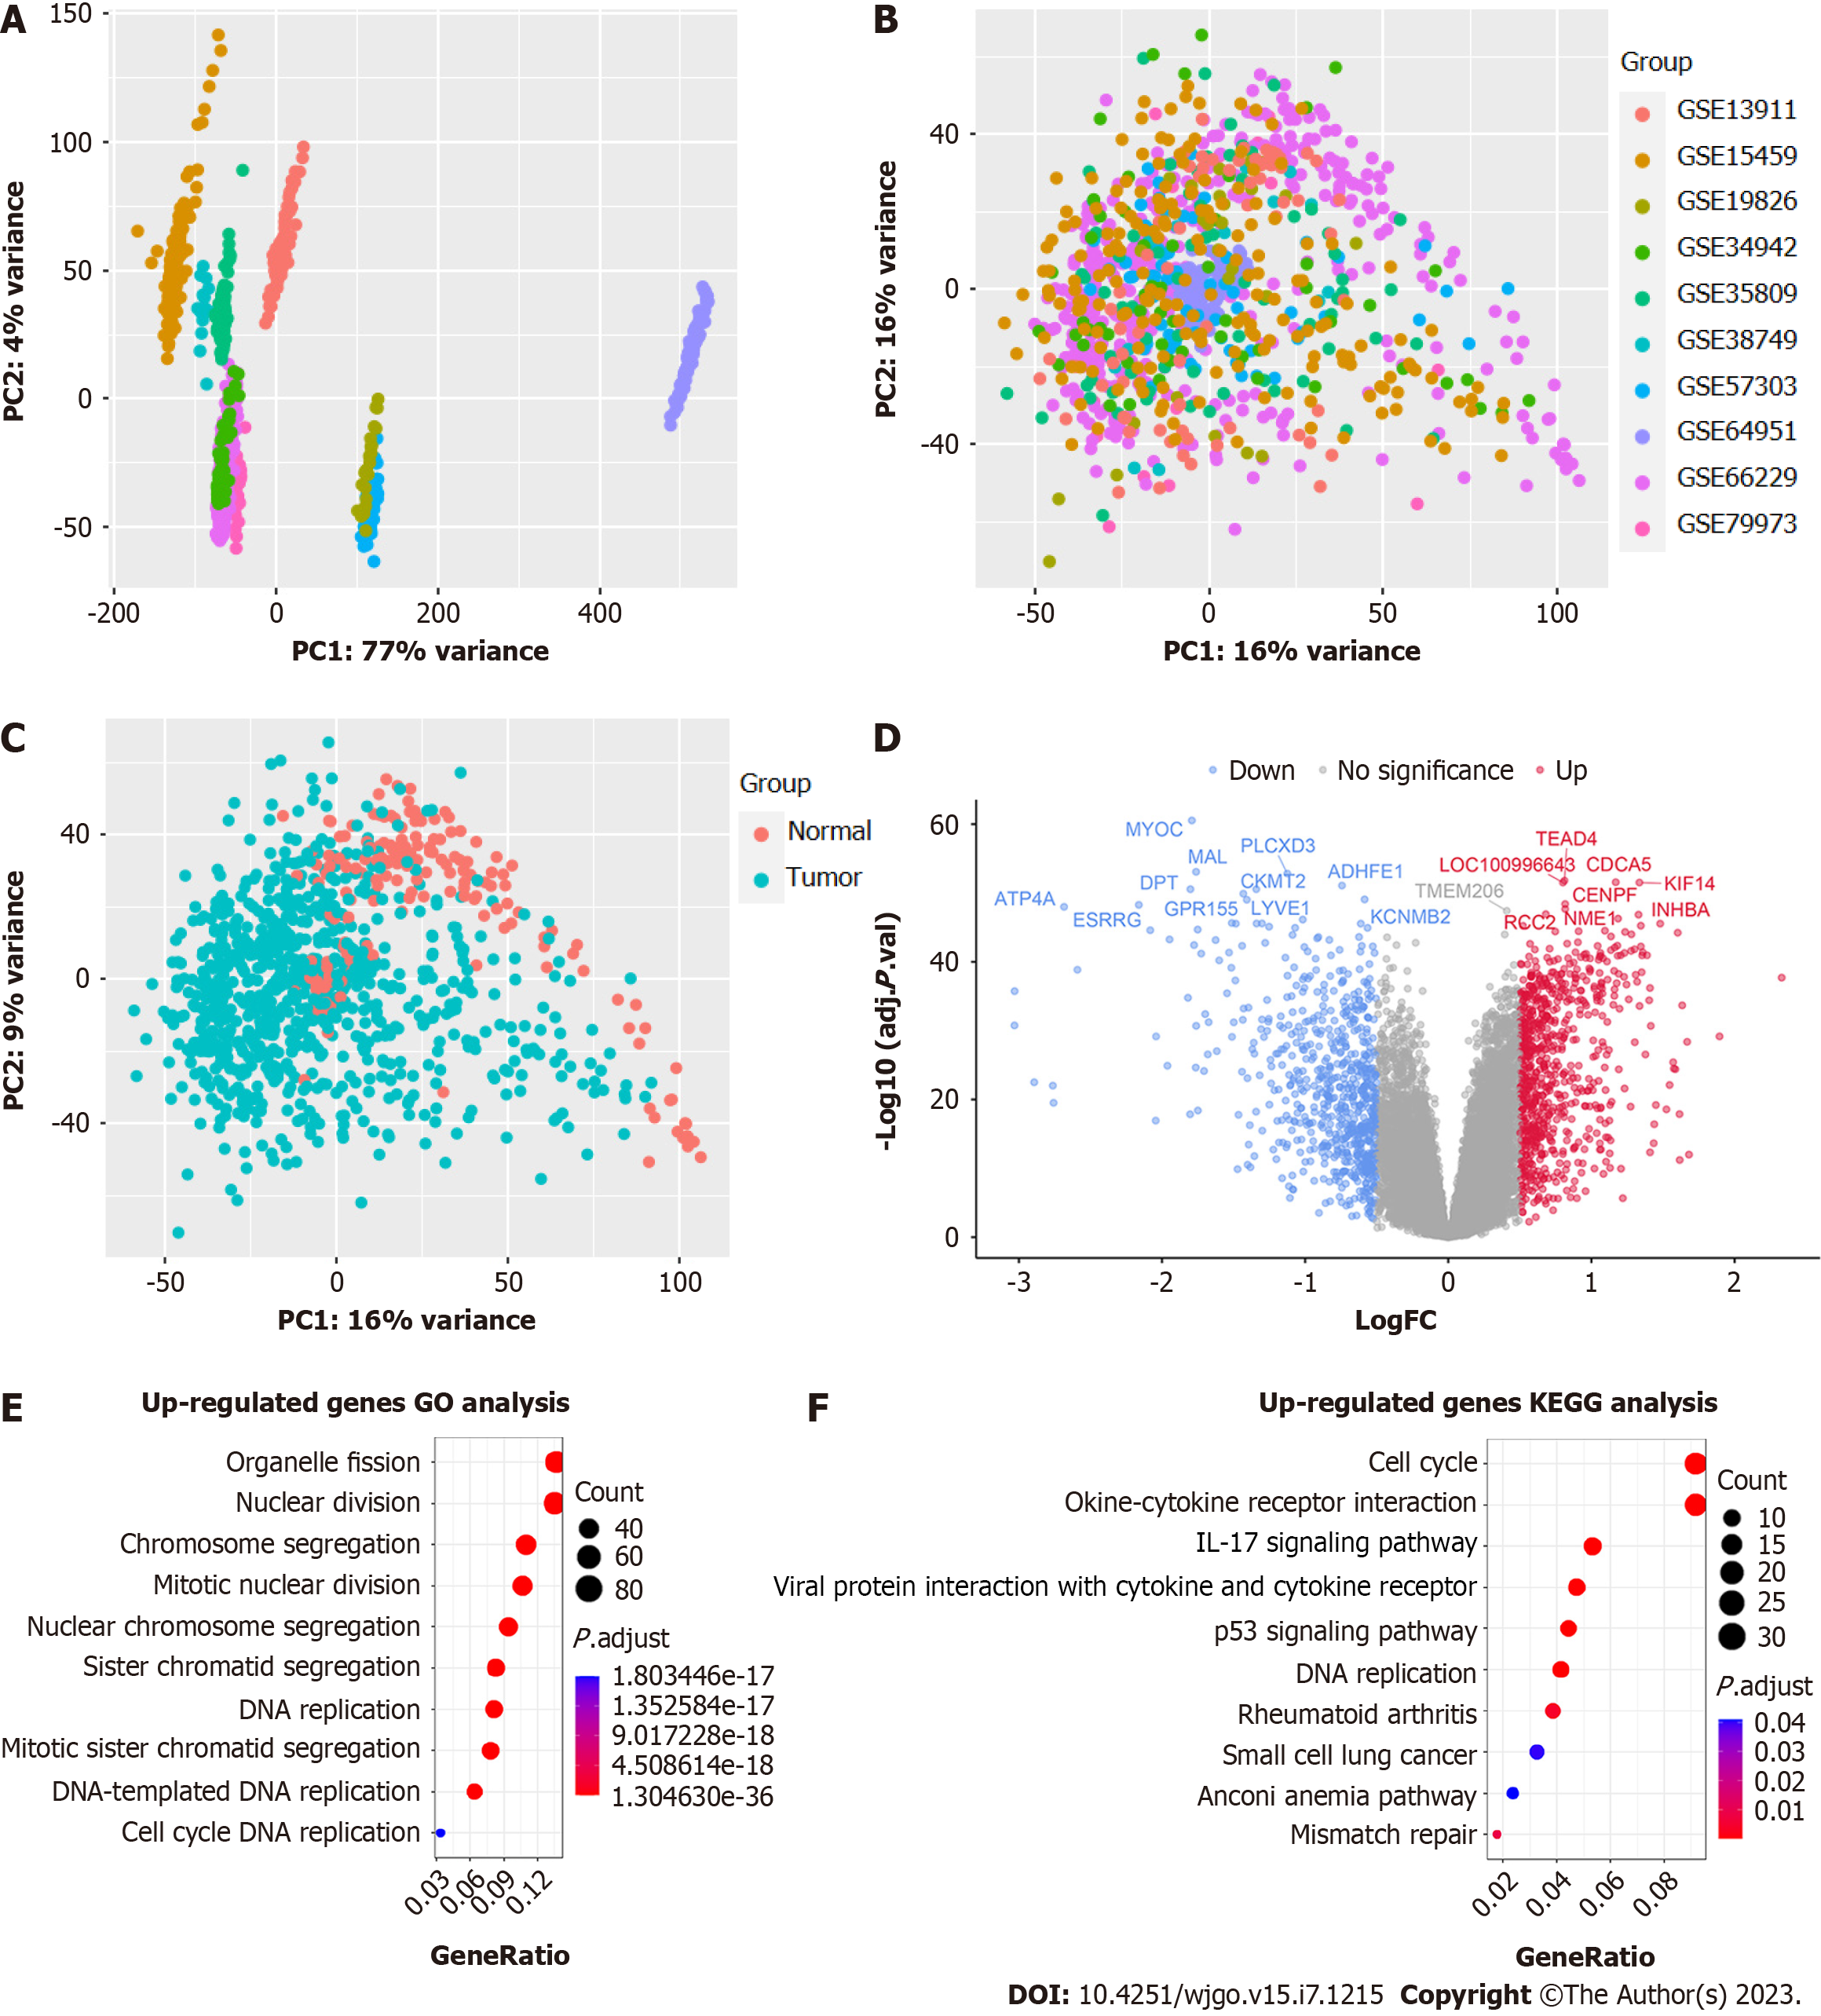
Figure 3 Analysis results of bulk RNA sequencing.
A: Principal component analysis (PCA) before COMBAT (presented by dataset); B: PCA after COMBAT (presented by dataset); C: PCA after COMBAT (by pathology type); D: Volcano plot showing differentially expressed genes with top 20 genes labeled according to ‘-log10 (P value)’; E: Gene Ontology (GO) and Kyoto Encyclopedia of Genes and Genomes (KEGG) enrichment analysis of highly expressed genes in gastric cancer tissues.
Figure 4
Protein interaction analysis of the differentially expressed genes.
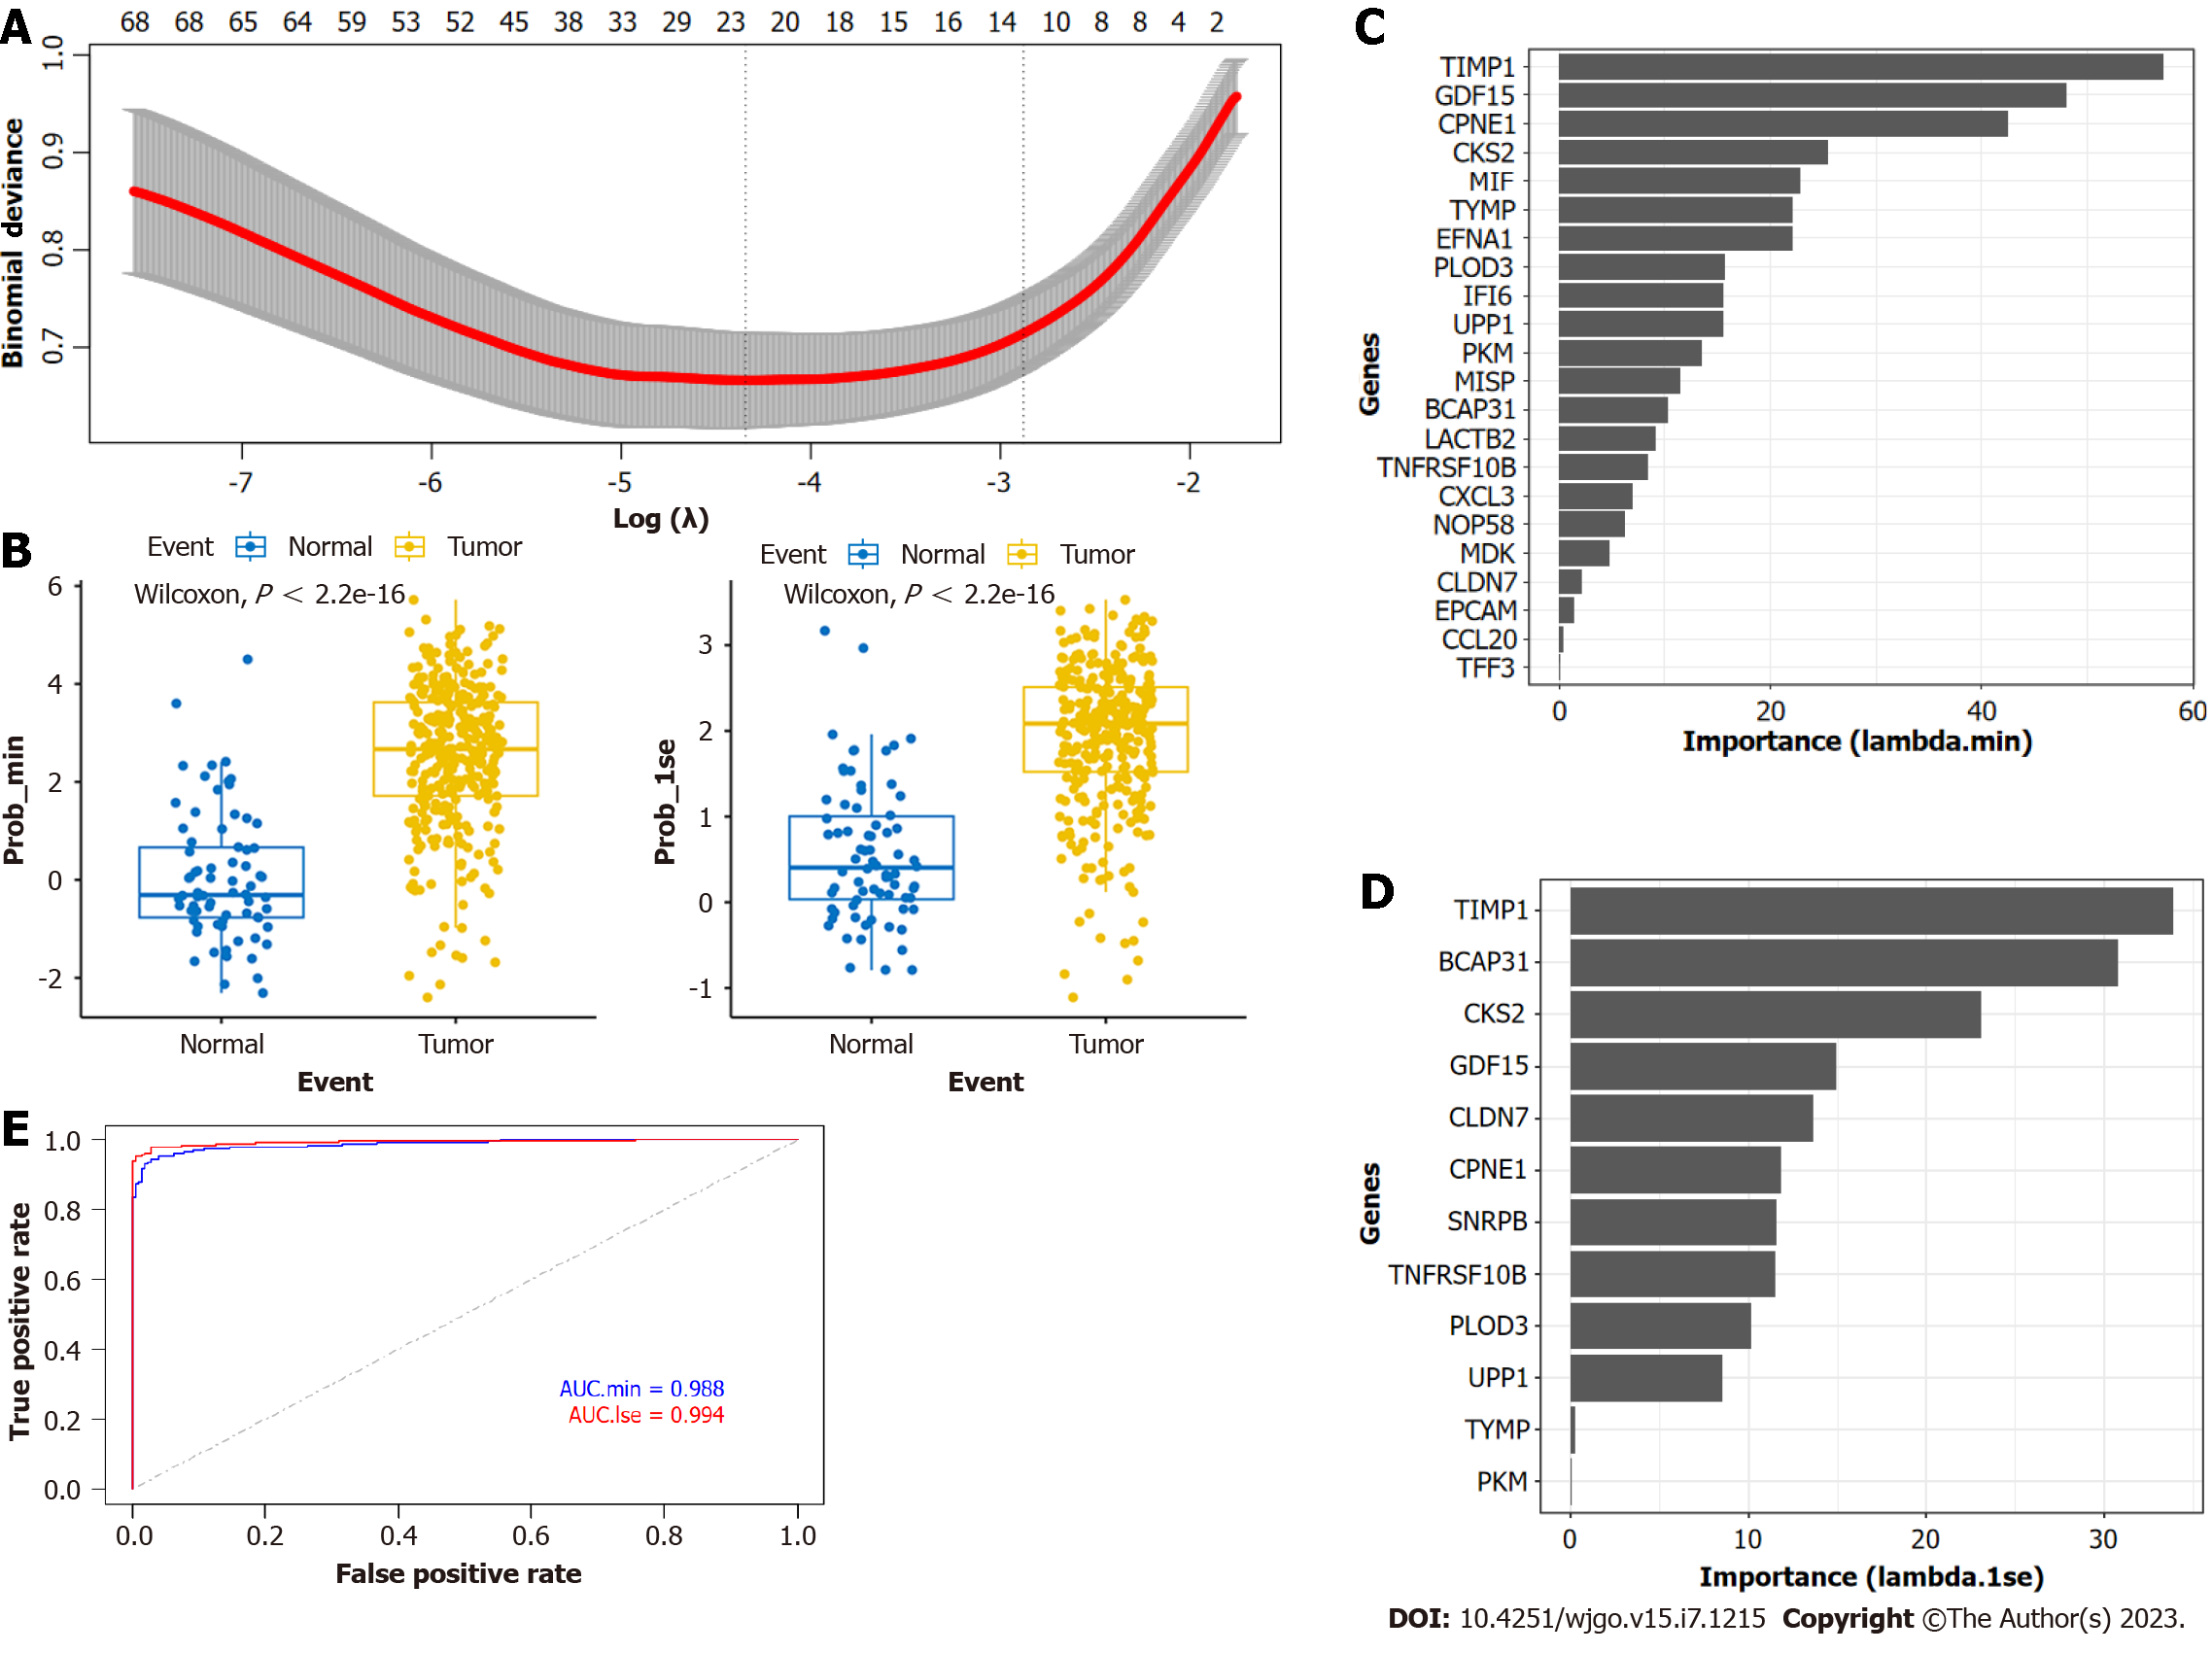
Figure 5 Gastric cancer prediction model constructed by Least absolute shrinkage and selection operator.
A: Plot showing 'prob_min' and 'prob_1se' selected to construct the Least absolute shrinkage and selection operator (LASSO) model; B: Plot showing the predictive efficiency of the LASSO model; C: Importance values of genes in the 'prob_min' model; D: Importance values of genes in the 'prob_1se' model; E: Area under the curve (AUC) analyses depicting the predictive efficiency of the LASSO model in the The Cancer Genome Atlas and Genotype-Tissue Expression datasets.
Figure 6 Gastric cancer prediction model constructed by random forest.
A: Feature selection of the gastric cancer prediction model based on random forest; B: Accuracy of randomly selected predictors across repeated cross validation; C: Importance values of genes in the random forest model; D: Area under curve value of the random forest prediction model.
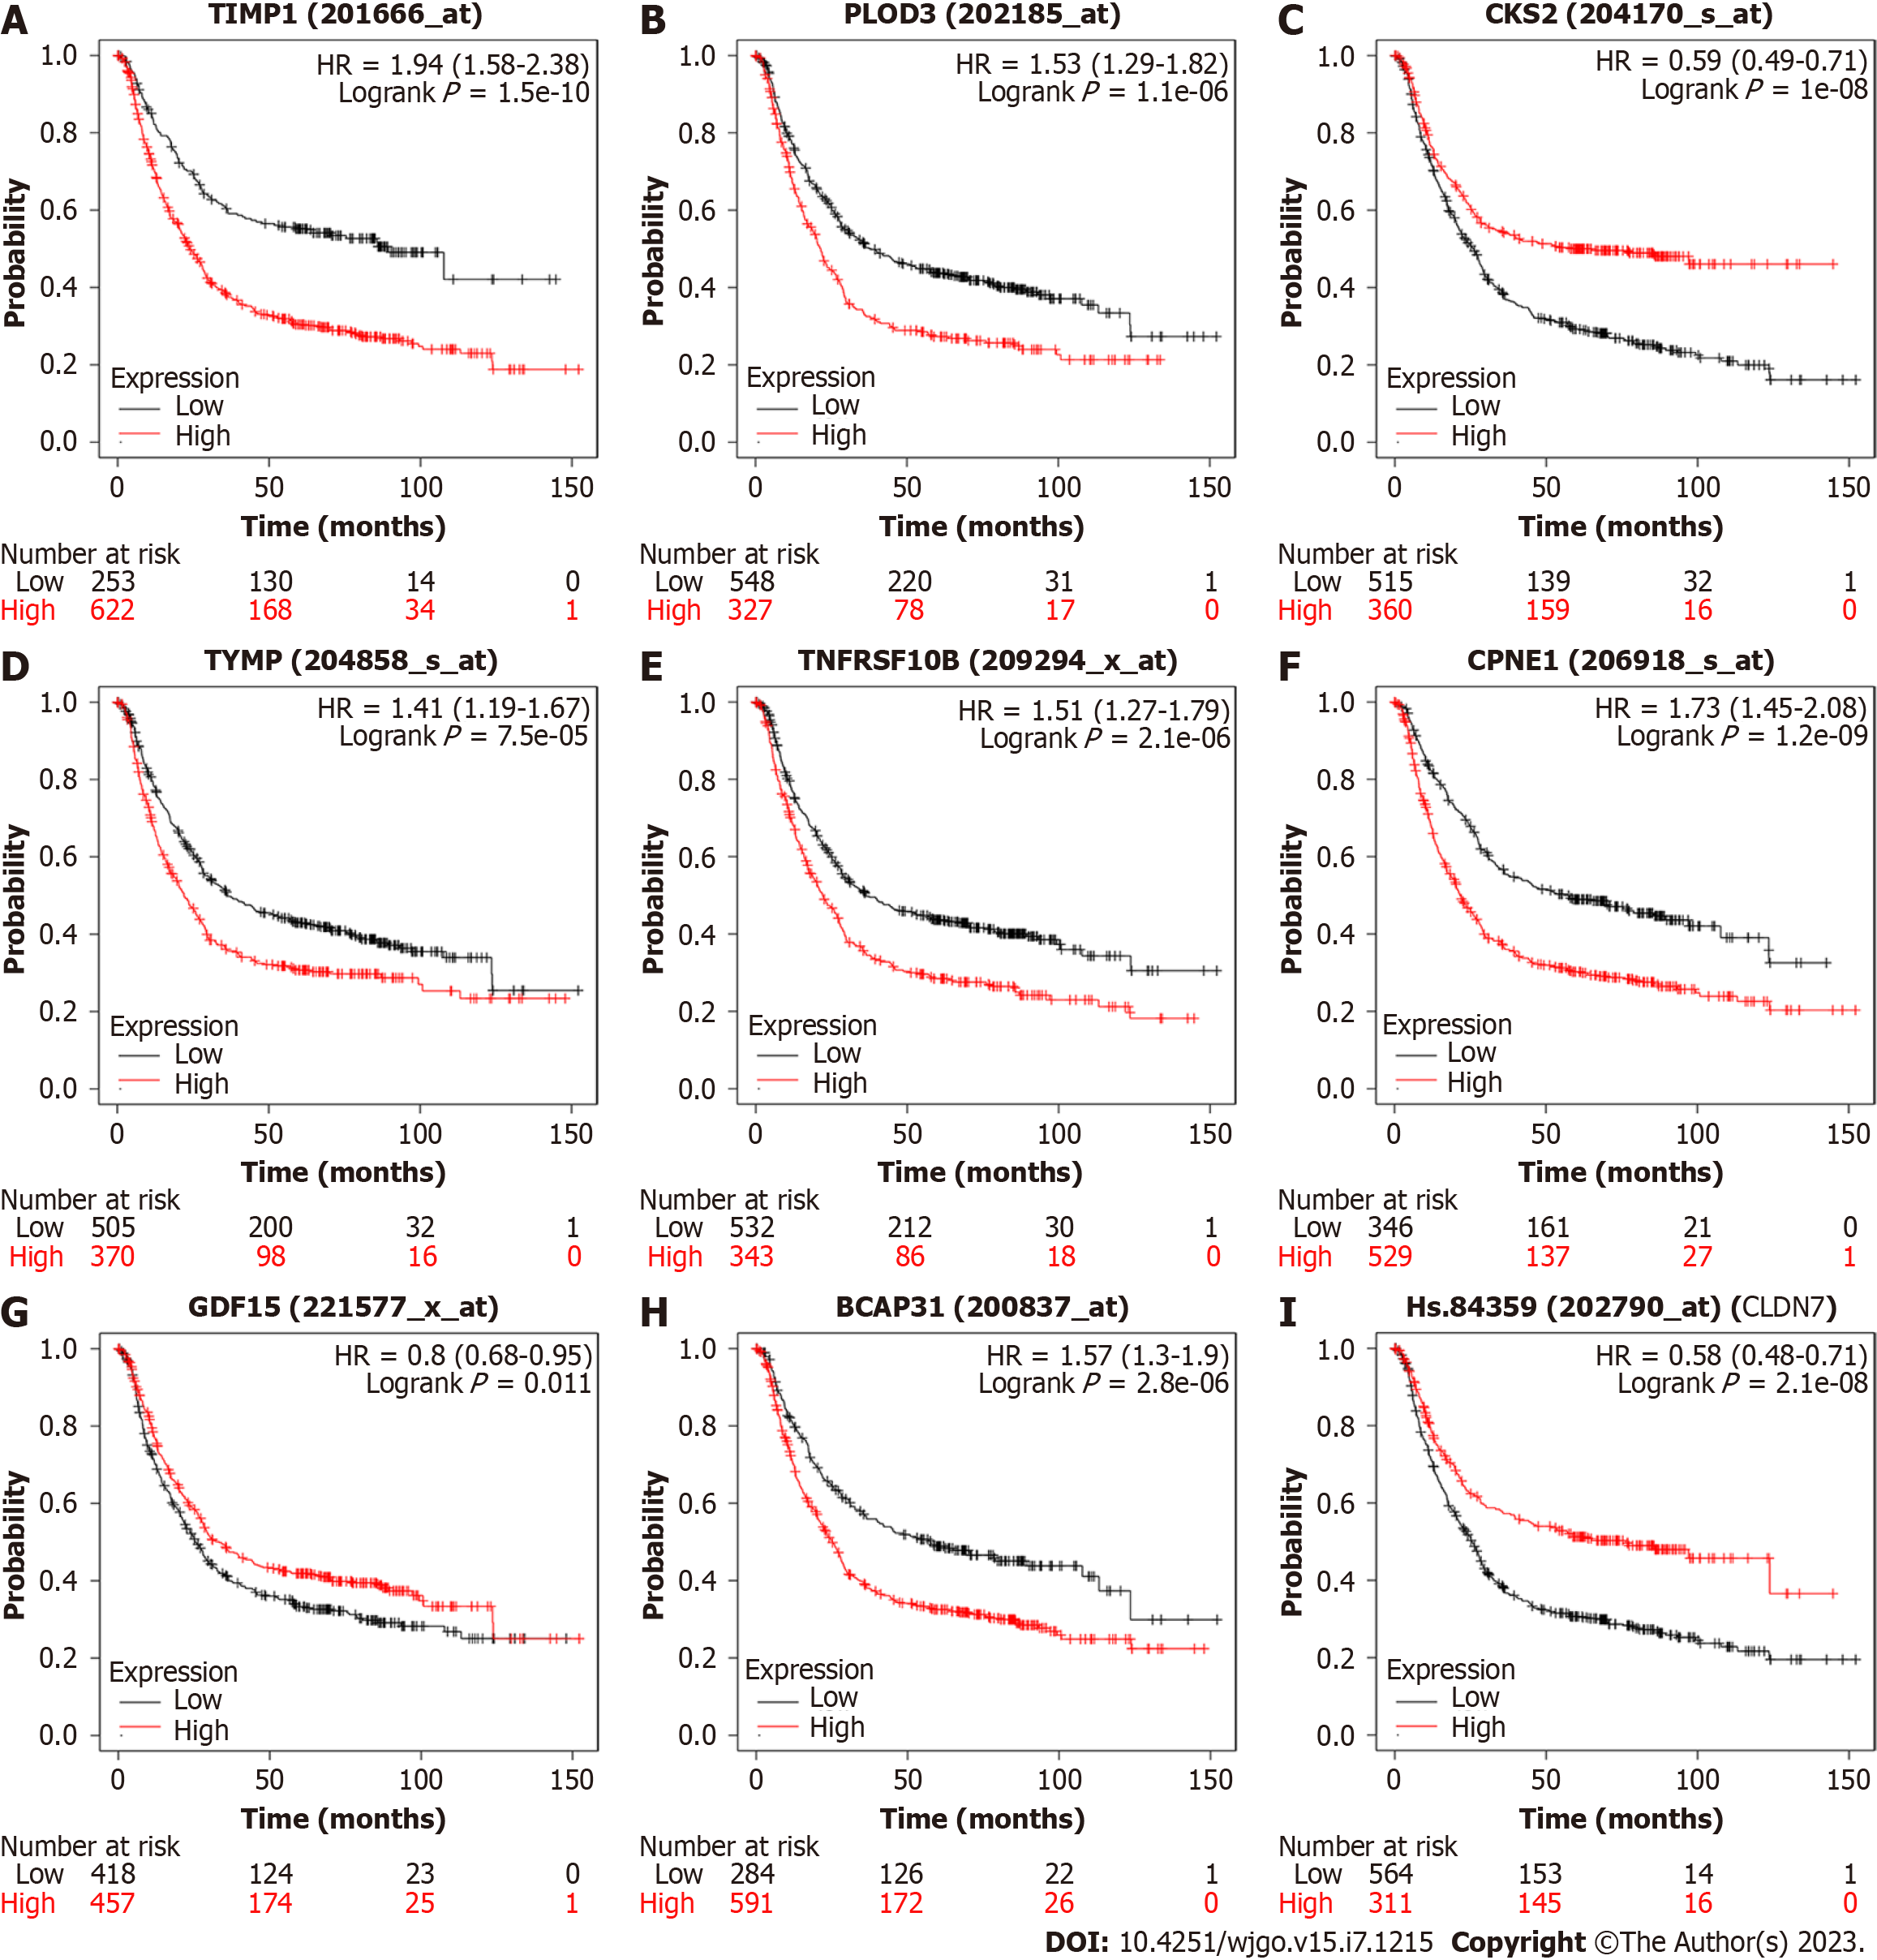
Figure 7 Kaplan–Meier plots evaluating the association between gene expression and gastric cancer survival.
A: TIMP1; B: PLOD3; C: CSK2; D: TYMP; E: TNFRSF10B; F: CPNE1; G: GDF15; H: BCAP31; I: CLDN7. HR: Hazard ratio.
- Citation: Wen F, Guan X, Qu HX, Jiang XJ. Integrated analysis of single-cell and bulk RNA-seq establishes a novel signature for prediction in gastric cancer. World J Gastrointest Oncol 2023; 15(7): 1215-1226
- URL: https://www.wjgnet.com/1948-5204/full/v15/i7/1215.htm
- DOI: https://dx.doi.org/10.4251/wjgo.v15.i7.1215


