Copyright
©The Author(s) 2023.
World J Gastrointest Oncol. Nov 15, 2023; 15(11): 2041-2048
Published online Nov 15, 2023. doi: 10.4251/wjgo.v15.i11.2041
Published online Nov 15, 2023. doi: 10.4251/wjgo.v15.i11.2041
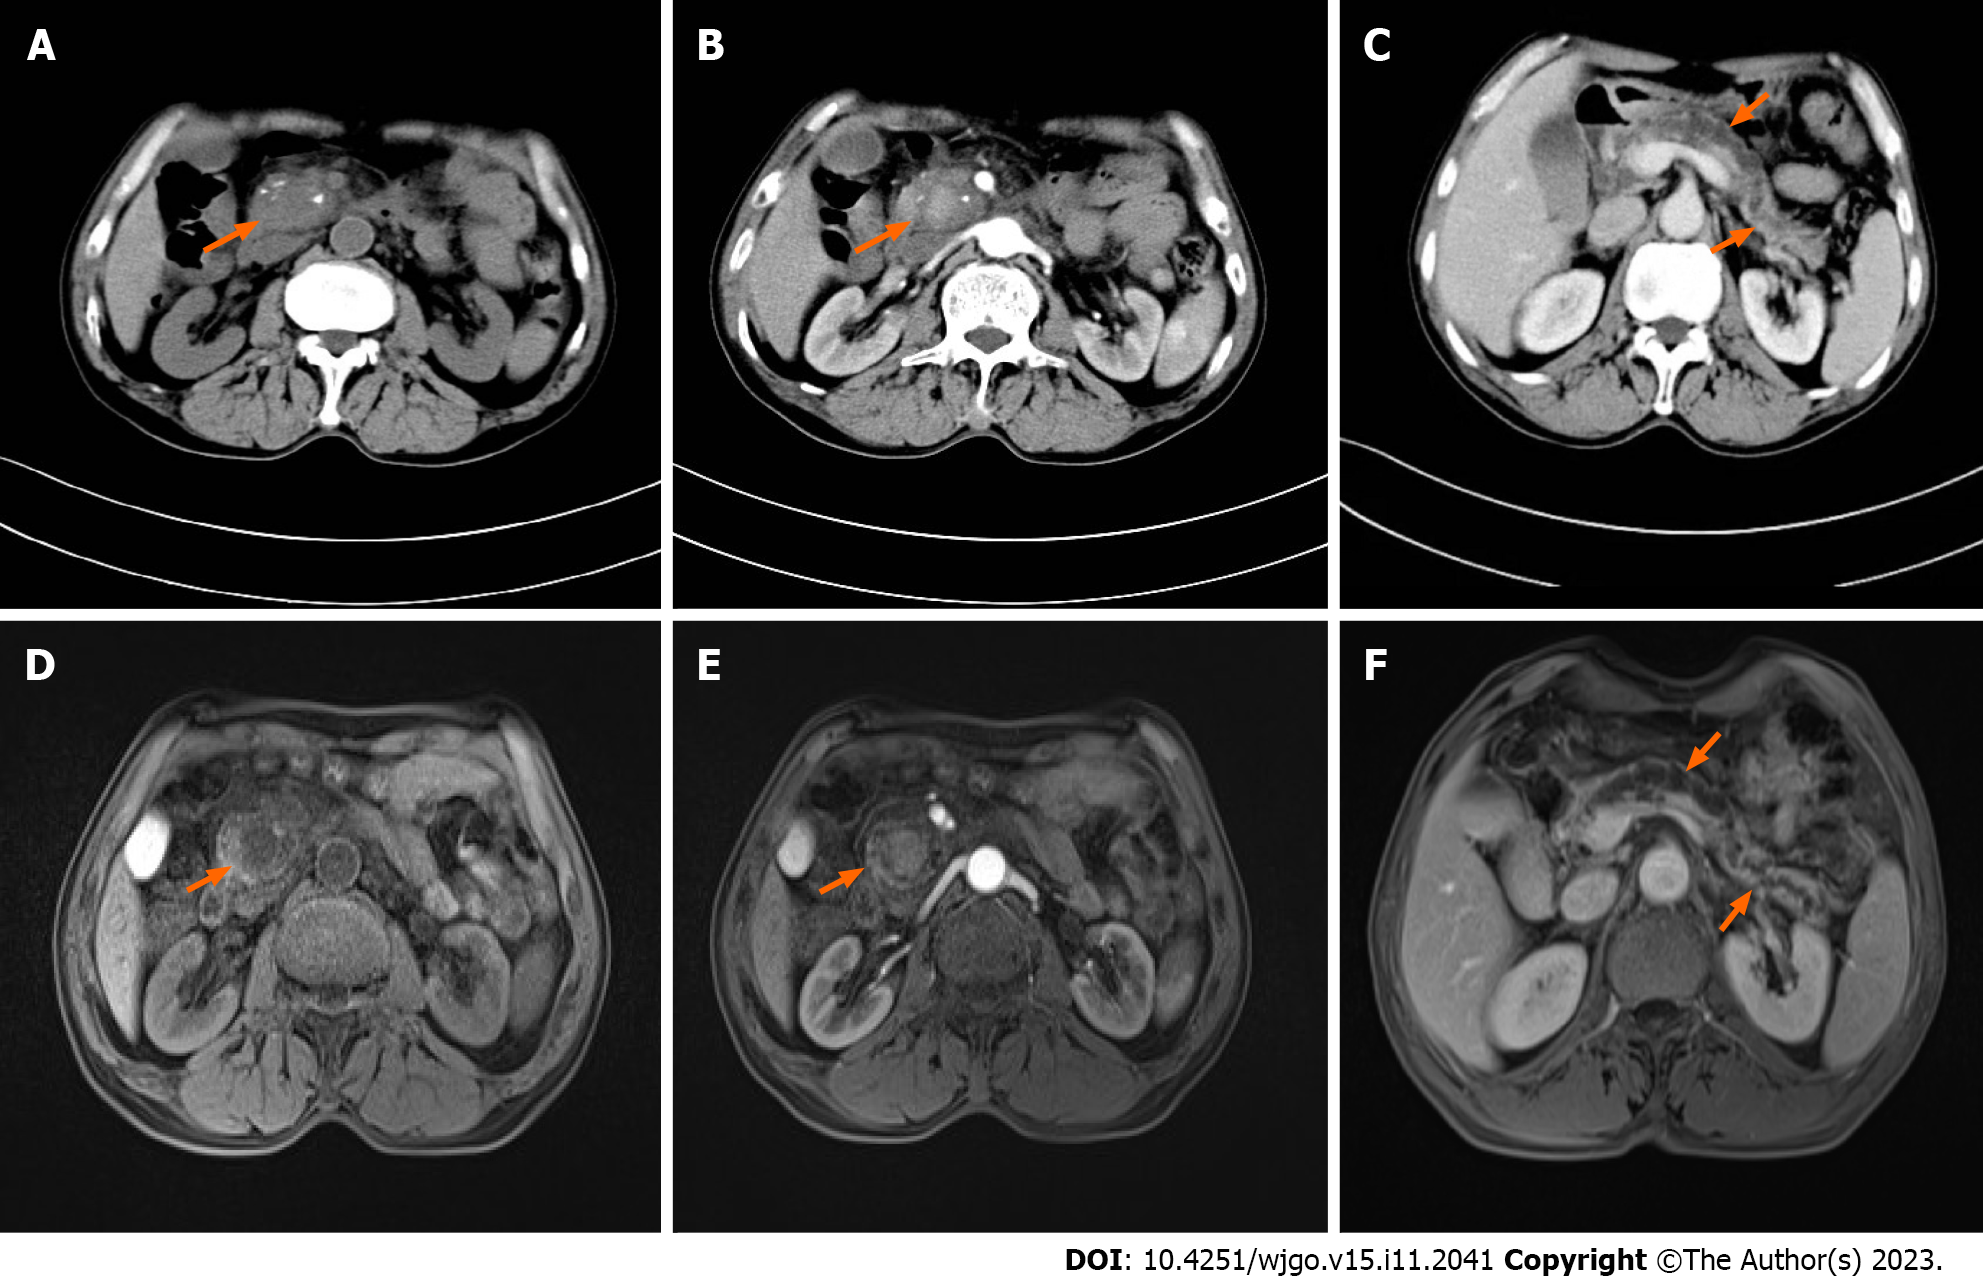
Figure 1 Representative computed tomography and magnetic resonance imaging.
A: Computed tomography (CT) showing enlargement of the pancreatic head with unclear borders and scattered irregular calcifications (orange arrow); B: Axial view of contrast-enhanced CT reveals a slightly enhanced intrapancreatic lesion in the head of the pancreas (orange arrows); C: CT show generalized dilatation of the main pancreatic duct and mild atrophy of the distal pancreas (orange arrow); D: Magnetic resonance imaging (MRI) showing a low attenuation lesion in the center of the pancreatic head (orange arrow); E: Contrast-enhanced MRI axial view reveals uniformly mild enhancement within the lesion (orange arrows); F: MRI show significant dilatation of the main pancreatic duct with mild atrophy of the distal pancreas (orange arrows).
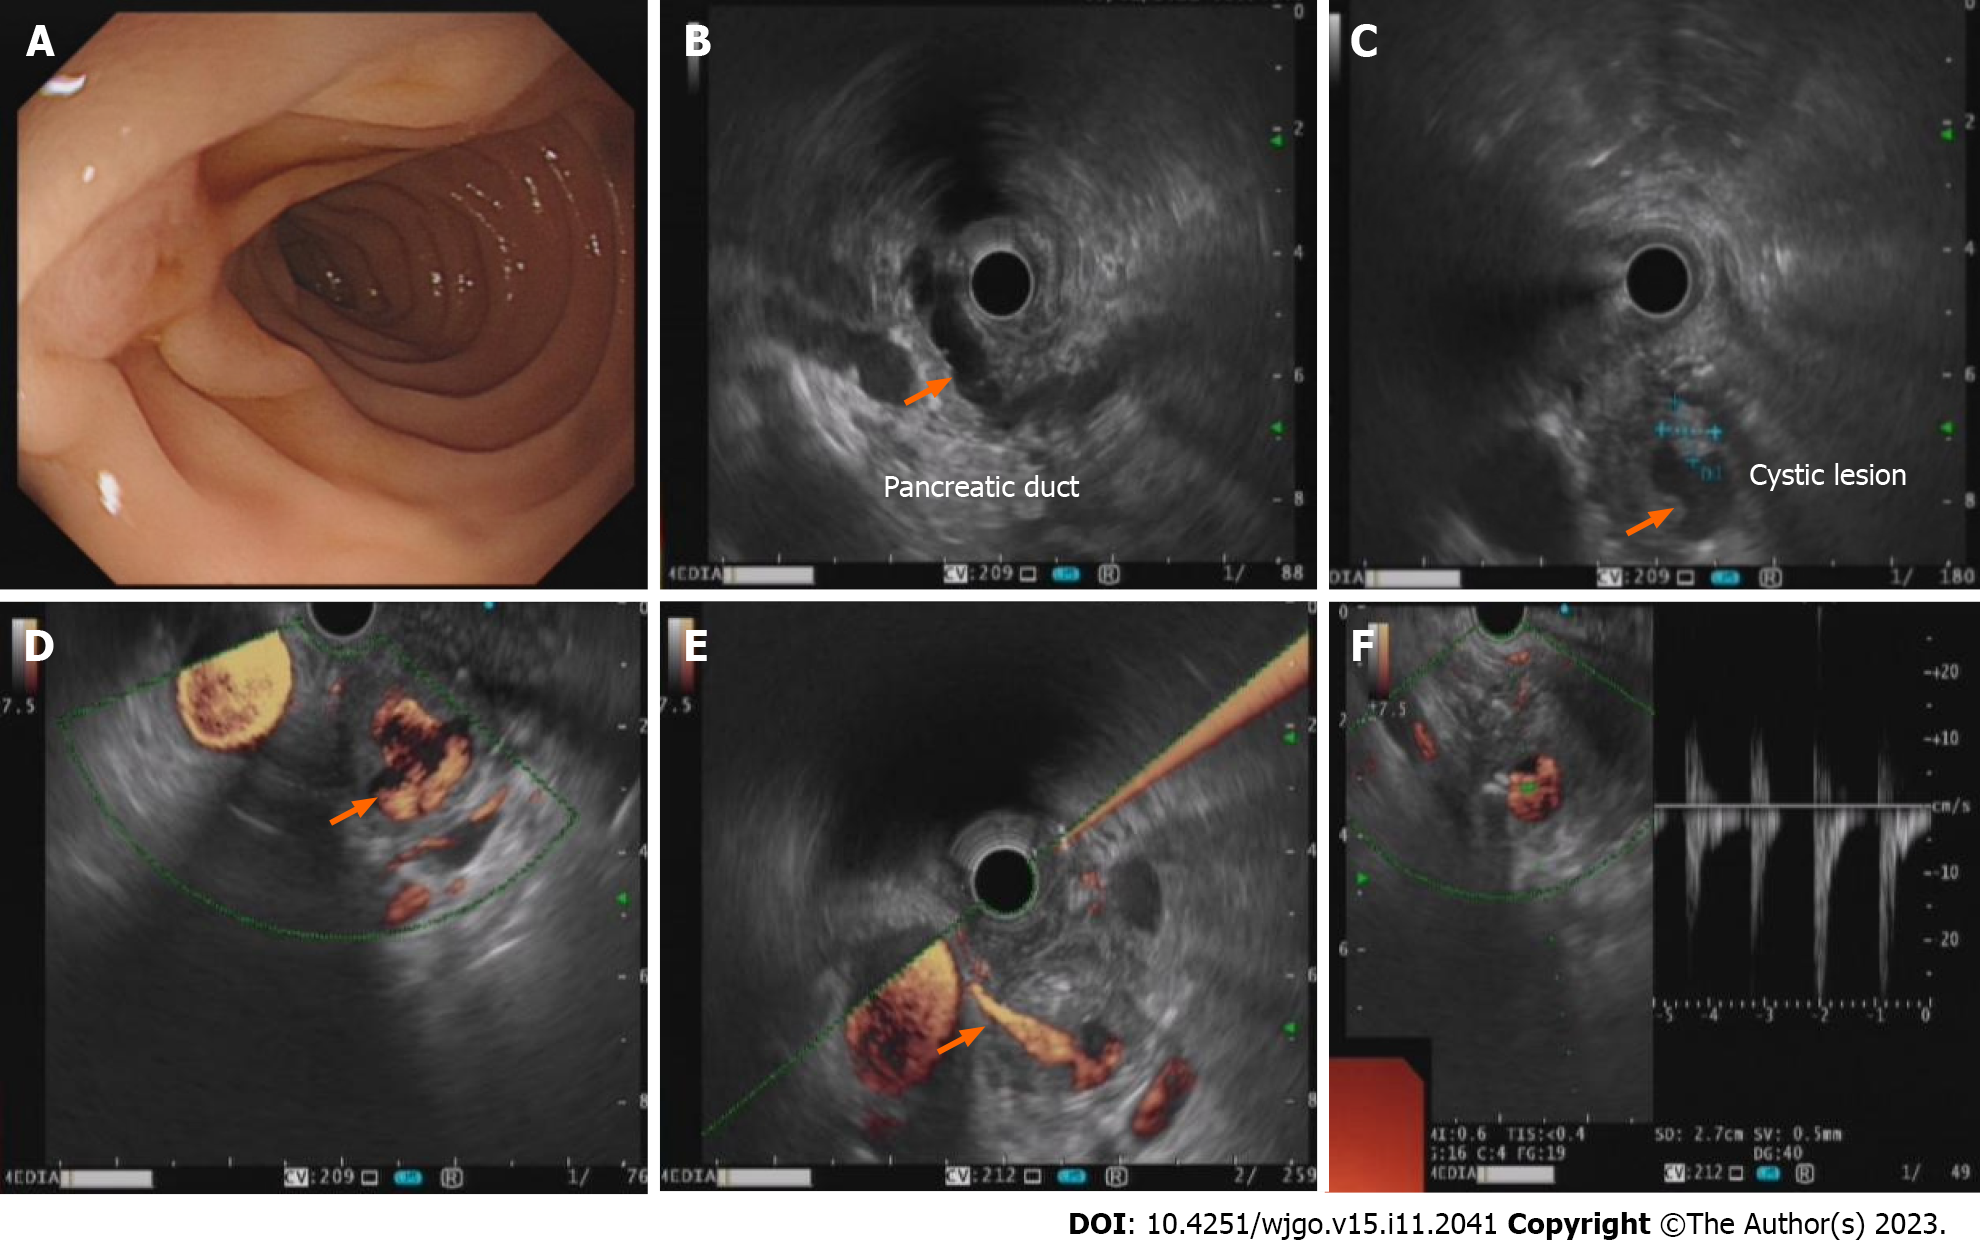
Figure 2 Representative endoscopic ultrasonography imaging.
A: The duodenal papilla is normal; B: Endoscopic ultrasonography (EUS) showing obvious dilation of the main pancreatic duct in the pancreatic body and tail (orange arrow); C: EUS showing a cystic lesion with wall thickness and enhancing nodules in the pancreatic head (orange arrow); D: Color doppler flow imaging (CDFI) revealed turbulent blood flow in the cystic lesion (orange arrow); E: CDFI showing the lesion connected with the surrounding vessel by dynamic and continuous scans (orange arrow); F: Doppler spectrum showing an arterial blood flow signal within the lesion.
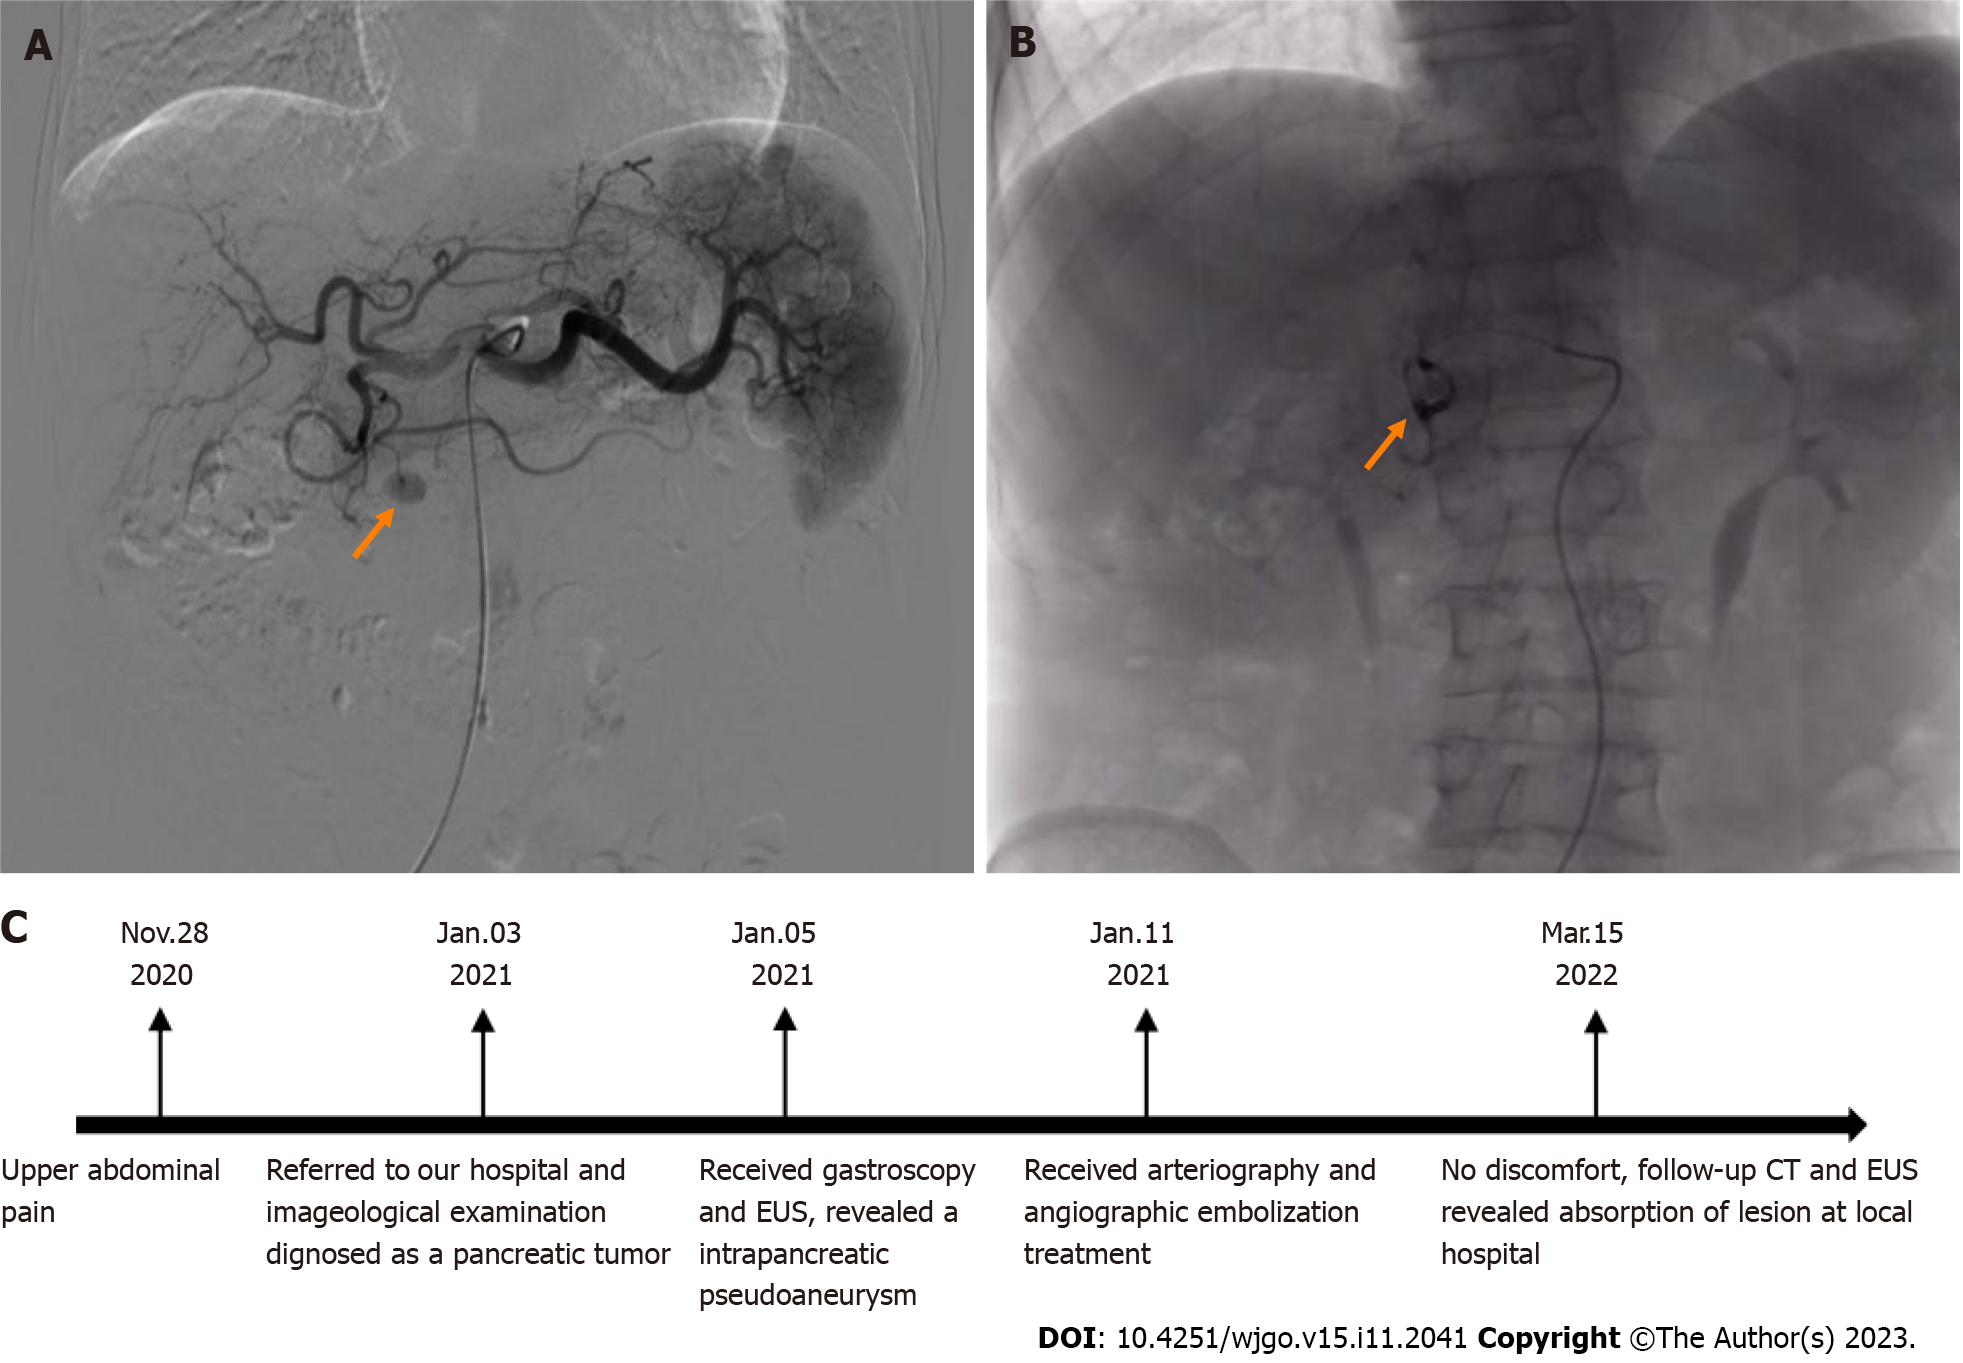
Figure 3 Angiography images and postoperative interventional embolization.
A: Angiography reveals an extravasation of contrast medium (size: 1.0 cm × 1.5 cm) at the far-end branch of the superior pancreaticoduodenal artery (orange arrow); B: Angiography showing no contrast medium spillage after embolization (orange arrow); C: Timeline. EUS: Endoscopic ultrasonography; CT: Computed tomography.
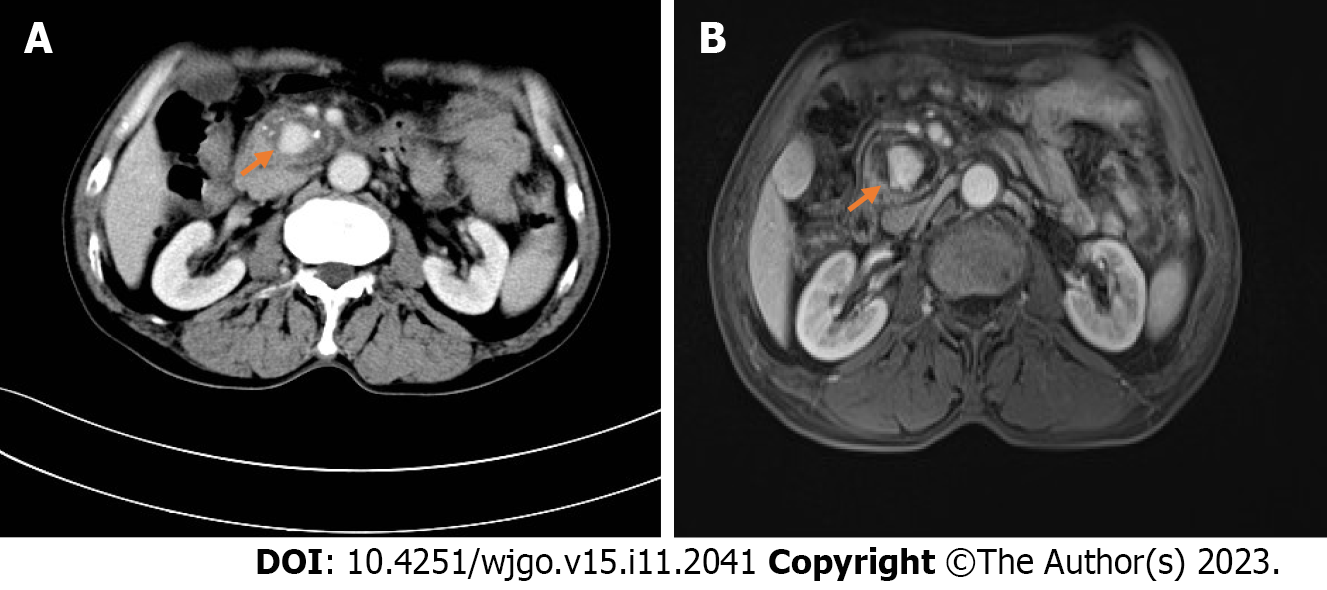
Figure 4 Computed tomography and magnetic resonance imaging venous phase imaging.
A: Axial view of contrast-enhanced computed tomography reveal delayed enhancement in the venous phase (orange arrow); B: Axial view of contrast-enhanced magnetic resonance imaging show delayed enhancement in the venous phase (orange arrow).
- Citation: Yang Y, Liu XM, Li HP, Xie R, Tuo BG, Wu HC. Pancreatic pseudoaneurysm mimicking pancreatic tumor: A case report and review of literature. World J Gastrointest Oncol 2023; 15(11): 2041-2048
- URL: https://www.wjgnet.com/1948-5204/full/v15/i11/2041.htm
- DOI: https://dx.doi.org/10.4251/wjgo.v15.i11.2041


