Copyright
©The Author(s) 2022.
World J Gastrointest Oncol. Sep 15, 2022; 14(9): 1808-1822
Published online Sep 15, 2022. doi: 10.4251/wjgo.v14.i9.1808
Published online Sep 15, 2022. doi: 10.4251/wjgo.v14.i9.1808
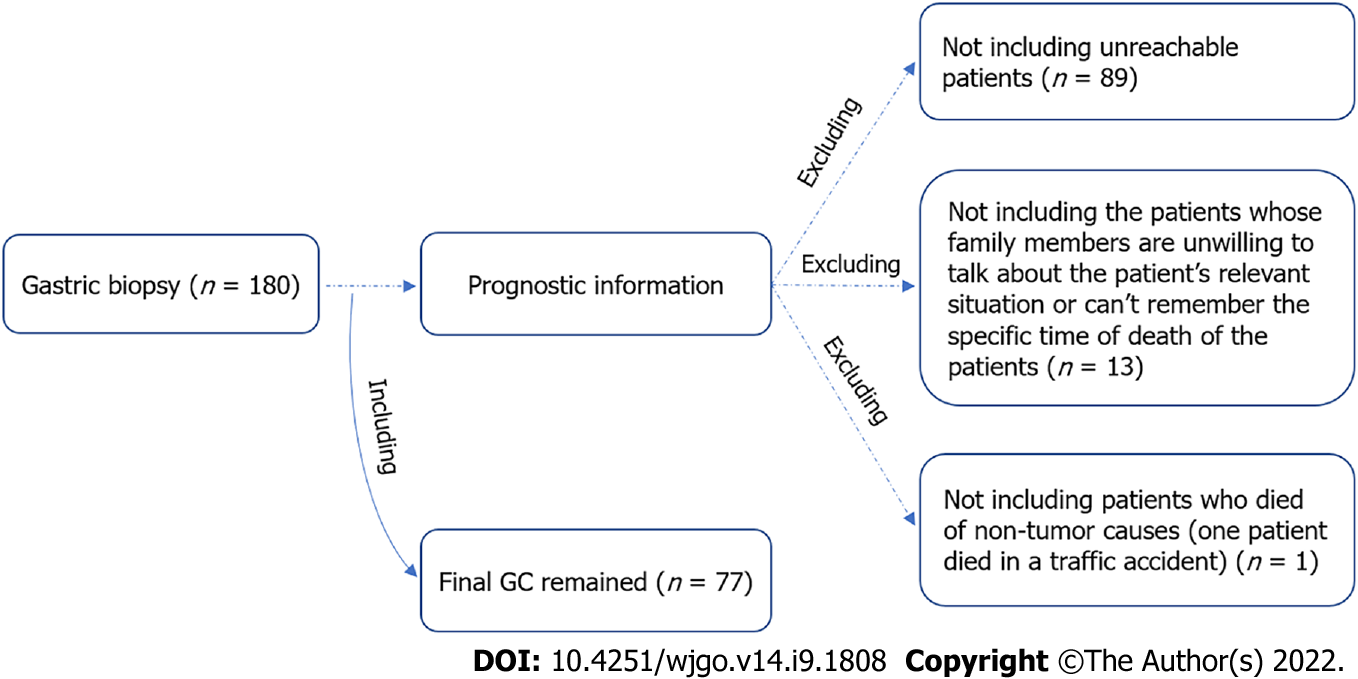
Figure 1 Flow chart for recruitment of gastric cancer patients.
GC: Gastric cancer.
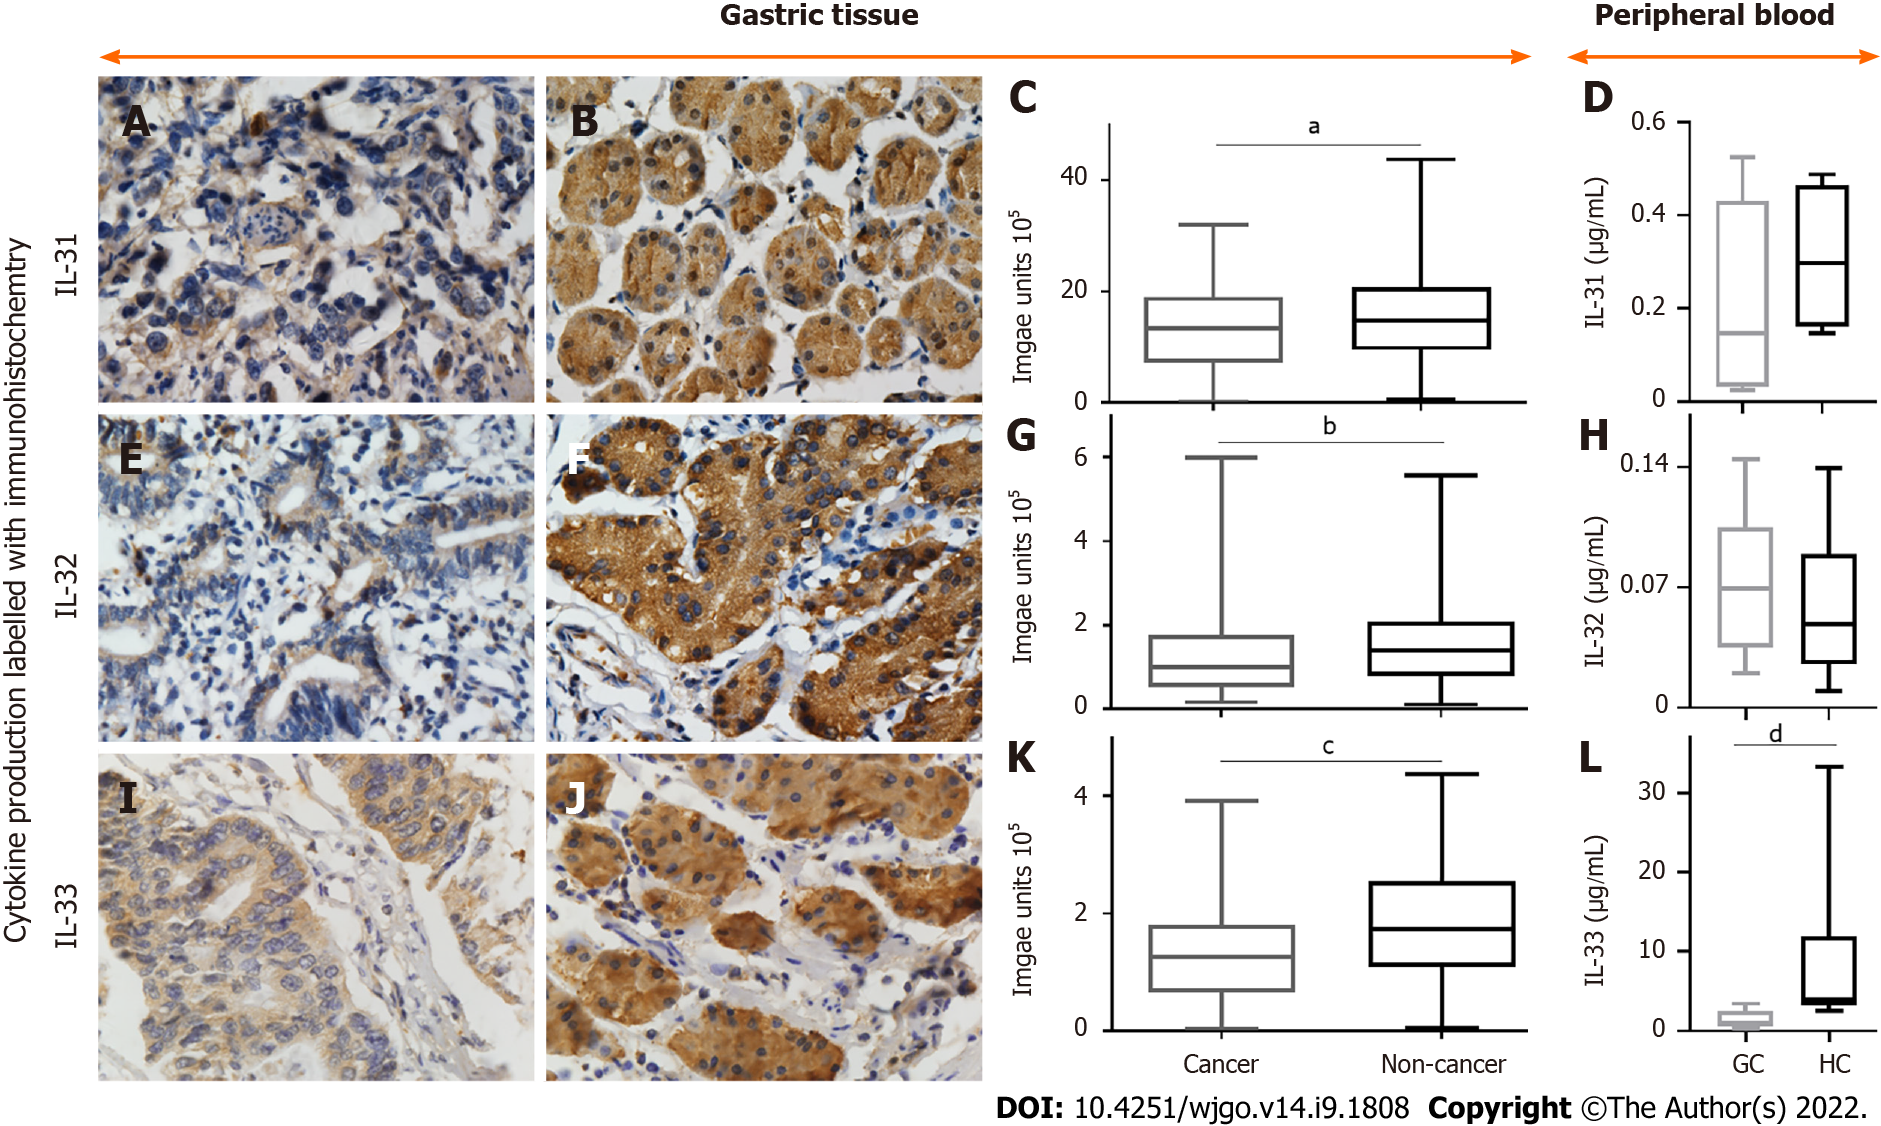
Figure 2 Representative images of immunohistochemical staining for interleukin-31, interleukin-32, and interleukin-33 and their densities in non-cancerous and gastric cancer tissues, as well as their levels in peripheral blood of gastric cancer patients and healthy individuals.
A-C: Positive (brown) interleukin (IL)-31 expression in gastric cancer (A) and noncancerous tissues (B) and quantified data (C); D, H, and L: IL-31 (D), IL-32 (H), and IL-33 (L) levels in peripheral blood from gastric cancer (GC) patients and healthy controls (HC); E-G: Positive IL-32 expression in gastric cancer (E) and noncancerous tissues (F) and quantified data (G); I-K: Positive IL-33 expression in gastric cancer (I) and noncancerous tissues (J) and quantified data (K). The densities of IL-31 and IL-33 were all decreased in GC compared to tumour-adjacent normal gastric tissues. Magnification, 600 ×. aP < 0.05; bP < 0.01; cP < 0.0001; dP < 0.05. GC: Gastric cancer; IL: Interleukin.
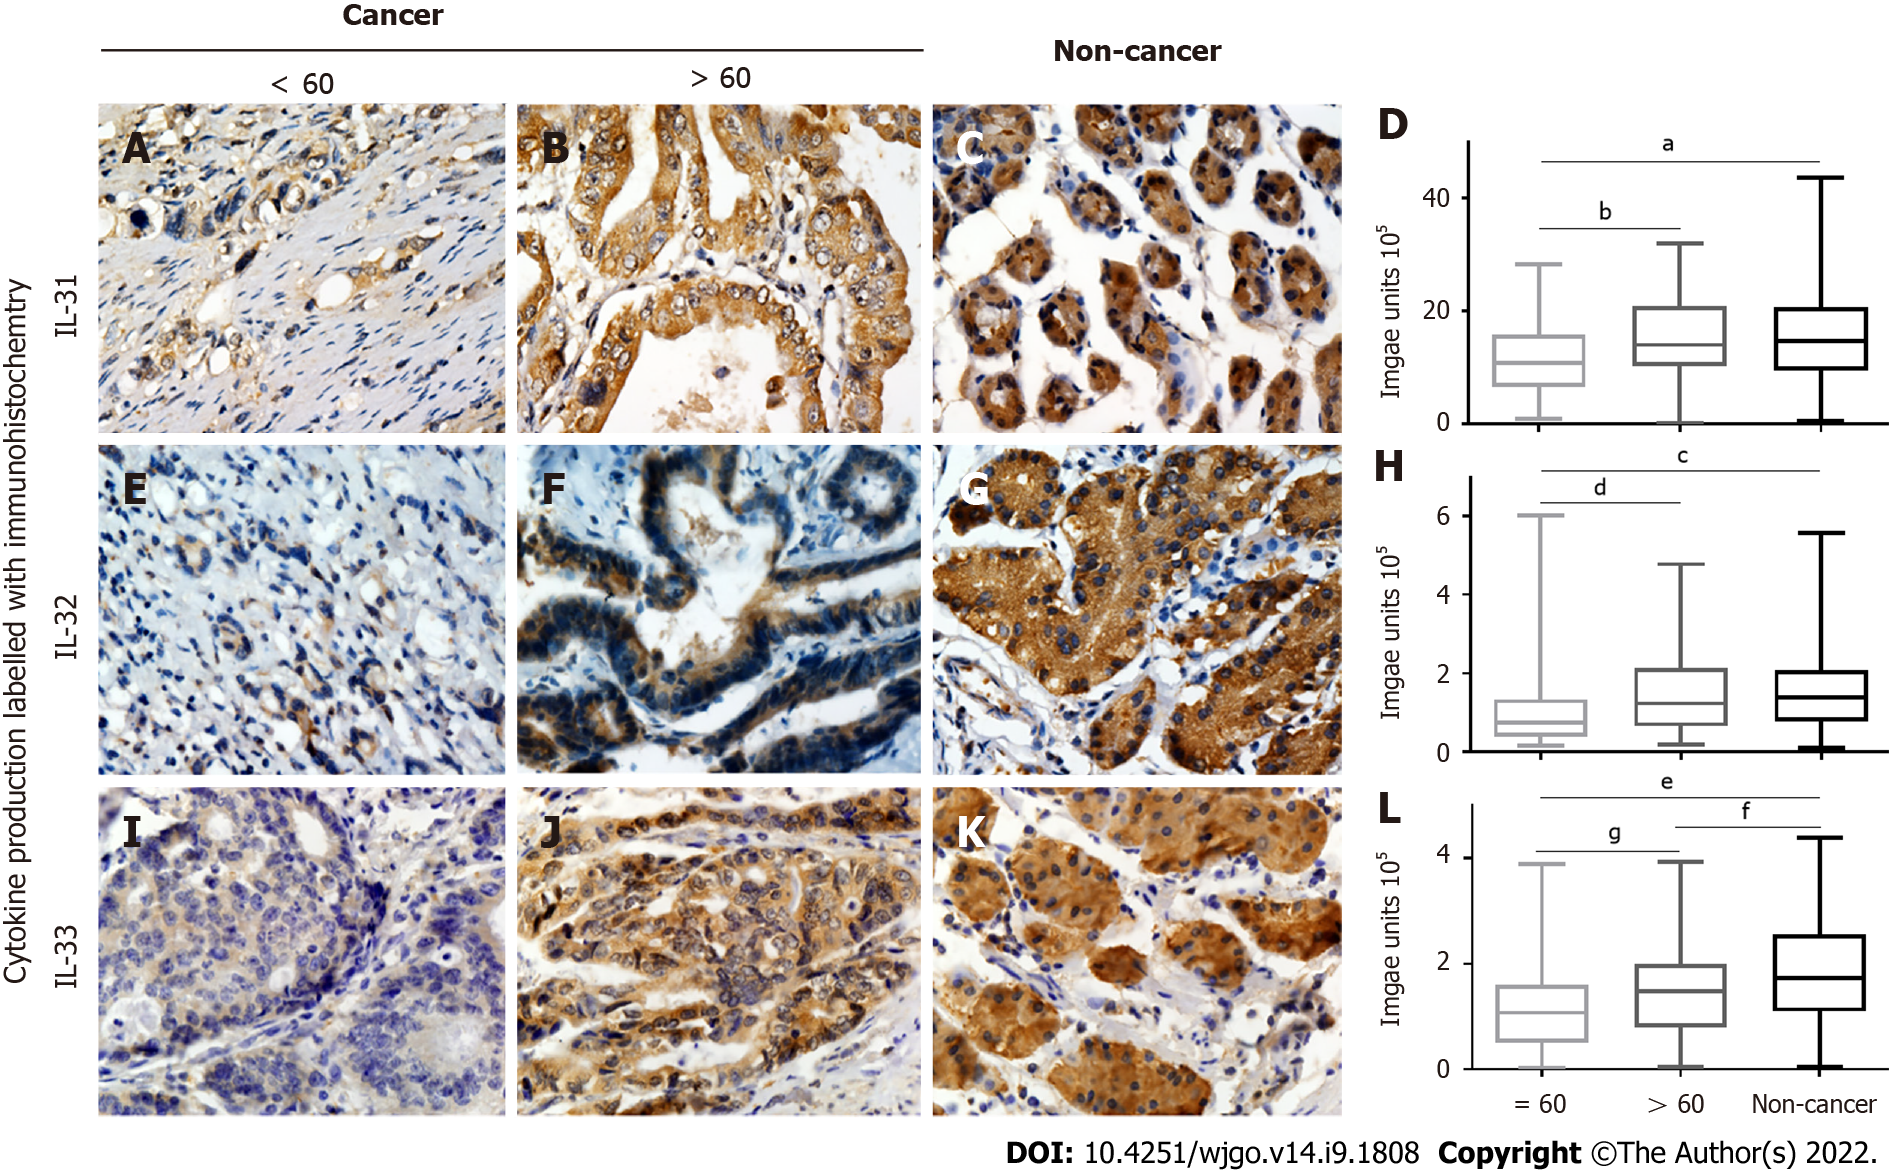
Figure 3 Correlation of interleukin-31, interleukin-32, and interleukin-33 expression with age.
A-D: Positive (brown) interleukin (IL)-31 expression in gastric cancer tissues from patients aged < 60 (A) vs > 60 (B) years and noncancerous tissues (C) plus quantified data (D); E-H: Positive (brown) IL-32 expression in gastric cancer tissues from patients aged < 60 (E) vs > 60 (F) years and noncancerous tissues (G), and quantified data (H); I-L: Positive (brown) IL33 expression in gastric cancer tissues from patients aged < 60 (I) vs > 60 (J) years and noncancerous tissues (K) plus quantified data (L). IL-32 and IL-33 were all decreased in the group of gastric cancer patients aged less than or equal to 60 years. aP < 0.01; bP < 0.01; cP < 0.0001; dP < 0.01; eP < 0.0001; fP < 0.05; gP < 0.05. IL: Interleukin.
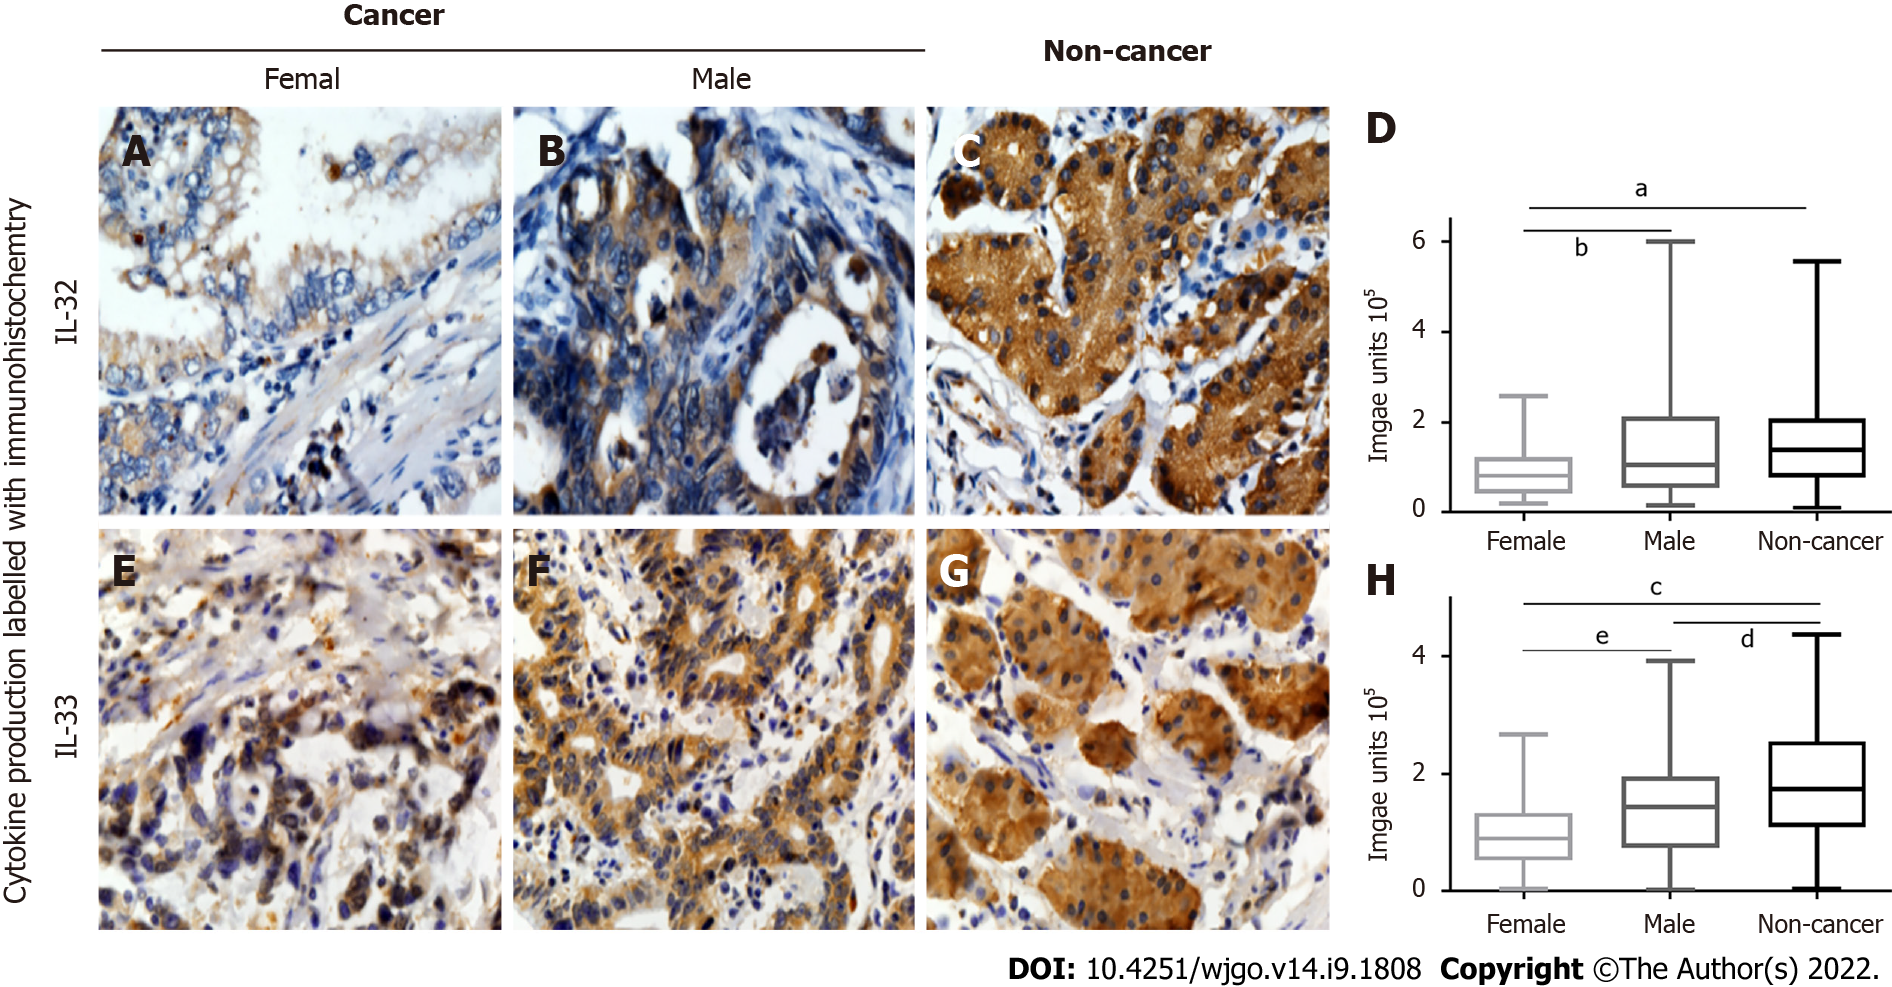
Figure 4 Correlation of interleukin-32 and interleukin-33 expression with sex.
A-D: Positive (brown) interleukin (IL)-32 expression in gastric cancer tissues from female (A) vs male (B) patients and noncancerous tissues (C) plus quantified data (D); E-H: Positive (brown) IL-33 expression in gastric cancer tissues from female (E) vs male (F) patients and noncancerous tissues (G) plus quantified data (H). IL-32 and IL-33 both decreased in female patients with gastric cancer. aP < 0.001; bP < 0.05; cP < 0.0001; dP < 0.01; eP < 0.05. IL: Interleukin.
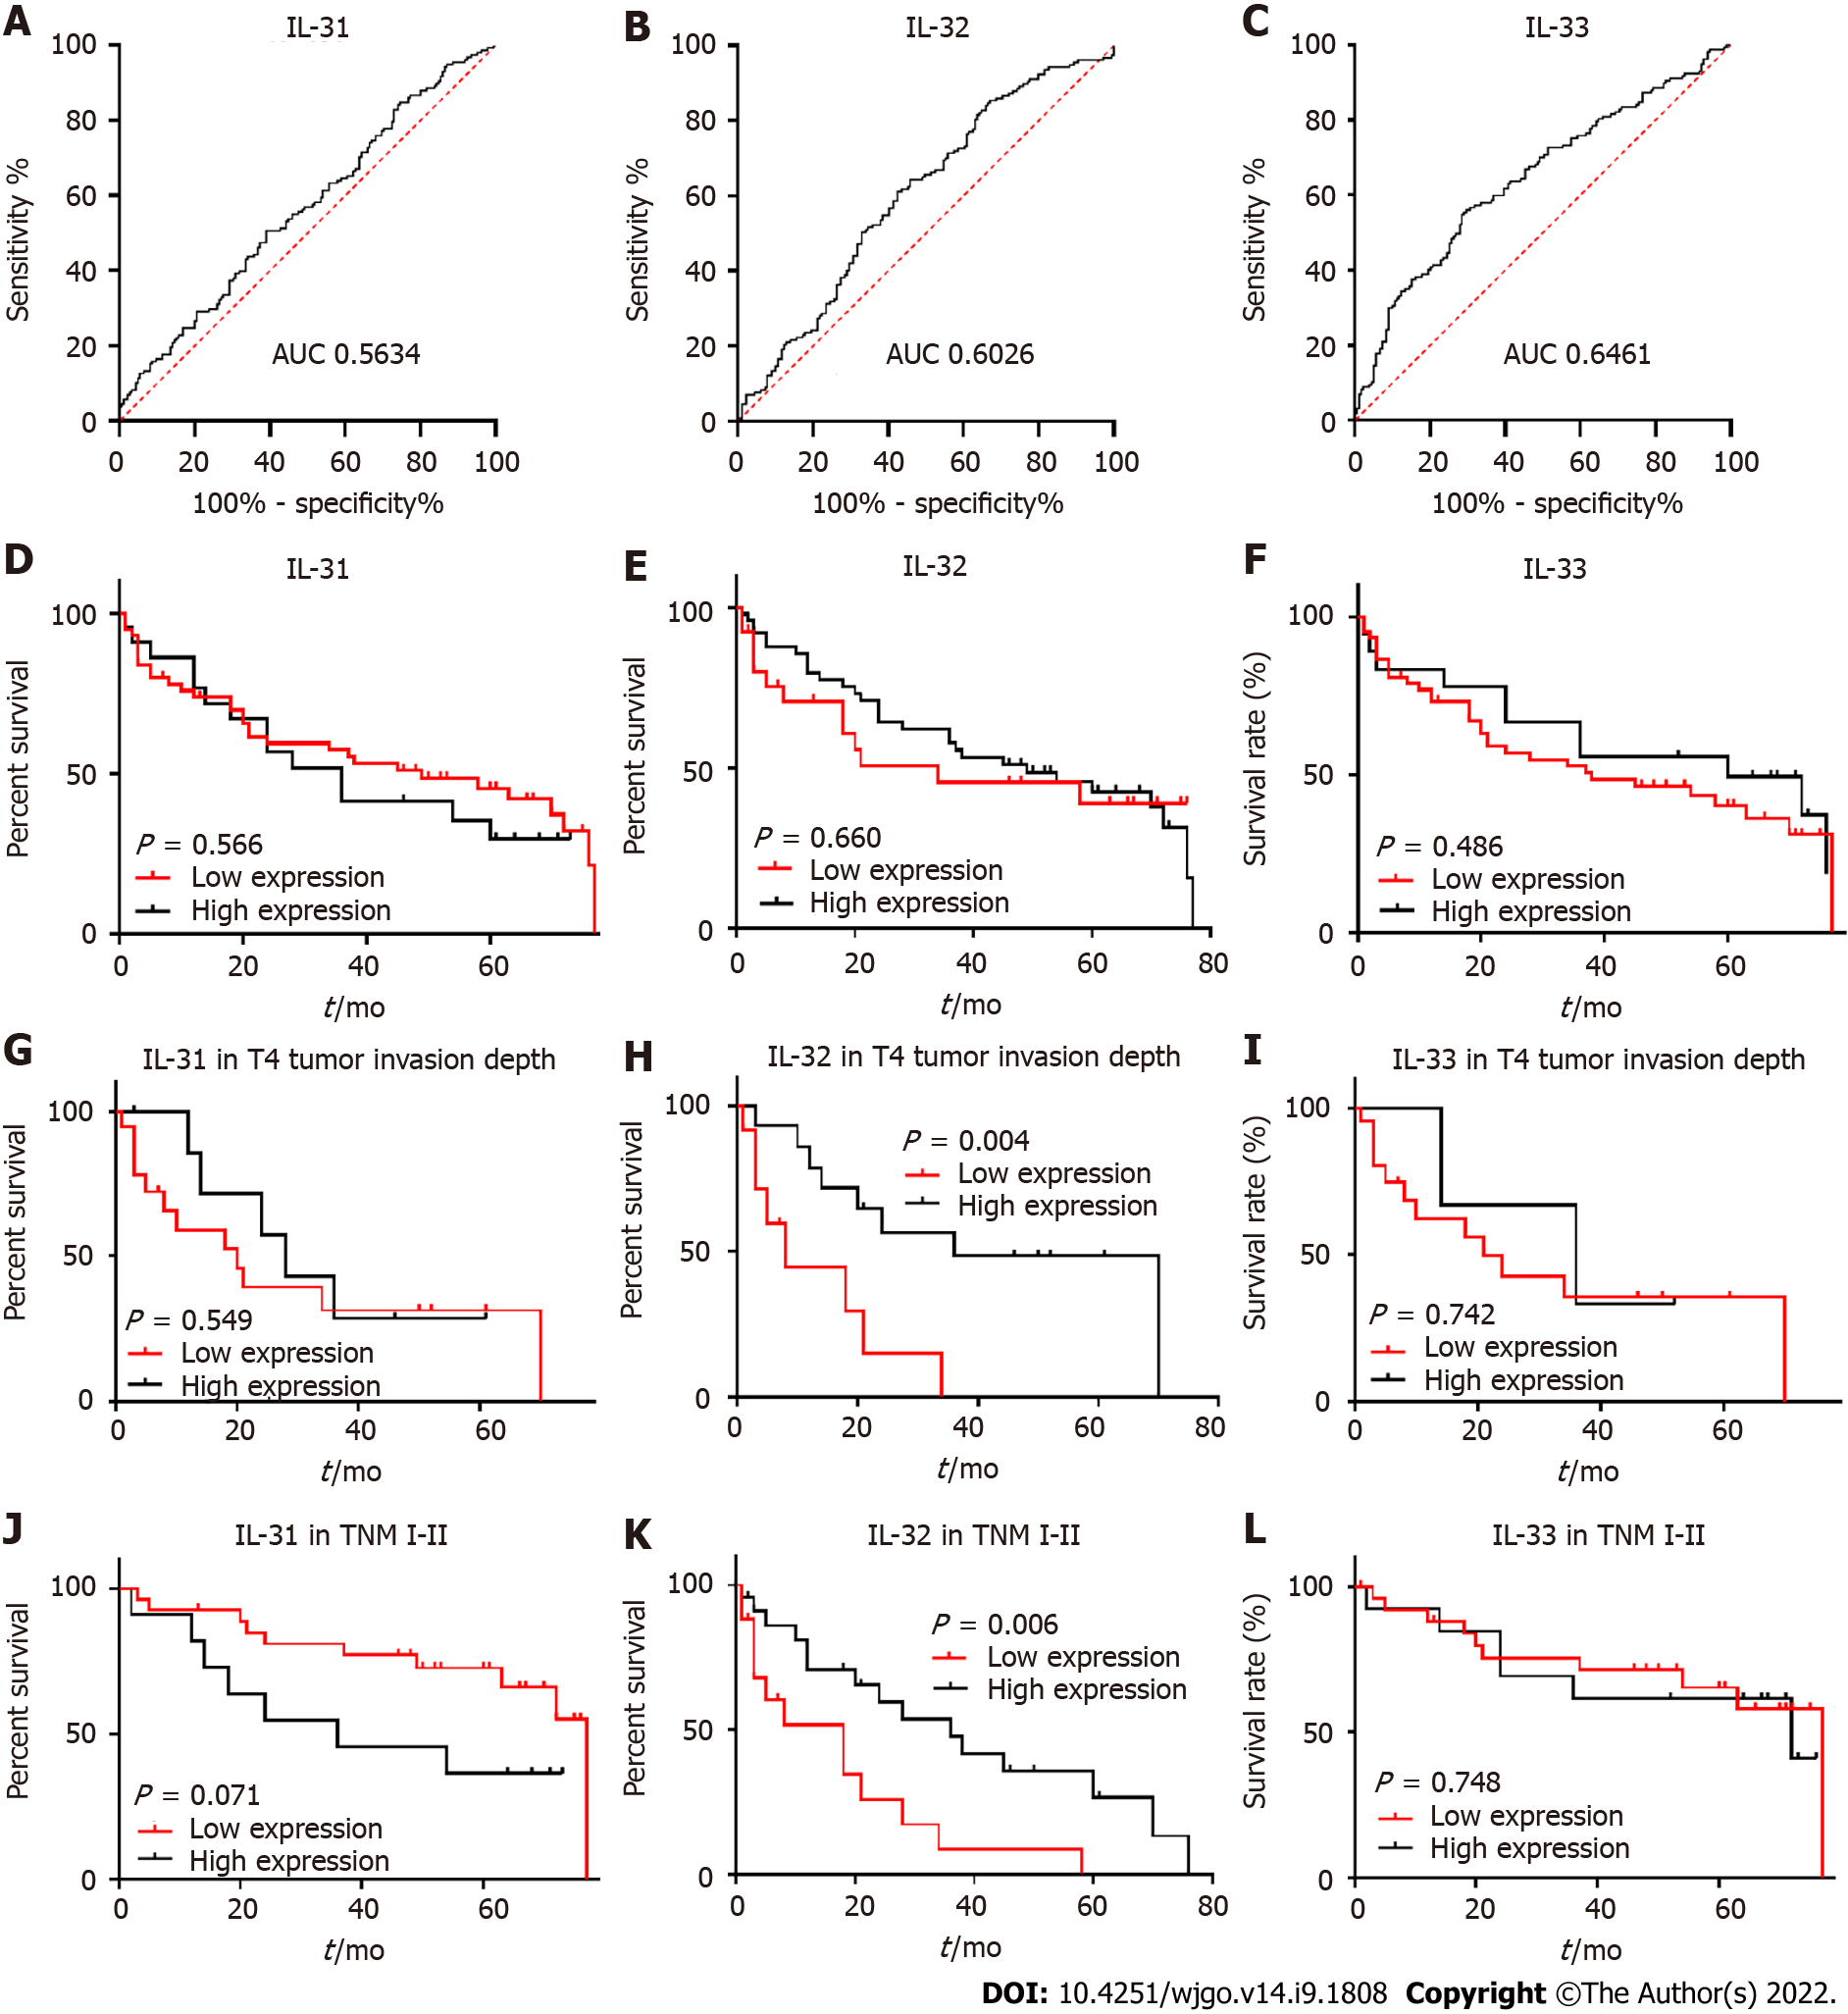
Figure 5 Receiver operating characteristic curves, correlation of interleukin-31, interleukin-32, and interleukin-33 with prognosis of gastric cancer, and subgroup analysis for patients at T4 stage and TNM stage I-II.
A-C: The specificity (X-axis) vs sensitivity (Y-axis) of interleukin (IL)-31 (A), IL-32 (B), and IL-33 (C); D-F: Comparison of 5-year survival rate between patients with high and low IL-31 (D), IL-32 (E), and IL-33 (F) expression; G-I: Comparison of 5-year survival rate between patients with high and low IL-31 (G), IL-32 (H), and IL-33 (I) expression in the T4 subgroup; J-L: Comparison of 5-year survival rate between patients with high and low IL-31 (J), IL-32 (K), abd IL-33 (L) expression in the TNM stage 2 subgroup. ROC curves analysis displayed the poor diagnostic potential of IL-31, IL-32, and IL-33 expression for GC. The cut-off point and area under the curve were: IL-31: 1.486 × 10⁶, area under the curve (AUC) = 0.563; IL-32: 64893, AUC = 0.603; IL-33: 166291, AUC = 0.646. Kaplan-Meier survival analysis of GC patients showed that decreased IL-32 expression correlated with a poor survival of GC patients in the T4 and TNM I-II subgroups. IL: Interleukin; AUC: Area under the curve.
- Citation: Liu QH, Zhang JW, Xia L, Wise SG, Hambly BD, Tao K, Bao SS. Clinical implications of interleukins-31, 32, and 33 in gastric cancer. World J Gastrointest Oncol 2022; 14(9): 1808-1822
- URL: https://www.wjgnet.com/1948-5204/full/v14/i9/1808.htm
- DOI: https://dx.doi.org/10.4251/wjgo.v14.i9.1808


