Copyright
©The Author(s) 2022.
World J Gastrointest Oncol. Jul 15, 2022; 14(7): 1265-1280
Published online Jul 15, 2022. doi: 10.4251/wjgo.v14.i7.1265
Published online Jul 15, 2022. doi: 10.4251/wjgo.v14.i7.1265
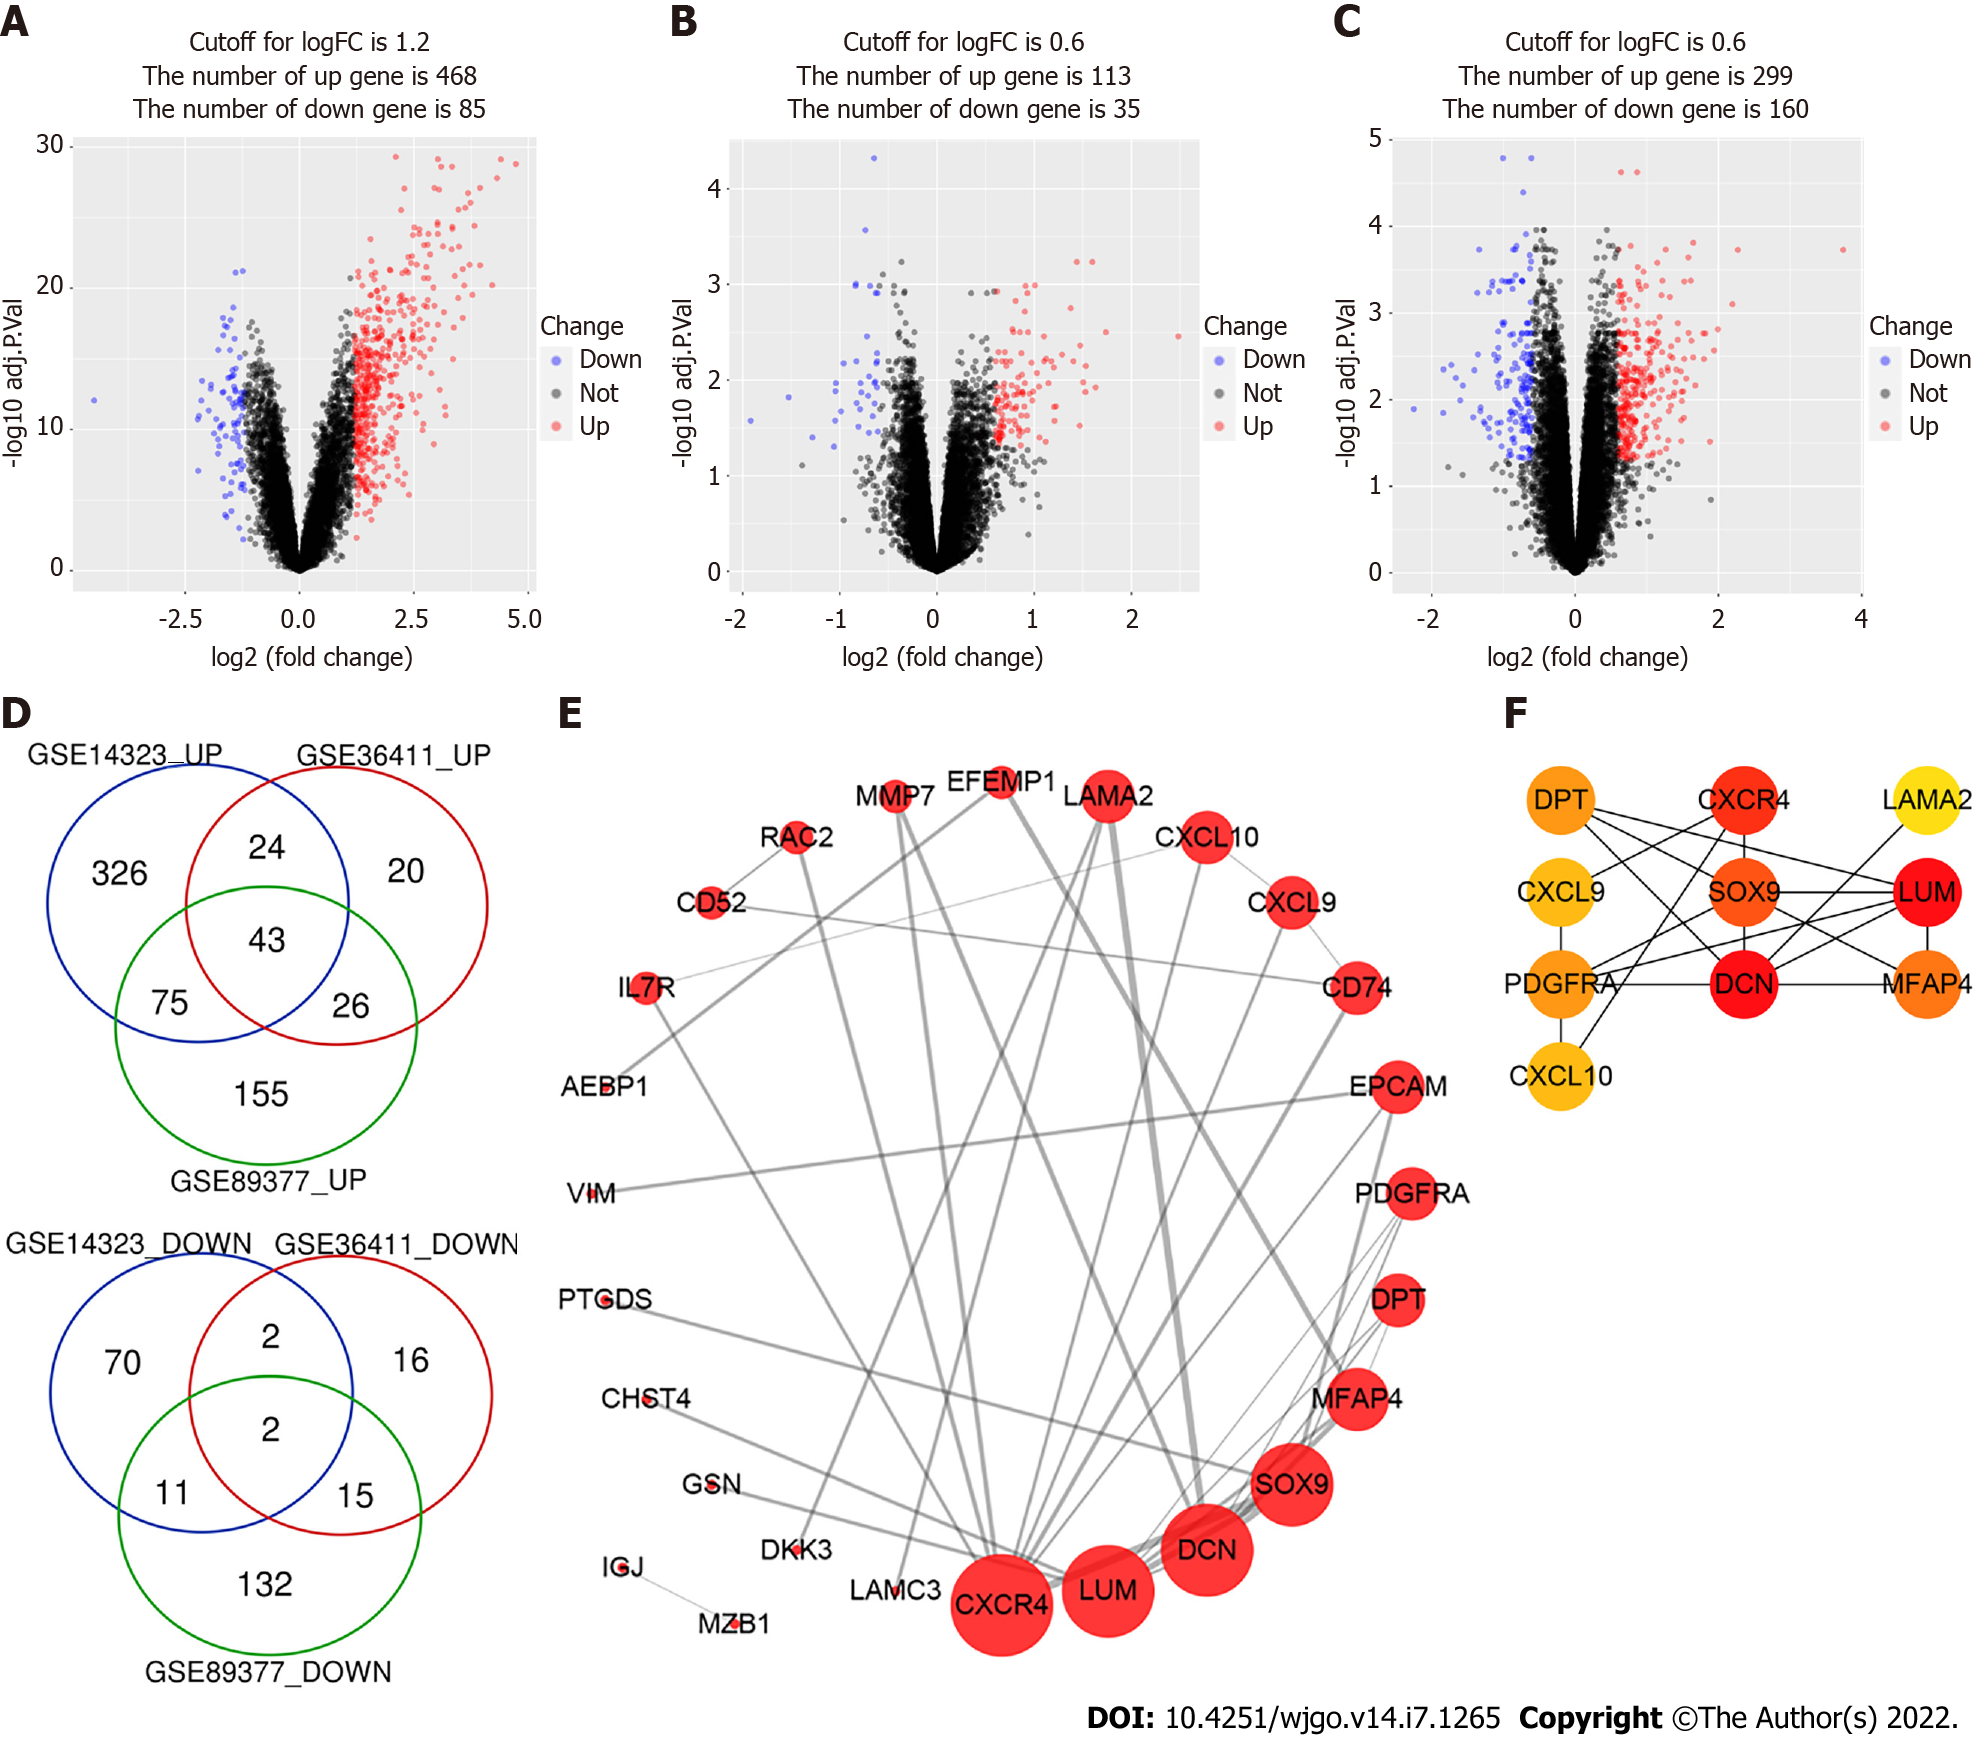
Figure 1 Identification of differentially expressed genes.
A-C: The volcano plots of GSE14323, GSE36411 and GSE89377. The red dots and blue dots represent up-regulated and downregulated genes, respectively; D: The Venn diagram software identified 45 common differentially expressed genes (DEGs) in three datasets (GSE14323, GSE36411 and GSE89377), including 43 upregulated genes and 2 downregulated genes; E: protein-protein interaction network of DEGs was constructed by STRING online database and drew by Cytoscape software; F: Top 10 hub genes of DEGs were identified by cytoHubba plug-in of Cytoscape and their importance were represented by their color’s shade.
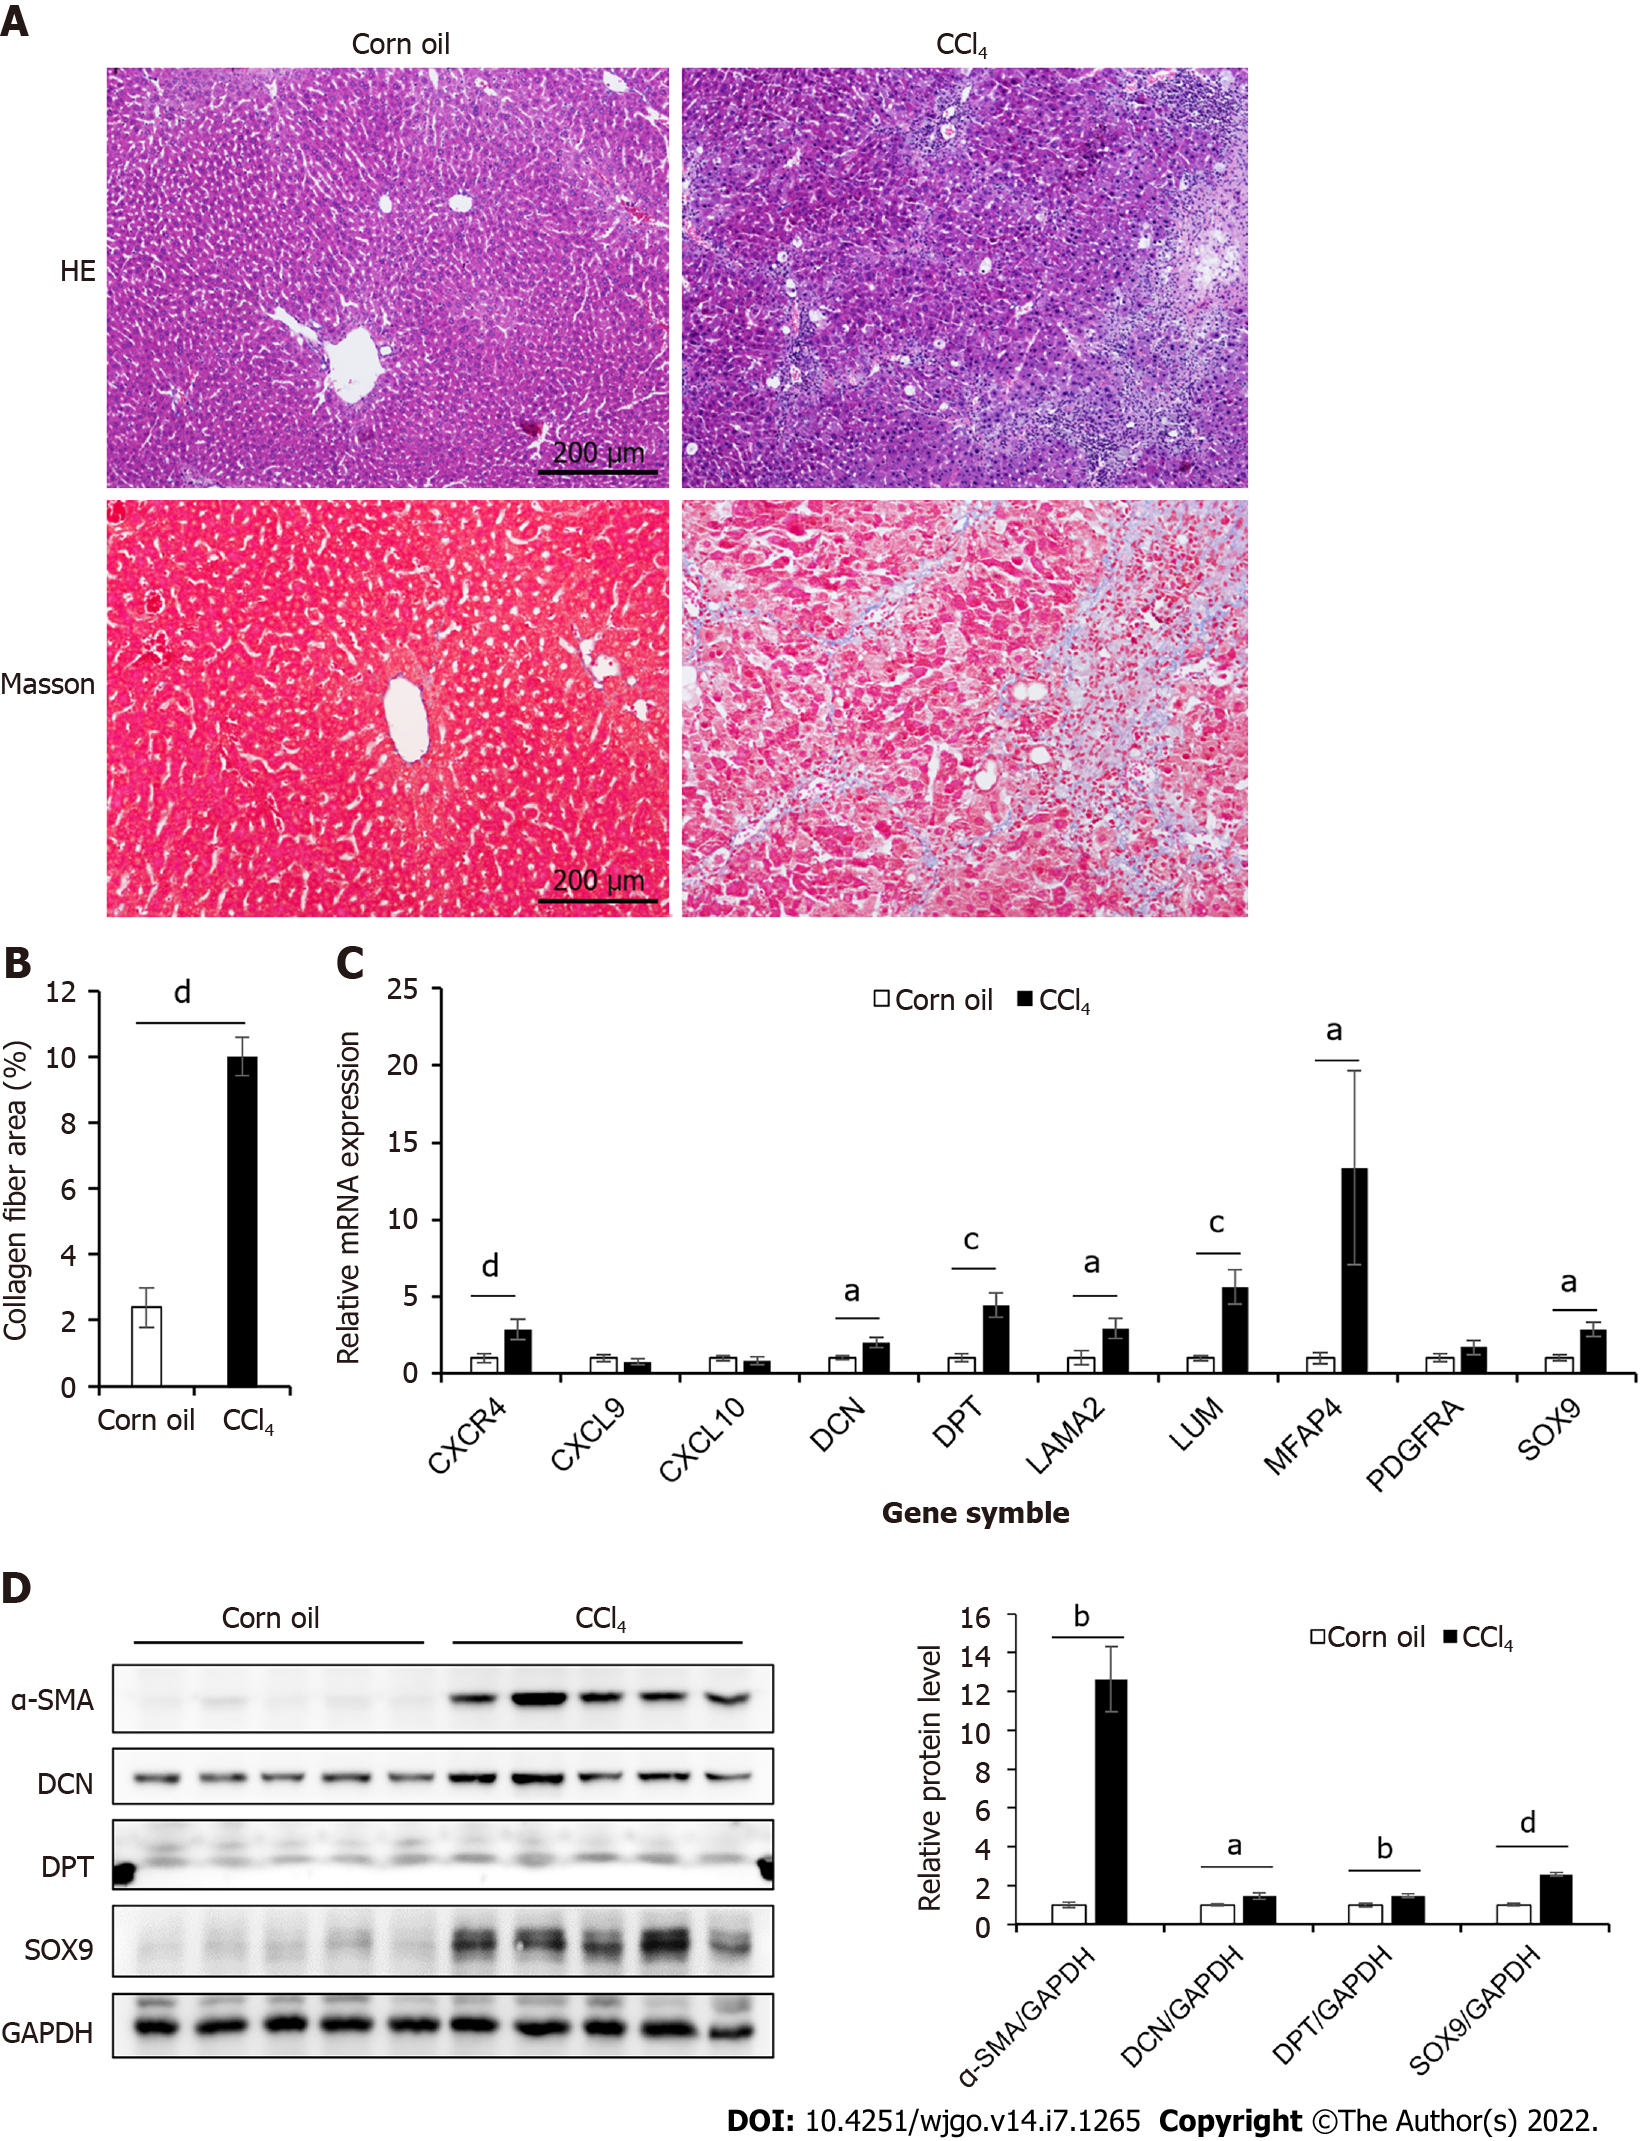
Figure 2 Expression of hub genes in the liver tissue of CCl4-induced mouse mice.
A: Masson’s trichrome and HE staining of control and CCl4-induced liver cirrhosis mouse liver tissues; B: Collagen area in Masson’s trichrome staining (n = 7 or 8); C: The mRNA expression levels of 10 hub genes of control and CCl4-induced cirrhosis mouse liver tissues (n = 6); D: The protein expression levels of α-SMA, Decorin (DCN), Dermatopontin (DPT), and SRY-box transcription factor 9 (SOX9) in liver tissues of mice in two groups. The right panel showed the result of quantitative analysis (n = 4). All data were presented as mean ± SE. Two-tailed Student’s t test were performed. aP < 0.05, bP < 0.01, cP < 0.001, dP < 0.0001.
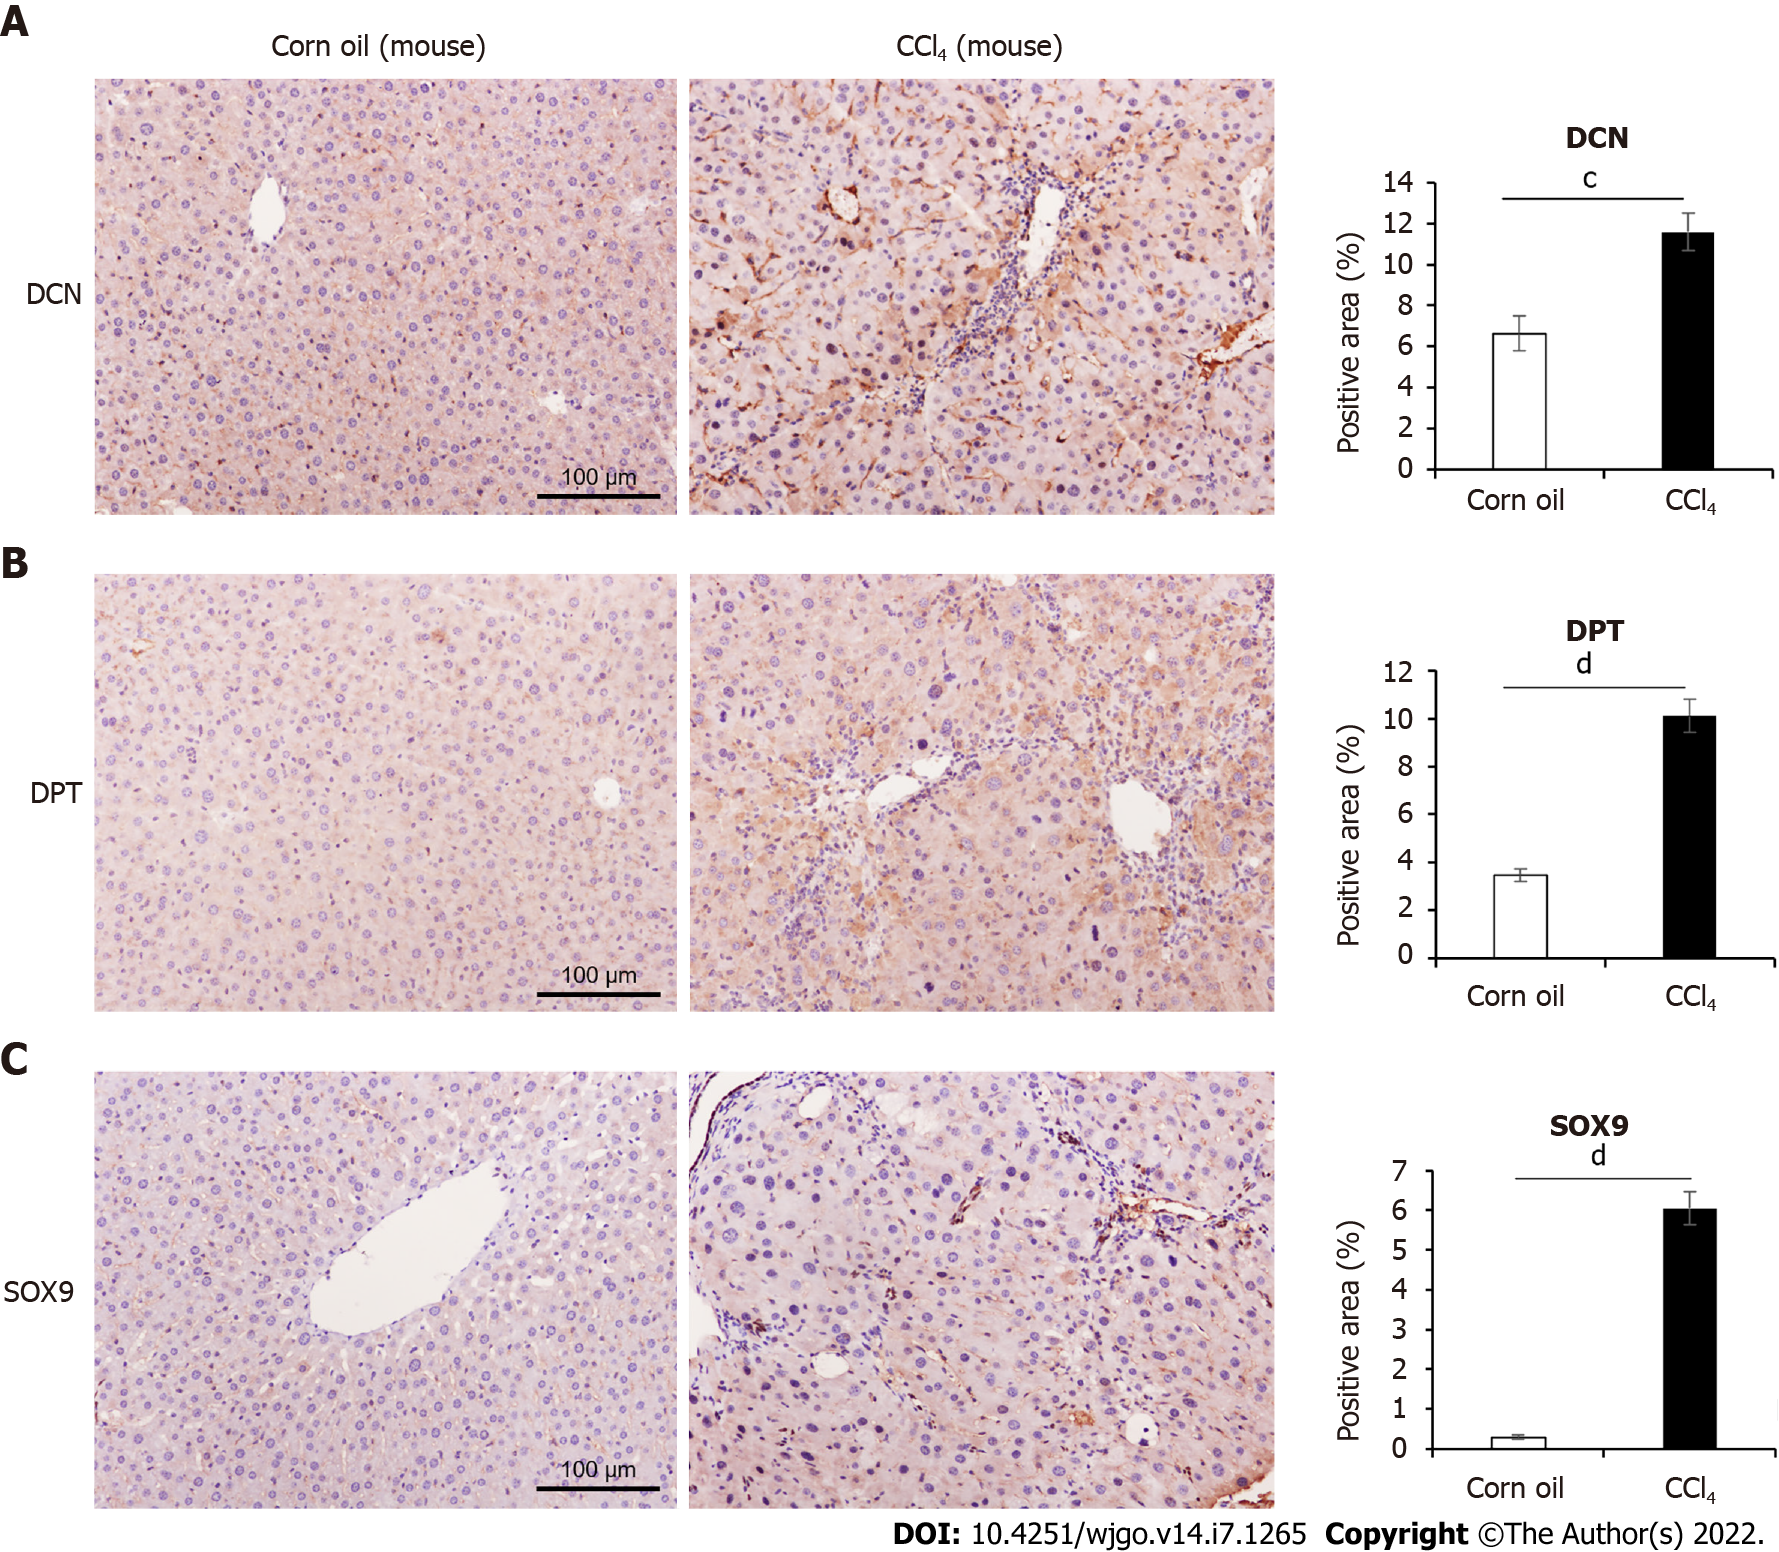
Figure 3 Comparison of decorin, dermatopontin, and SRY-box transcription factor 9 expression in CCl4-induced mouse model.
A: Immunohistochemical (IHC) analyses of the expression of Decorin (DCN) and the percentage of positive area were shown, n = 9 or 11; B: IHC analyses of the expression of Dermatopontin (DPT) and the percentage of positive area were shown (n = 9 or 10); C: IHC analyses of the expression of SRY-box transcription factor 9 (SOX9) and the percentage of positive area were shown (n = 9 or 10). All data were presented as mean ± SE. Two-tailed Student’s t test were performed. cP < 0.001, dP < 0.0001.
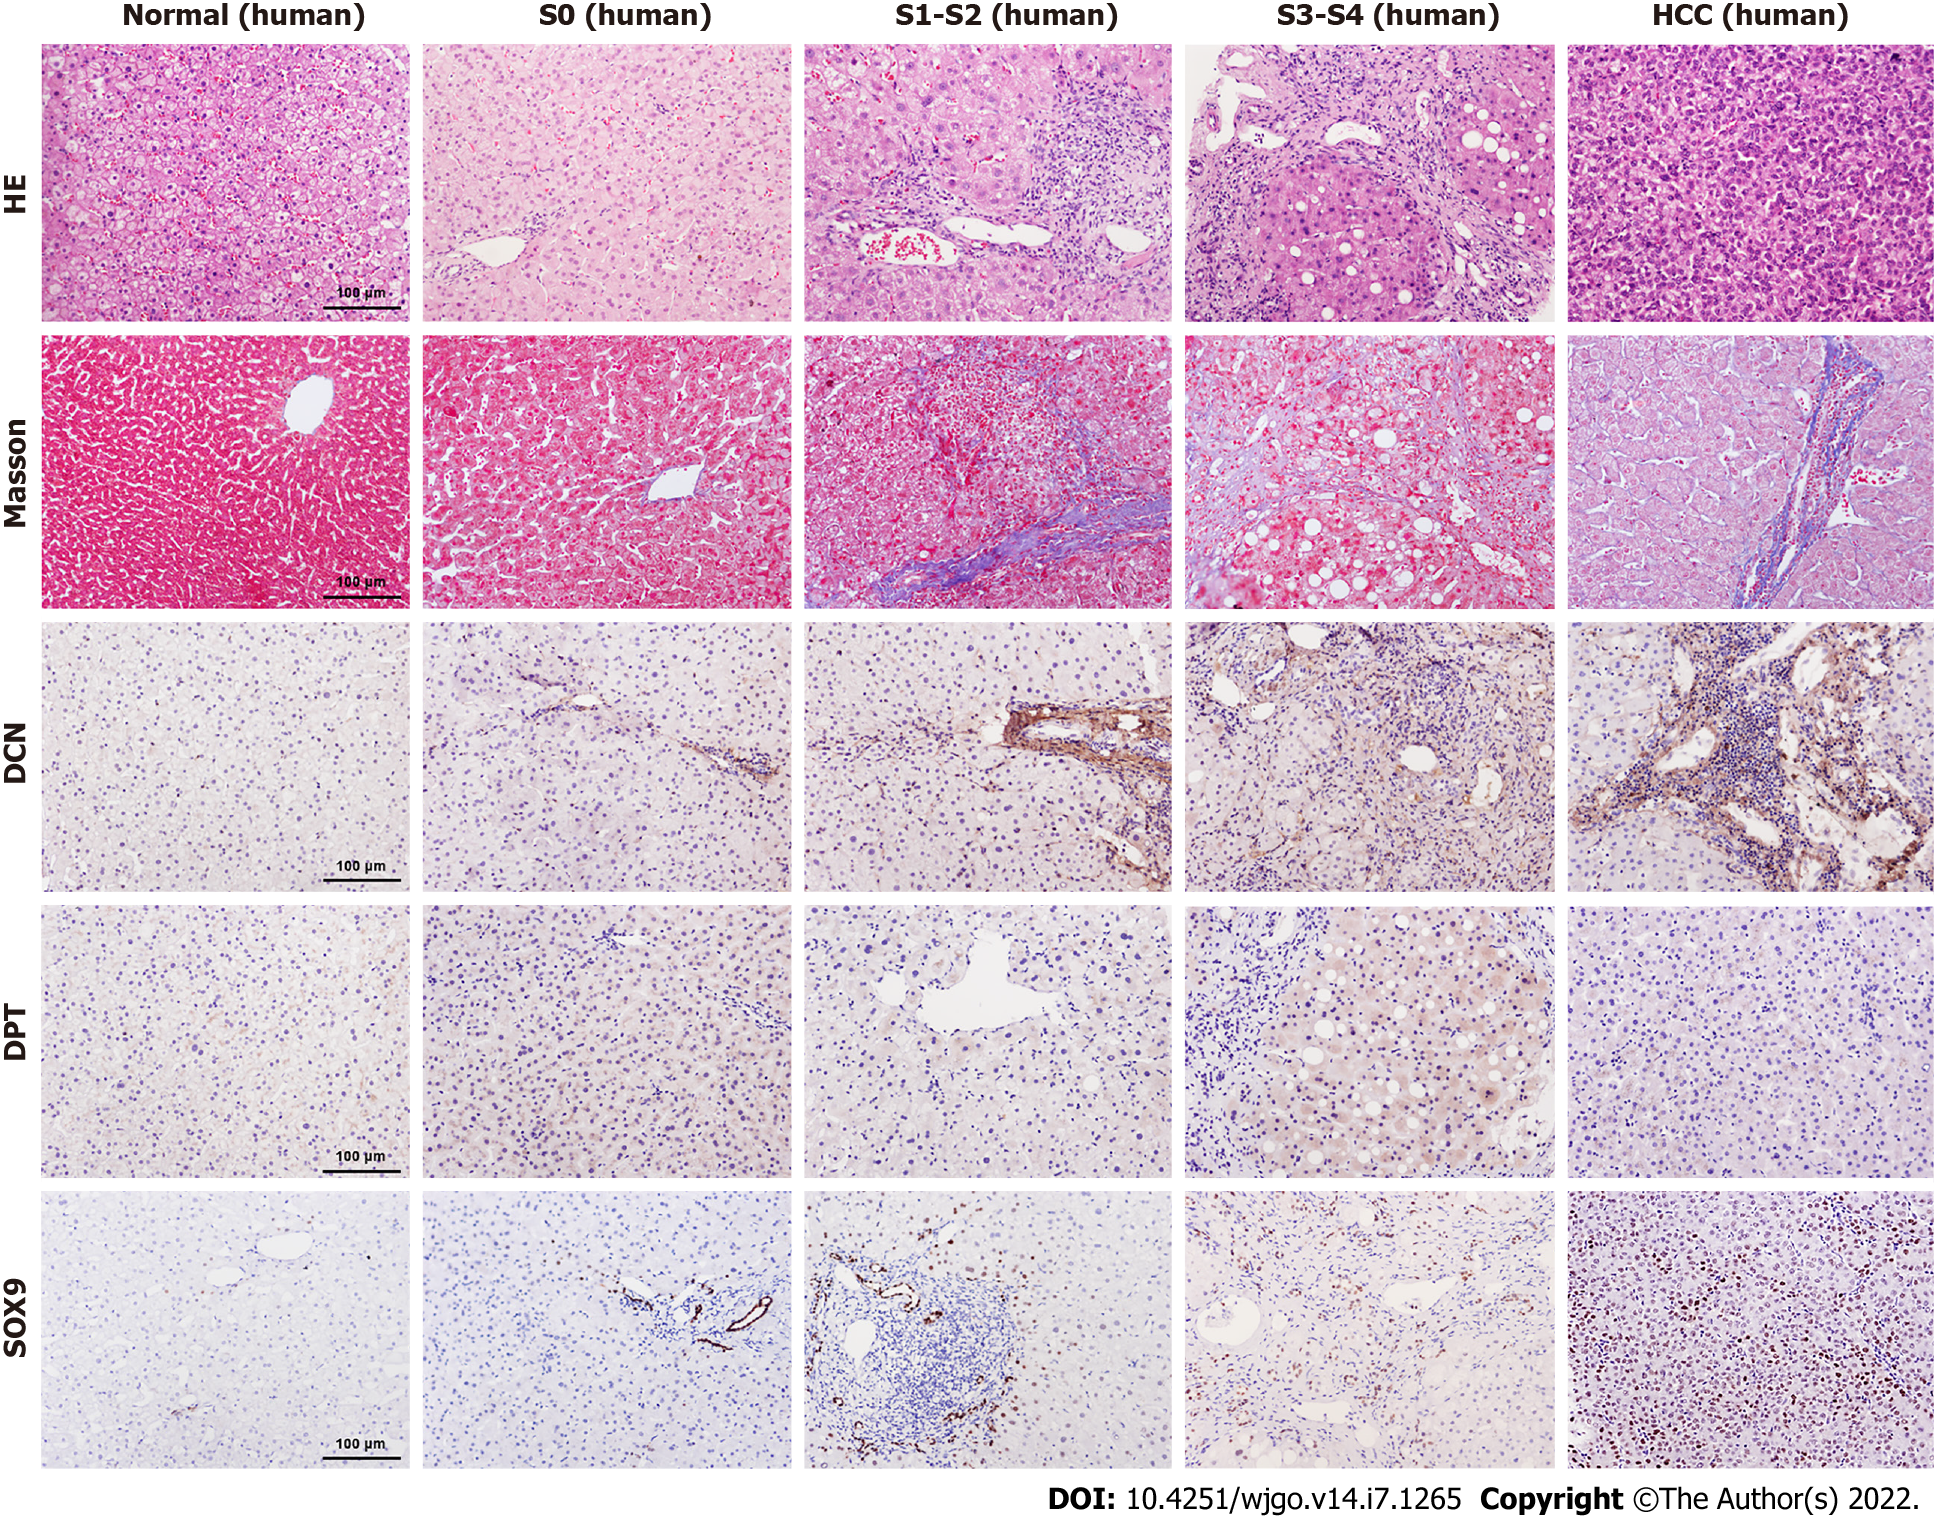
Figure 4 Comparison of decorin, dermatopontin, and SRY-box transcription factor 9 expression in human liver tissues.
The expression levels of Decorin (DCN), Dermatopontin (DPT) and SRY-box transcription factor 9 (SOX9) in normal, S0, S1-S2, S3-S4, Hepatocellular carcinoma (HCC) groups were analyzed by immunohistochemistry. The H&E staining and Masson’s trichrome staining were shown also.
Figure 5 Expression levels analysis of decorin, dermatopontin, and SRY-box transcription factor 9 in human liver tissues.
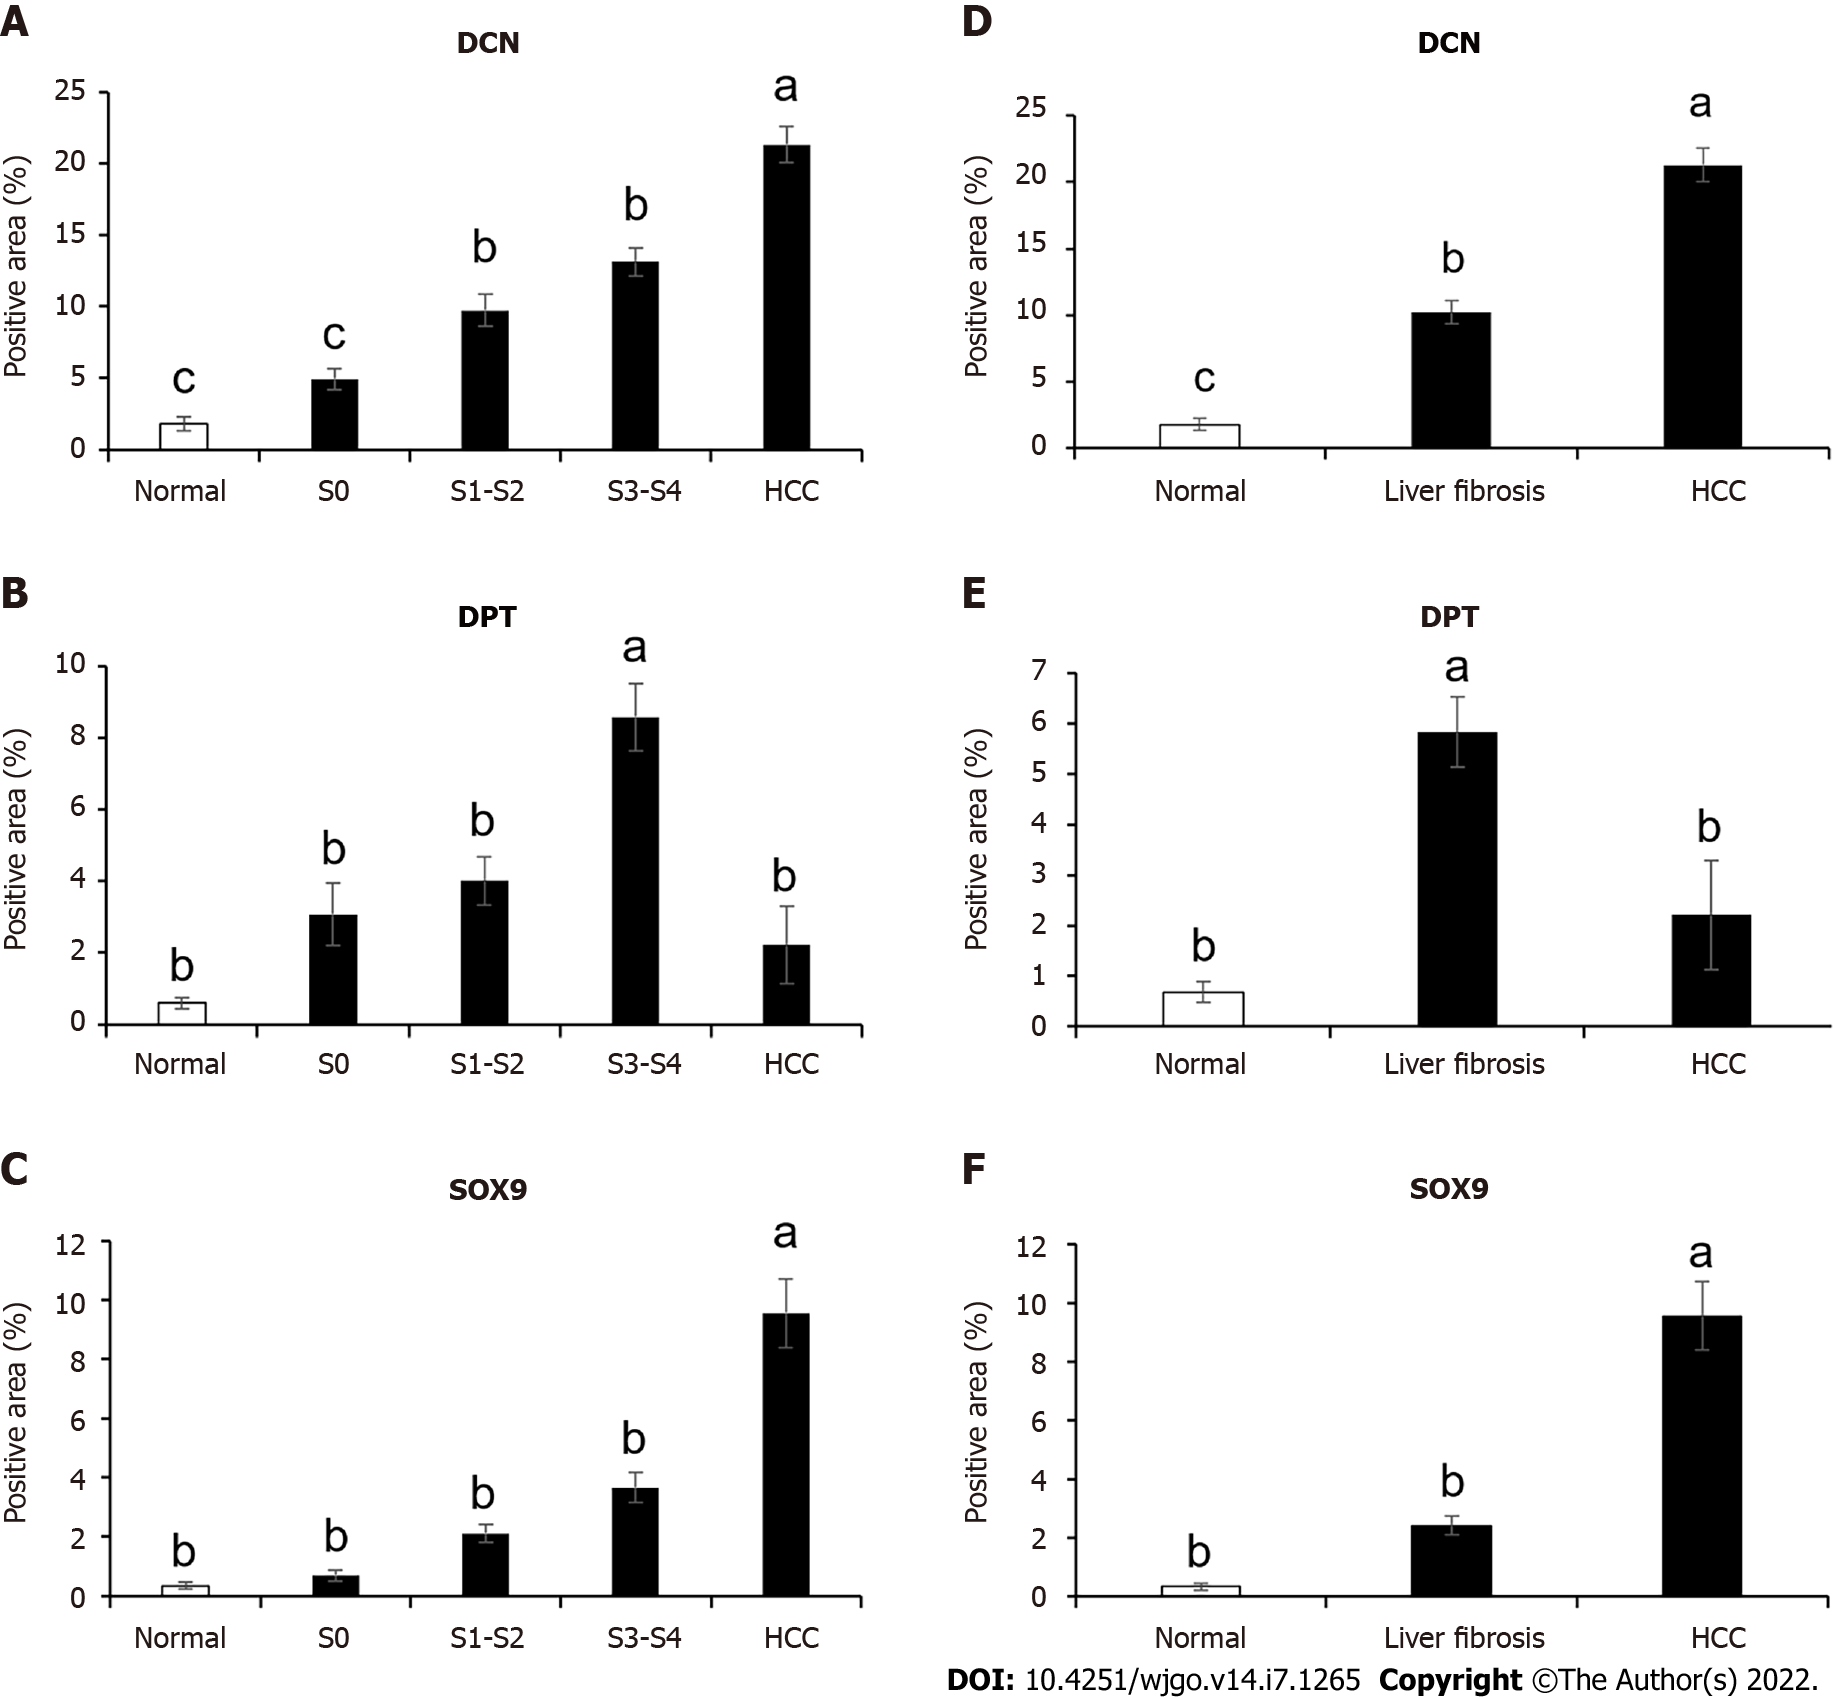
A-C: The percentage of positive area of decorin (DCN) , dermatopontin (DPT) and SRY-box transcription factor 9 (SOX9) among normal (n = 5 or 7), S0 (n = 3 or 4), S1-S2 (n = 10 or 12), S3-S4 (n = 8, 9 or 11) and hepatocellular carcinoma (HCC) (n = 11, 12 or 14) groups were counted; D-F: The percentage of positive area of DCN , DPT and SOX9 in normal (n = 5 or 7), liver fibrosis (n = 22, 23 or 26) and HCC (n = 11, 12 or 14) groups were counted. All data were presented as mean ± SE.One-way ANOVA with multiple comparisons and Tukey’s post-test were performed, aP < 0.05, bP < 0.01, cP < 0.001.
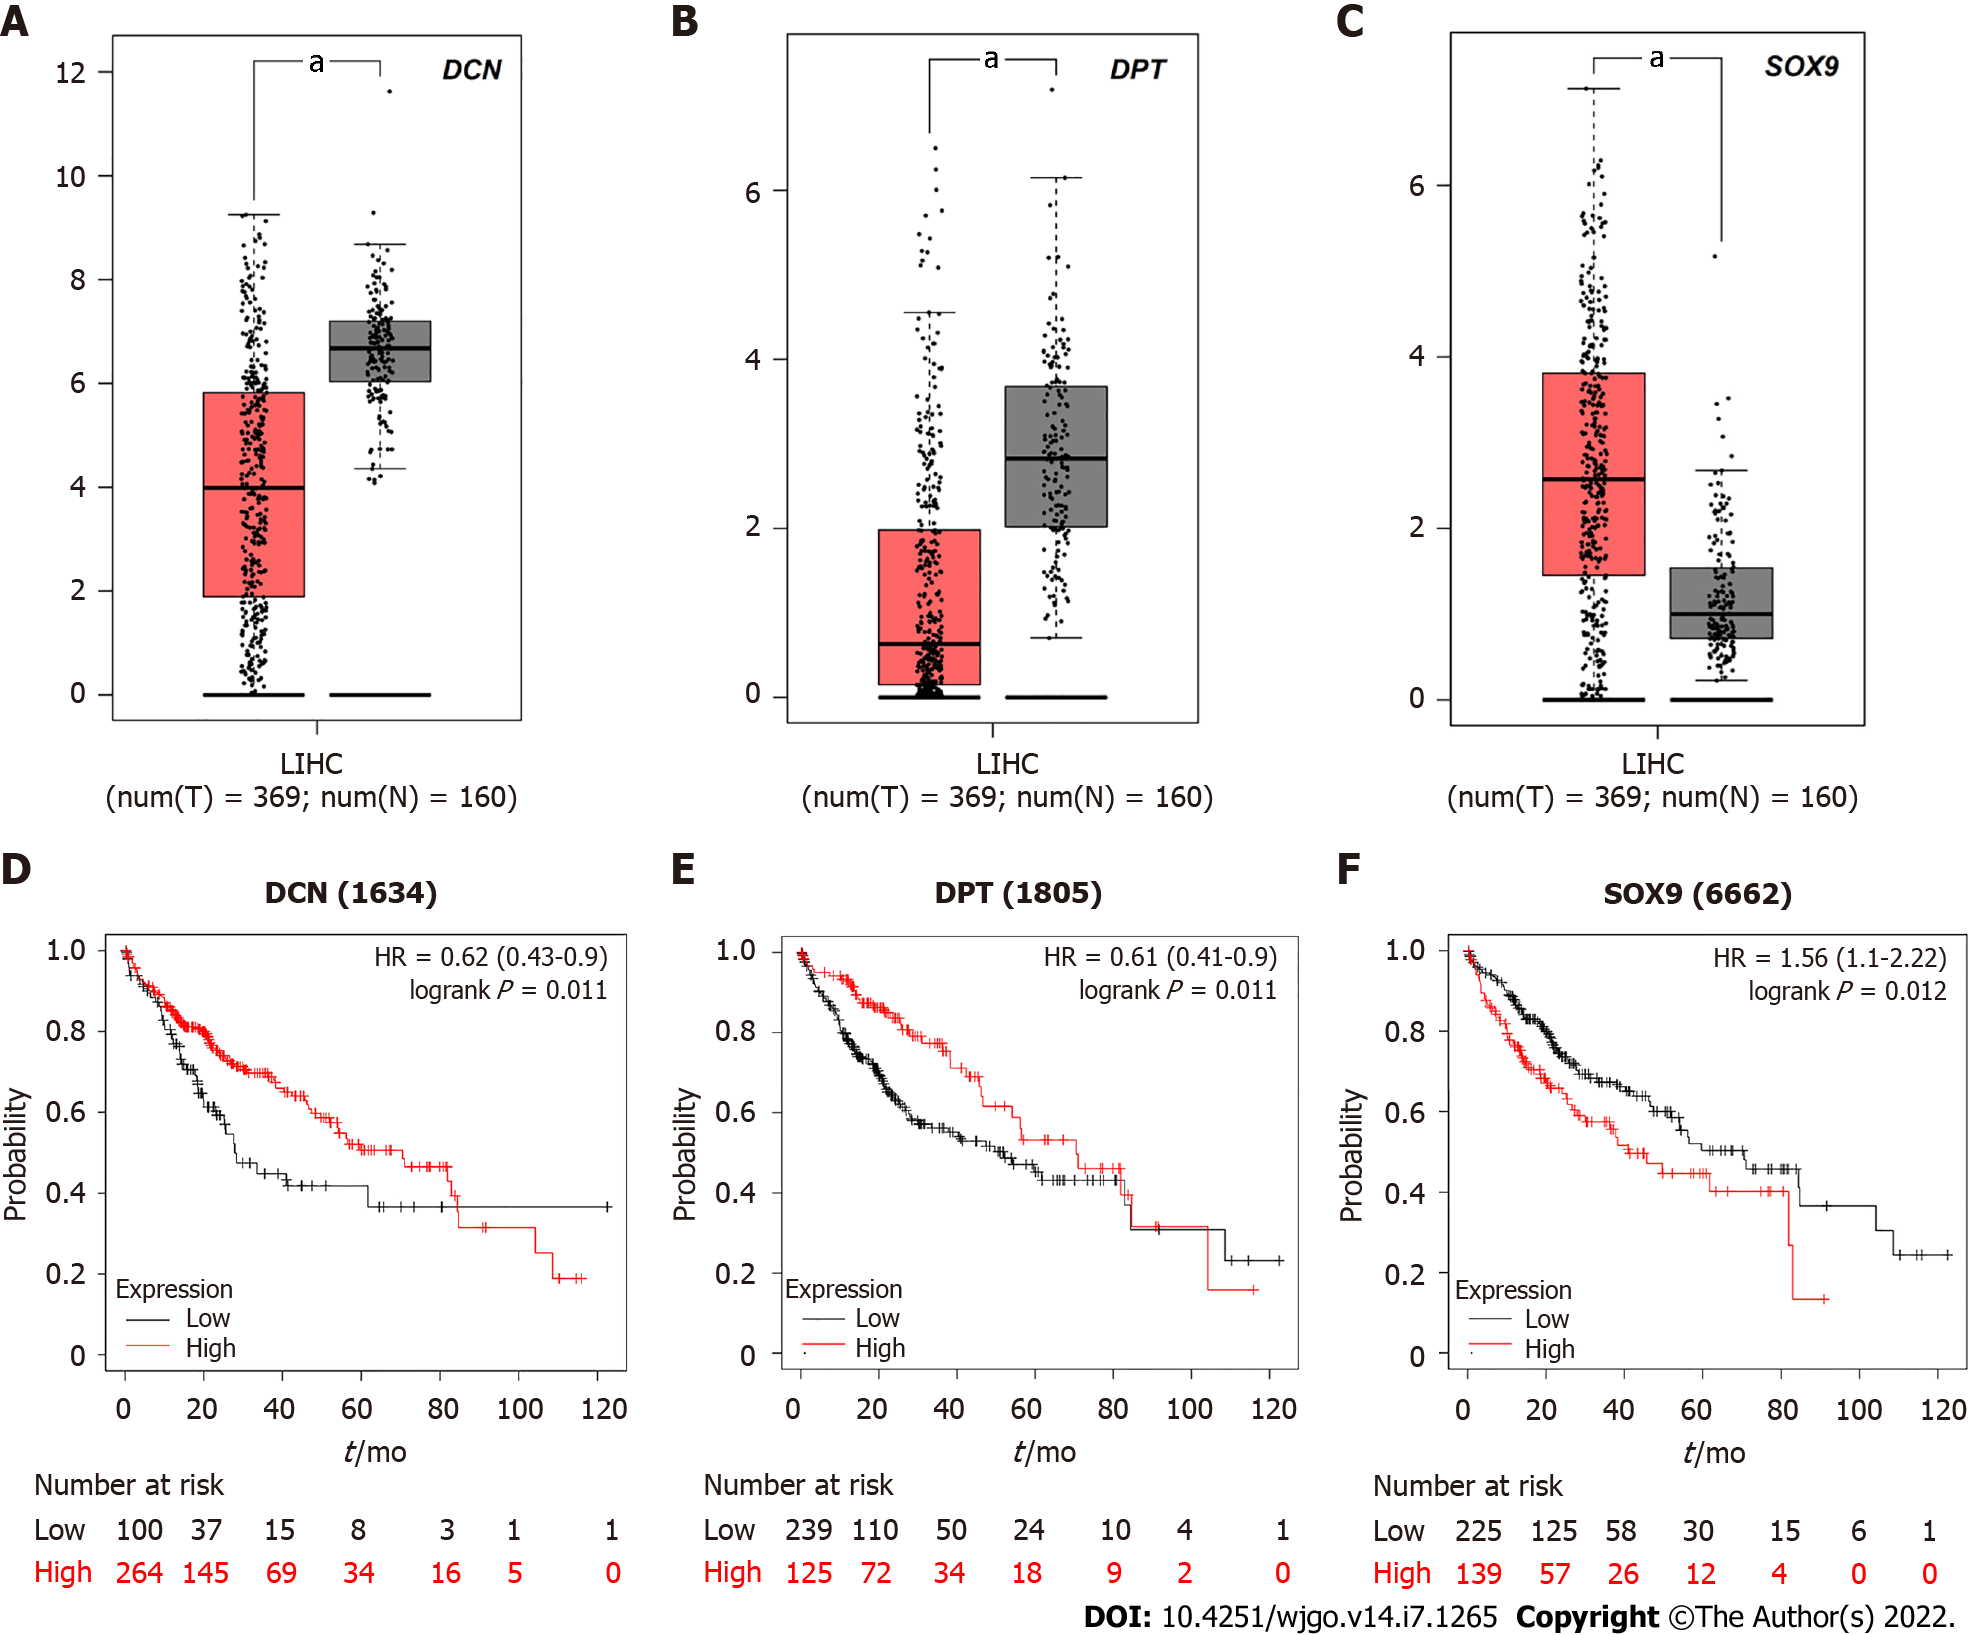
Figure 6 The relationship between decorin, dermatopontin, SRY-box transcription factor 9 expression and survival rate of hepatocellular carcinoma patients.
A-C: Decorin (DCN), dermatopontin (DPT), and SRY-box transcription factor 9 (SOX9) were analyzed by gene expression profiling interactive analysis server (GEPIA) to determine their expression level differences between hepatocellular carcinoma (HCC) and normal liver tissues. Red box represents tumor tissue and gray box represents normal tissue; D-F: Prognostic information of hub genes. Kaplan-Meier plotter online tool was used to identify the prognostic information of DCN, DPT and SOX9, which associated with the survival rate of HCC patients (aP < 0.05).
- Citation: Li Y, Yuan SL, Yin JY, Yang K, Zhou XG, Xie W, Wang Q. Differences of core genes in liver fibrosis and hepatocellular carcinoma: Evidence from integrated bioinformatics and immunohistochemical analysis. World J Gastrointest Oncol 2022; 14(7): 1265-1280
- URL: https://www.wjgnet.com/1948-5204/full/v14/i7/1265.htm
- DOI: https://dx.doi.org/10.4251/wjgo.v14.i7.1265


