Copyright
©The Author(s) 2019.
World J Gastrointest Oncol. Aug 15, 2019; 11(8): 599-621
Published online Aug 15, 2019. doi: 10.4251/wjgo.v11.i8.599
Published online Aug 15, 2019. doi: 10.4251/wjgo.v11.i8.599
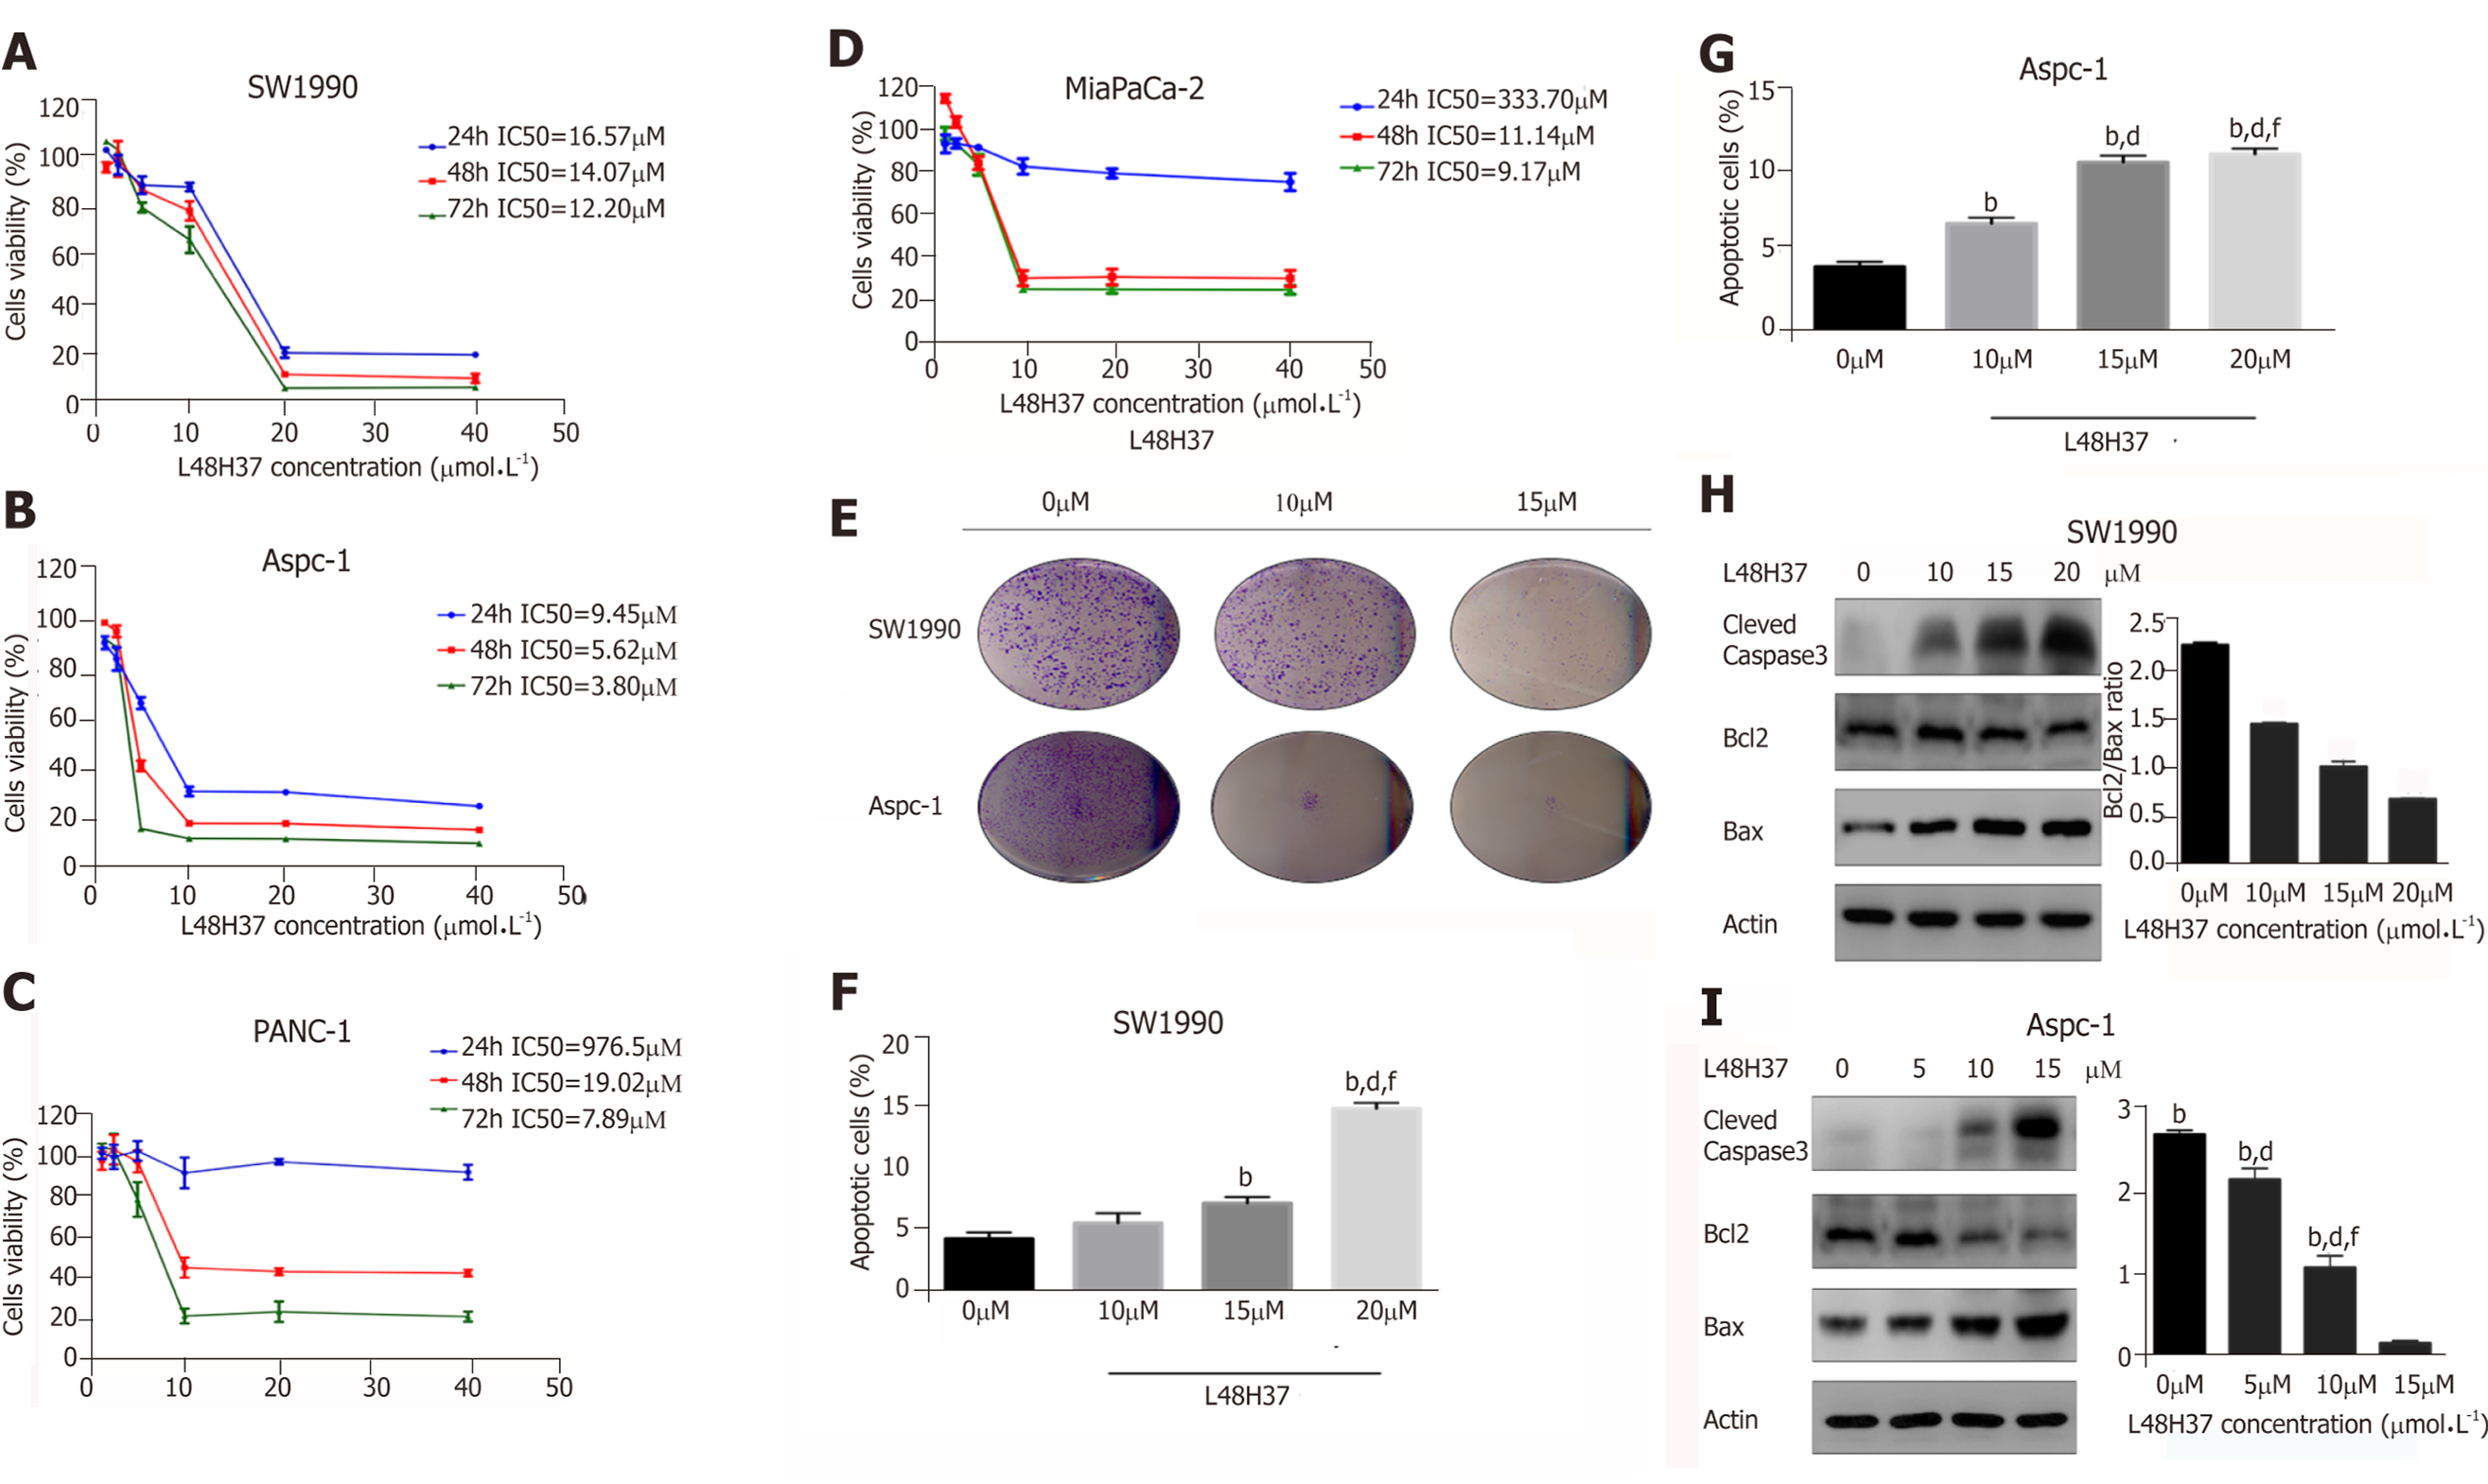
Figure 1 L48H37 inhibits proliferation and promotes apoptosis in pancreatic cancer cells.
A-D: Percentage of viable SW1990, ASPC-1, PANC-1 and MIA PaCa2 cells incubated with different concentrations of L48H37 (1.25, 2.5, 5, 10, 20 and 40 μmol/L) or DMSO (negative control) for 24, 48 and 72 h. The IC50 values in the different cell lines are shown; E: Representative pictures of colonies from SW1990 and ASPC-1 cells treated with increasing concentrations of L48H37 for 24 h; F-G: SW1990 and Aspc-1 cells were treated with various concentrations of L48H37 for 24 h. Cell apoptosis was detected by flow cytometry. Histogram illustrating the rate of apoptosis cells. Data were expressed as mean ± SEM; F: bP < 0.01 vs L48H37 (0 μmol/L) group. dP < 0.01 vs L48H37 (10 μmol/L) group. fP < 0.01 vs L48H37 (15 μmol/L) group; G: bP < 0.01 vs L48H37 (0 μmol/L) group; dP < 0.01 vs L48H37 (5 μmol/L) group. fP < 0.01 vs L48H37 (10 μmol/L) group; H-I: Western blotting showing expression levels of Cleaved caspase3, Bcl-2 and Bax proteins in SW1990 and Aspc-1 cells following treatment with DMSO or L48H37 for 12 h. Grayscale values of Bcl-2 and Bax were measured relative to β-actin, and the ratio of Bcl-2/Bax expression was calculated. Data were expressed as mean ± SEM; H: bP < 0.01 vs L48H37 (0 μmol/L) group. dP < 0.01 vs L48H37 (10 μmol/L) group. fP < 0.01 vs L48H37 (15 μmol/L) group; I: bP < 0.01 vs L48H37 (0 μmol/L) group. dP < 0.01 vs L48H37 (5 μmol/L) group. fP < 0.01 vs L48H37 (10 μmol/L) group.
Figure 2 L48H37 alters mitochondrial membrane potential, reactive oxygen species levels, cell cycle profile arrest and endoplasmic reticulum stress pathway in pancreatic ductal adenocarcinoma cells.
A, B: Representative images and FACS plots of SW1990 cells treated with 5, 10 and 15 μmol/L L48H37 and stained with JC-1 probe (200× magnification); C, E: Reactive oxygen species (ROS) generation induced by L48H37 within 12 h was measured in SW1990 and Aspc-1 cells by staining with DCFH-DA (25 μmol/L) for 30 min. ROS level was acquired by flow cytometry. Histogram showing the DCFH-DA geometric mean in cells treated with different L48H37 concentrations. Data were expressed as mean ± SEM; D: bP < 0.01 vs DMSO group. dP < 0.01 vs L48H37 (10 μmol/L) group; E: bP < 0.01 vs DMSO group. dP < 0.01 vs L48H37 (5 μM) group. eP < 0.05 vs L48H37 (10 μmol/L) group; F-H: SW1990 and Aspc-1 cells were harvested 24 h with L48H37 or DMSO, and then cycle distribution was assessed by Propidium Iodide staining. Histogram illustrating the rate of G2/M phase cells. Data were expressed as mean ± SEM; G: bP < 0.01 vs DMSO group. dP < 0.01 vs L48H37 (10 μmol/L) group. fP < 0.01 vs L48H37 (15 μmol/L) group; H: bP < 0.01 vs DMSO group. dP < 0.01 vs L48H37 (5 μmol/L) group; I-K: SW1990 cells were treated with L48H37 for the indicated times or treated with various concentrations of L48H37 or DMSO. The protein levels of p-PERK, PERK, p-EIF2α, EIF2α, ATF4, CHOP, cleaved caspase-9, and cleaved caspase-8 were analyzed by Western blot. β-actin was used as an internal control.
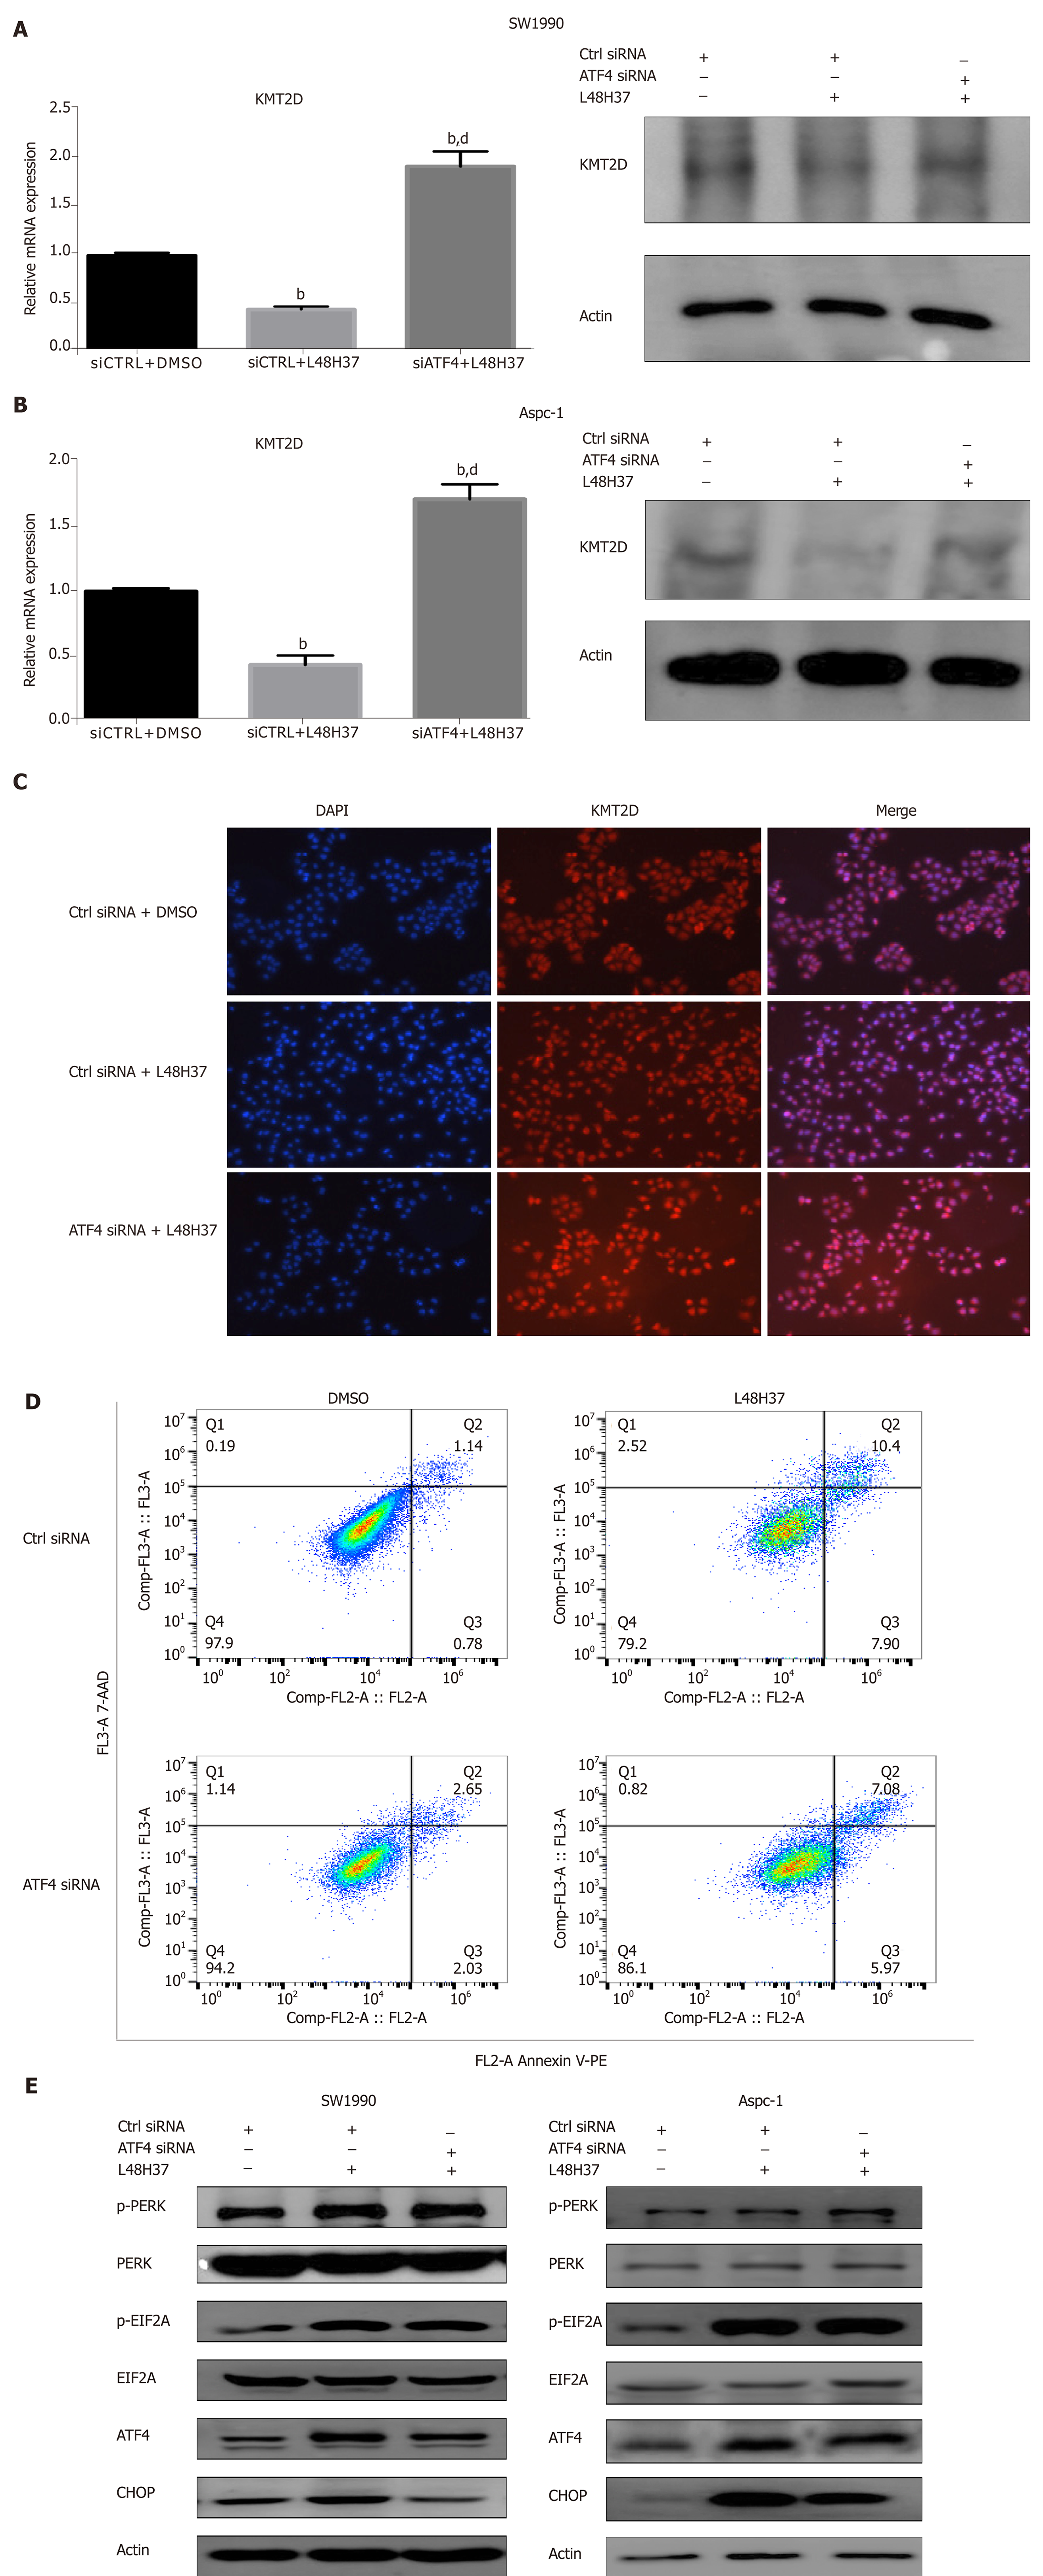
Figure 3 ATF-4 knockdown attenuates L48H37-induced apoptosis and upregulates KMT2D.
A, B: KMT2D mRNA and protein levels in the control and ATF-4-knockdown SW1990 and ASPC-1 cells treated with 15 µM L48H37 for 12 h. β-actin was used as an internal control. Data were expressed as mean ± SEM. bP < 0.01 vs siCTRL + DMSO group. dP < 0.01 vs siCTRL + L48H37 group; C: Representative IF image showing KMT2D expression in control and ATF4-knockdown SW1990 cells treated with L48H37; D: FACS plot showing apoptosis in control and ATF4 knockdown SW1990 cells treated with L48H37; E, F: Western blotting showing levels of p-PERK, PERK, p-EIF2α, EIF2α, ATF4 and CHOP in control and ATF4 knockdown SW1990 cells treated with L48H37. β-actin was used as an internal control. PERK: Protein kinase RNA-like endoplasmic reticulum kinase; EIF2A: Eukaryotic initiation factor 2α; ATF-4: Activating transcription factor-4; CHOP: Enhancer-binding protein-homologous protein.
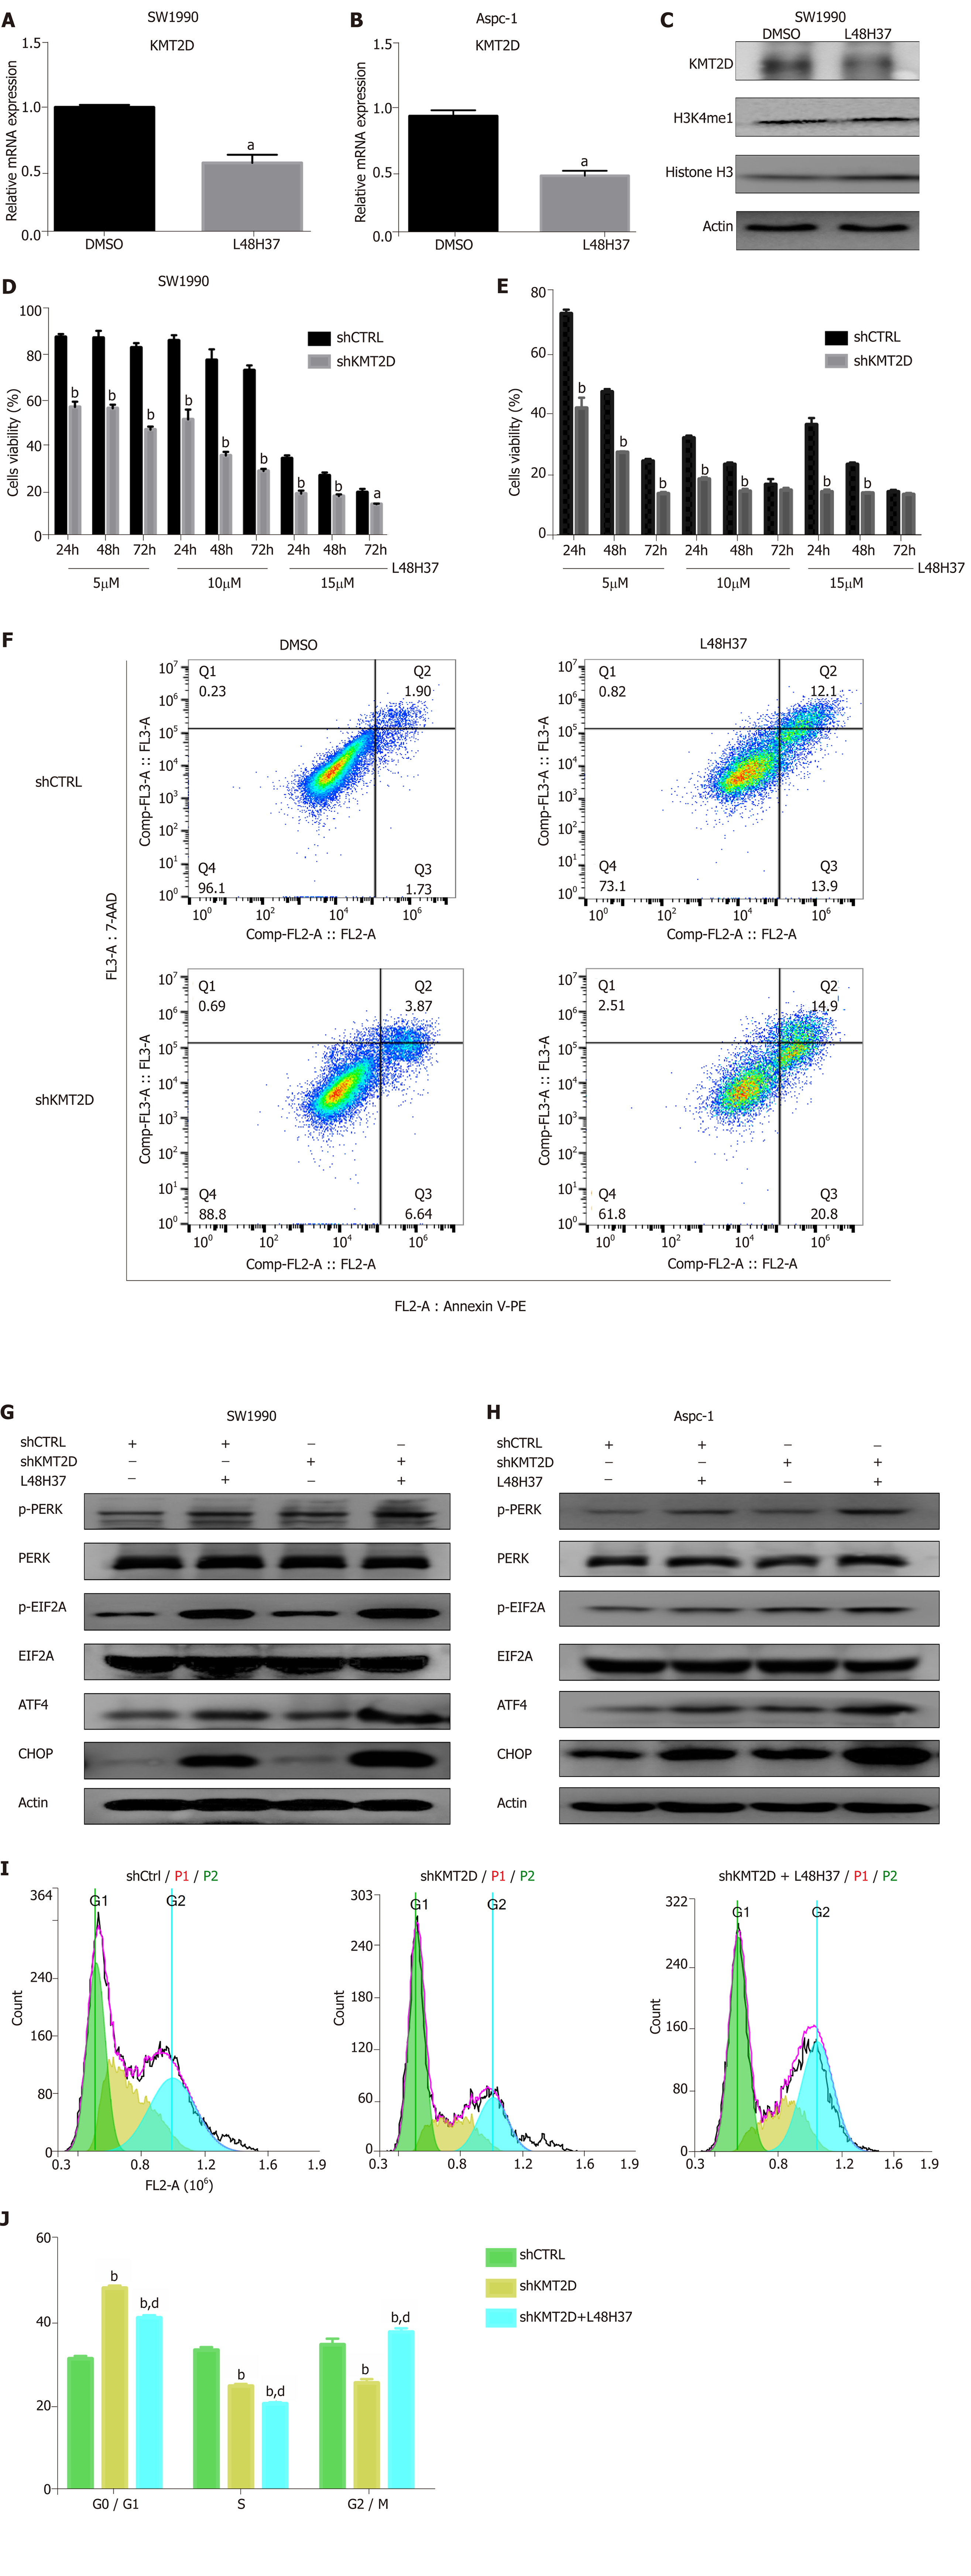
Figure 4 KMT2D knockdown enhances apoptosis in pancreatic ductal adenocarcinoma cells.
A-C: Immunoblot showing KMT2D and H3K4me1 protein levels in SW1990 and ASPC-1 cells treated with 15 µM L48H37 for 8 h. β-actin and Histone H3 were used as an internal control. The KMT2D mRNA levels were measured by RT-qPCR 24 h later. Data were expressed as mean ± SEM. aP < 0.05 vs DMSO group; D, E: KMT2D mRNA and protein levels in control and KMT2D-knockdown SW1990 and ASPC-1 cells treated with L48H37 (5, 10 and 15 μmol/L) or DMSO for three consecutive days, and percentage of viable cells. Data were expressed as mean ± SEM. aP < 0.05 vs shCTRL group at the same time point. bP < 0.01 vs shCTRL group at the same time point; F: Apoptosis rates in the control and KMT2D-knockdown SW1990 and ASPC-1 cells; G, H: Western blotting showing levels of p-PERK, PERK, p-EIF2α, EIF2α, ATF4 and CHOP in the control and KMT2D-knockdown SW1990 and ASPC-1 cells. β-actin was used as an internal control; I, J: shKMT2D or shCTRL SW1990 cells were harvested 24 h with L48H37, then cycle distribution was assessed by Propidium Iodide staining. Histogram showing the percentage of control and KMT2D knockdown SW1990 and ASPC-1 cells in the G0/G1, S, and G2/M phases. Data were expressed as mean ± SEM; J: bP < 0.01 vs shCTRL group in the same cell cycle. dP < 0.01 vs shKMT2D group in the same cell cycle. PERK: Protein kinase RNA-like endoplasmic reticulum kinase; EIF2A: Eukaryotic initiation factor 2α; ATF-4: Activating transcription factor-4; CHOP: Enhancer-binding protein-homologous protein.
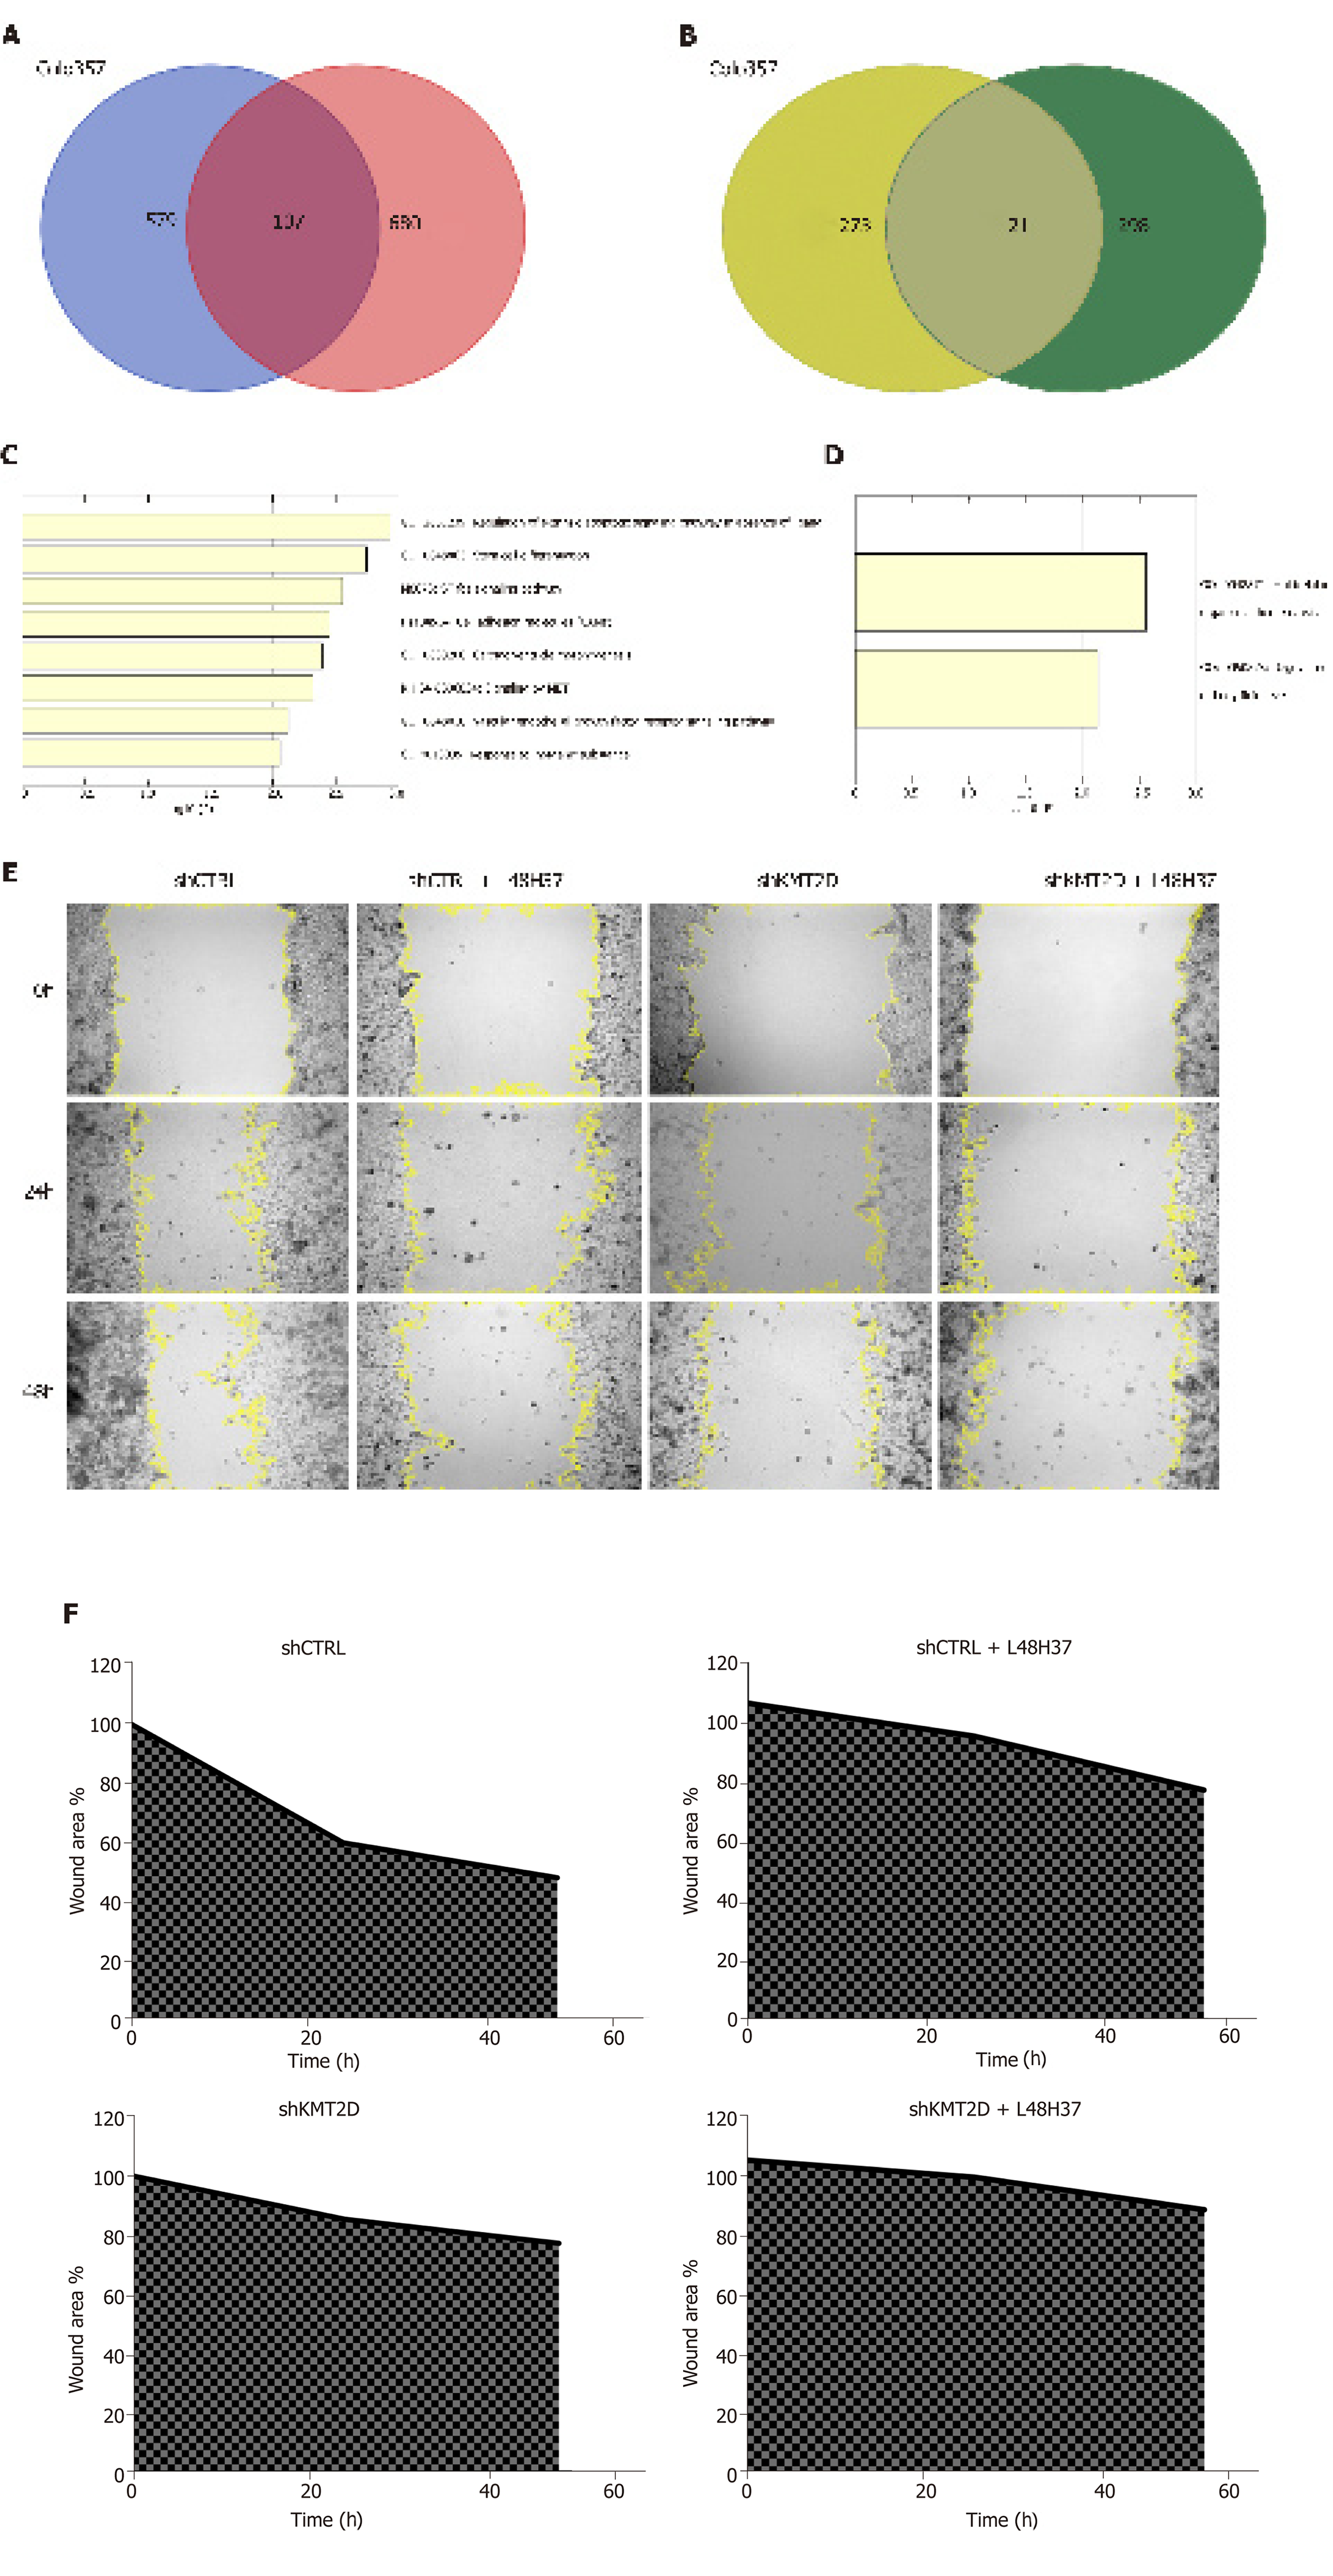
Figure 5 KMT2D knockdown augments L48H37-induced apoptosis and blocks migration in vitro.
A, B: Venn diagram showing overlapping DEGs in KMT2D knockdown Colo357 and SUIT-2 cells. Upregulated genes are shown in blue and red, and the downregulated in yellow and green in the Colo357 and SUIT-2 cells, respectively; C, D: Functional analysis of the overlapping DEGs; E, F: Graph showing the number of manually tracked migrating control and KMT2D knockdown SW1990 cells treated with L48H37.
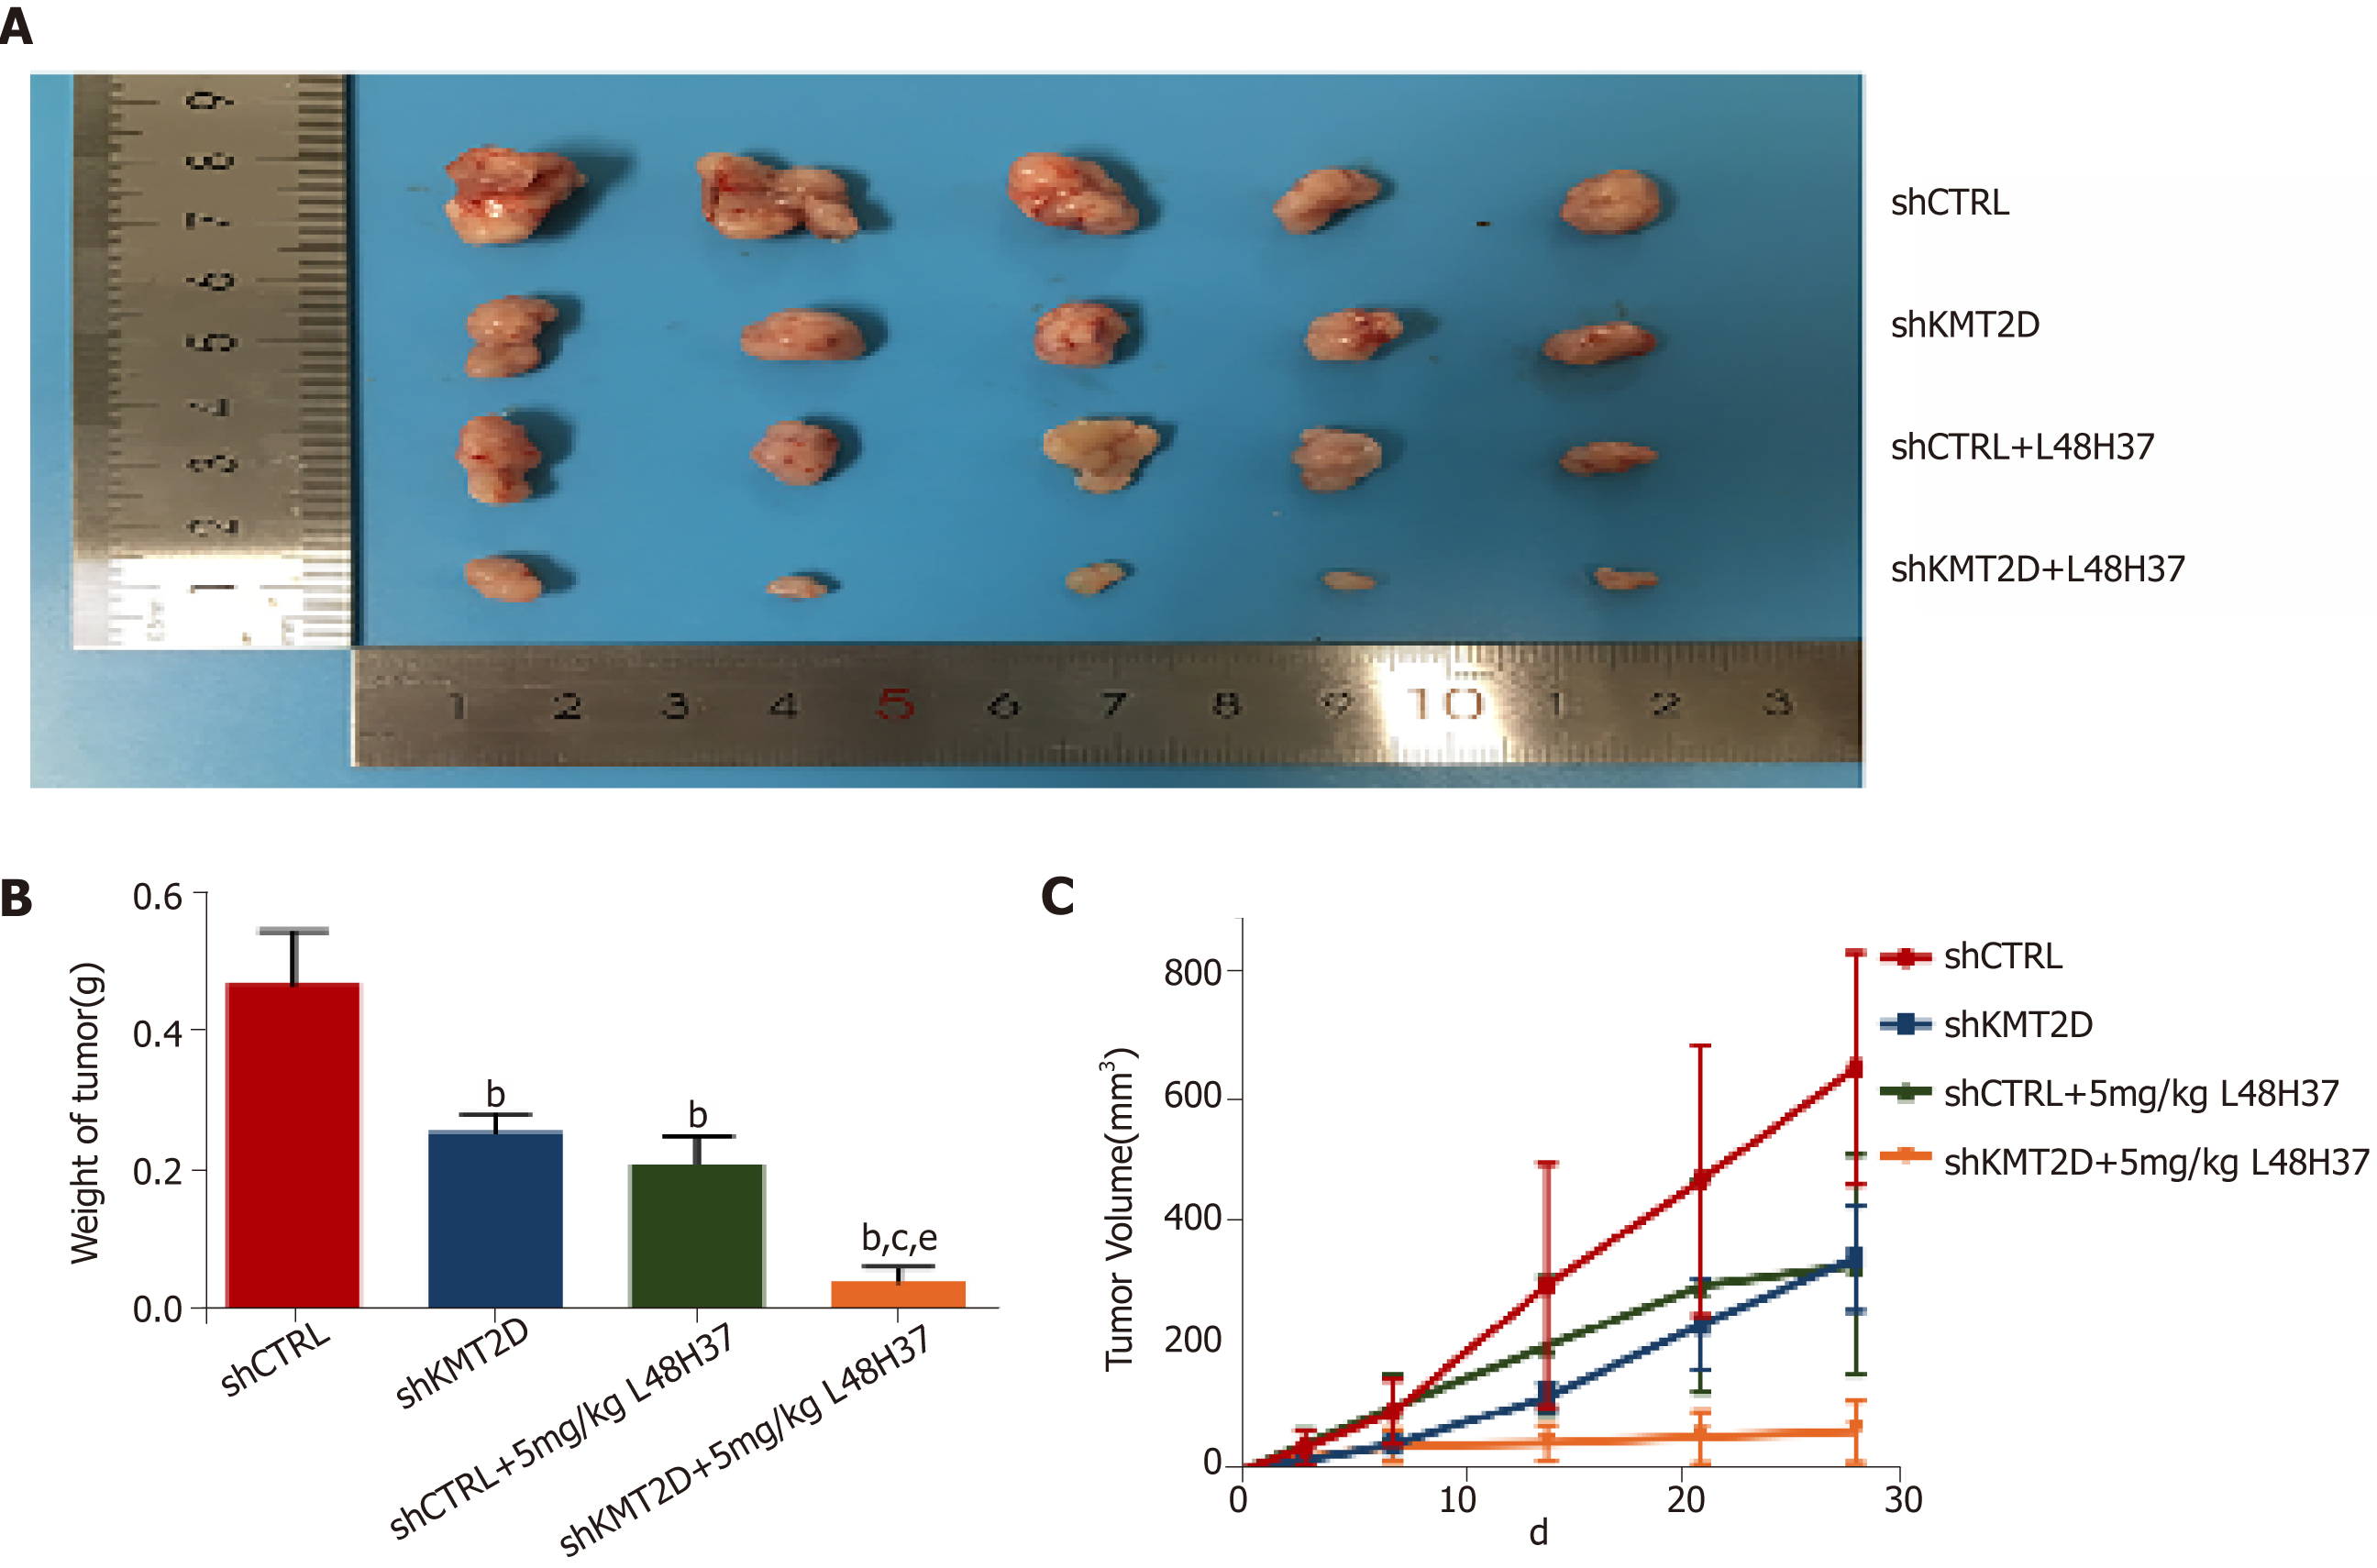
Figure 6 KMT2D knockdown synergizes with L48H37 to inhibit pancreatic ductal adenocarcinoma xenograft growth in vivo.
A: The gross image of resected tumors; B: Effect of 5 mg/kg L48H37 treatment on wet tumor weight in relatively independent four sub-groups (shCTRL group, shKMT2D group, shCTRL + 5 mg/kg L48H37 group and shKMT2D + 5 mg/kg L48H37 group). Data were expressed as mean ± SEM. bP < 0.01 vs shCTRL group. cP < 0.05 vs shKMT2D group. eP < 0.05 vs shCTRL + 5 mg/kg L48H37 group; C: Tumor volumes recorded at different follow-up times in the above four sub-groups. Data were expressed as mean ± SEM. P < 0.01 (shCTRL group vs shKMT2D group; shCTRL group vs shCTRL + 5 mg/kg L48H37 group; shCTRL group vs shKMT2D + 5 mg/kg L48H37 group; shKMT2D group vs shKMT2D + 5 mg/kg L48H37 group; shCTRL + 5 mg/kg L48H37 group vs shKMT2D + 5 mg/kg L48H37 group).
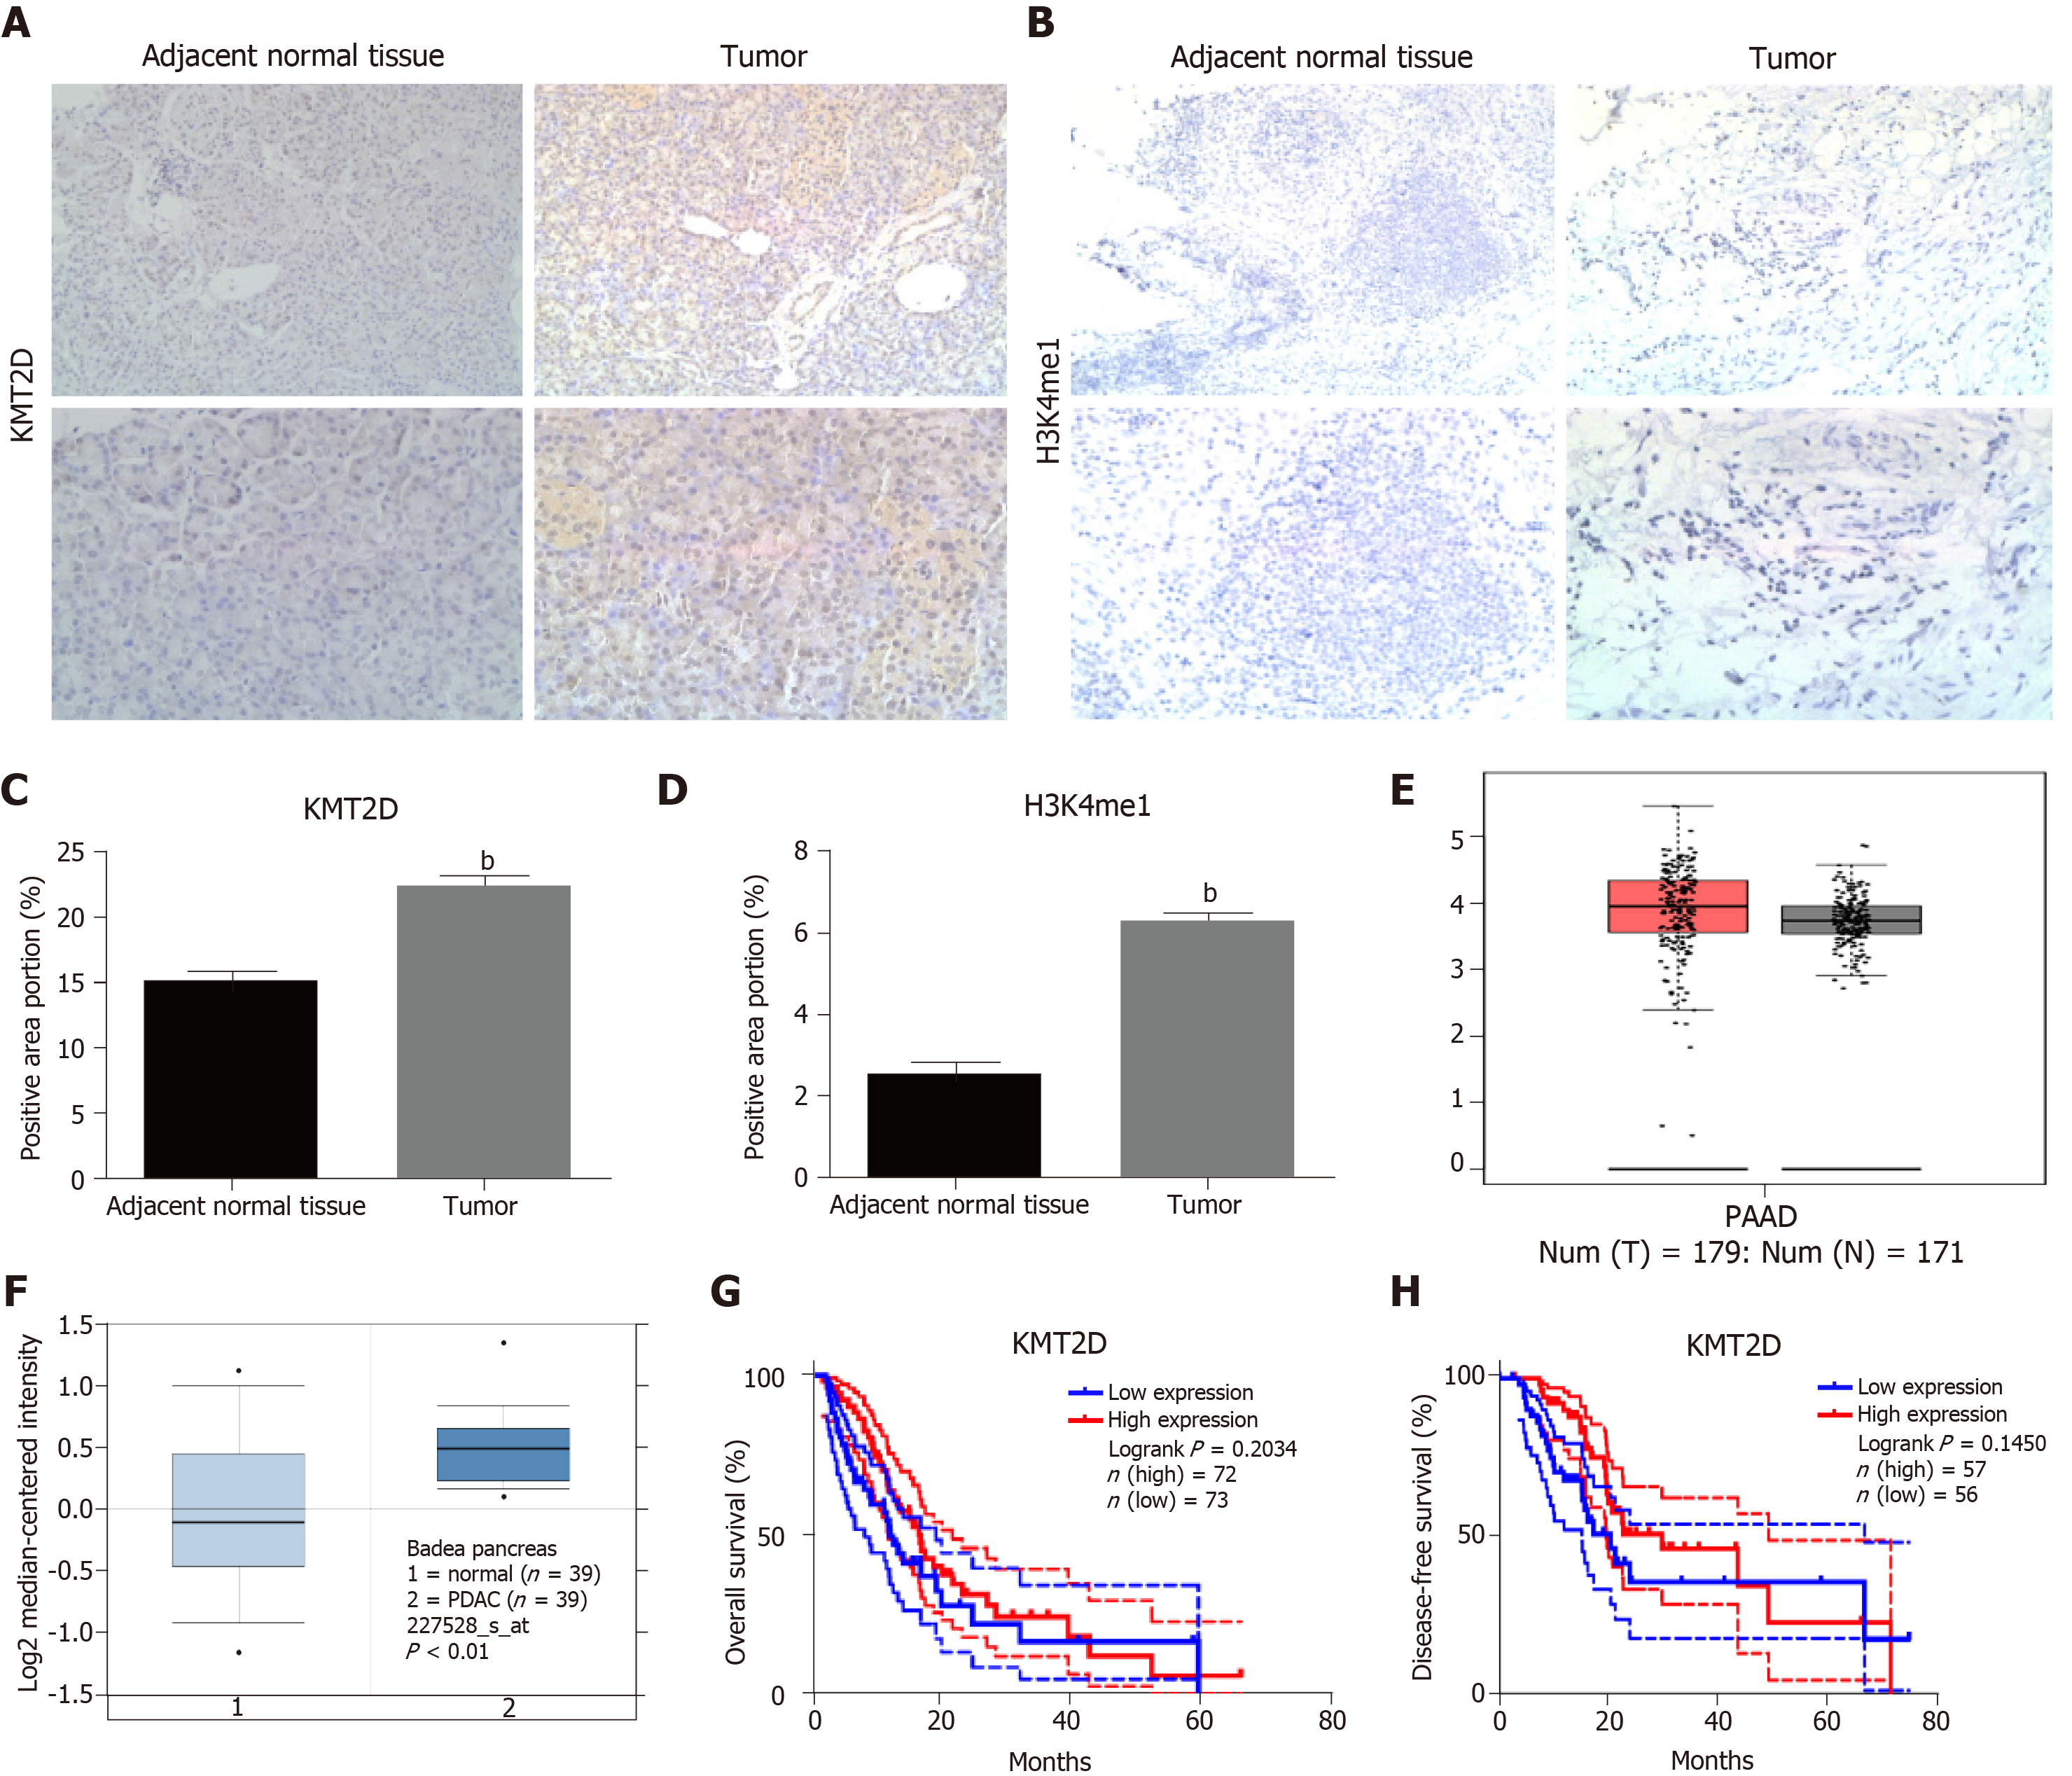
Figure 7 The prognostic value of the KMT2D in pancreatic ductal adenocarcinoma.
A-D: Representative immunohistochemistry images showing KMT2D or H3K4me1 expression in PDAC tissues and paired normal tissues (200× and 400× magnification). The histogram shows the percentage of positively-stained area as calculated by Fiji. Data were expressed as mean ± SEM. bP < 0.01 vs shCTRL group; E, F: Box-plot graph showing KMT2D expression in tumor and normal tissues from GEPIA and Oncomine databases; G, H: Kaplan-Meier curves showing overall survival and disease-free survival of TCGA database patients based on KMT2D expression.
- Citation: Li SS, Jiang WL, Xiao WQ, Li K, Zhang YF, Guo XY, Dai YQ, Zhao QY, Jiang MJ, Lu ZJ, Wan R. KMT2D deficiency enhances the anti-cancer activity of L48H37 in pancreatic ductal adenocarcinoma. World J Gastrointest Oncol 2019; 11(8): 599-621
- URL: https://www.wjgnet.com/1948-5204/full/v11/i8/599.htm
- DOI: https://dx.doi.org/10.4251/wjgo.v11.i8.599


