Copyright
©The Author(s) 2019.
World J Gastrointest Oncol. Jul 15, 2019; 11(7): 551-566
Published online Jul 15, 2019. doi: 10.4251/wjgo.v11.i7.551
Published online Jul 15, 2019. doi: 10.4251/wjgo.v11.i7.551
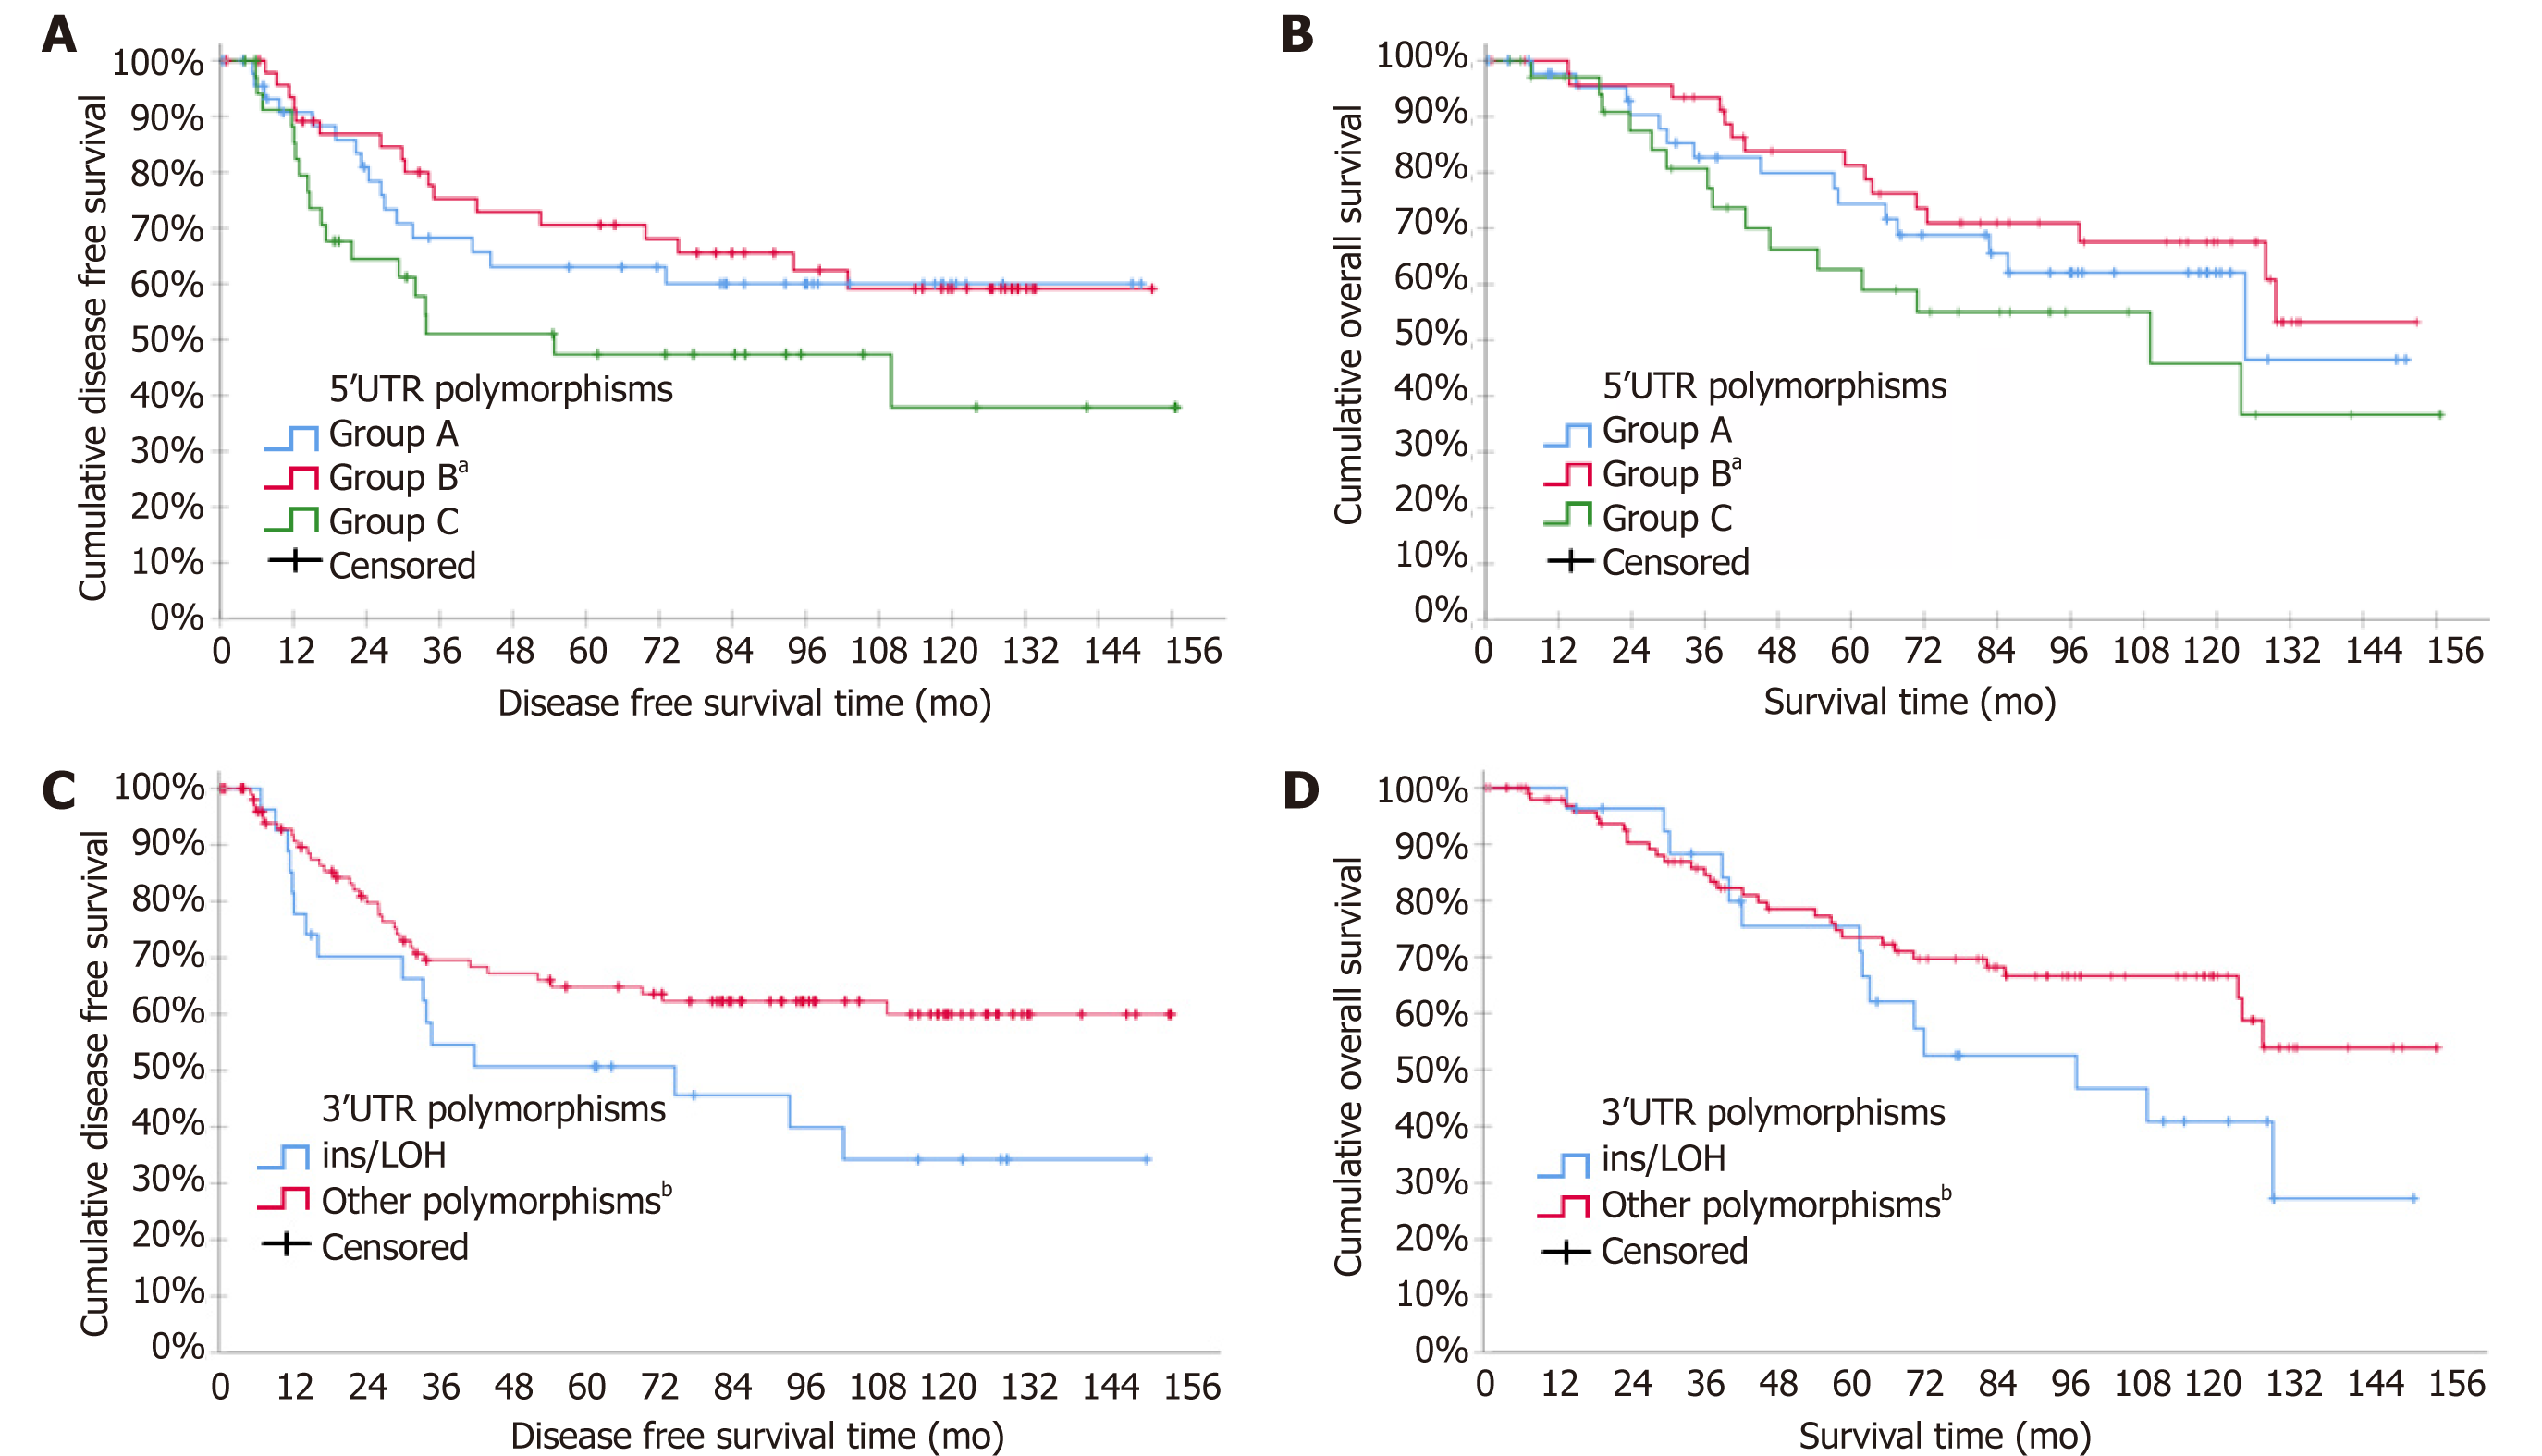
Figure 1 Kaplan-Meier curves for disease free survival and overall survival according to thymidylate synthase polymorphisms: A: Disease free survival (DFS) according to 5’ untranslated region (UTR); B: Overall survival (OS) according to 5’UTR; C: DFS according to 3’UTR; D: OS according to 3’UTR.
aP < 0.05 vs Group A and C; bP < 0.005. LOH: Loss of heterozygosity.
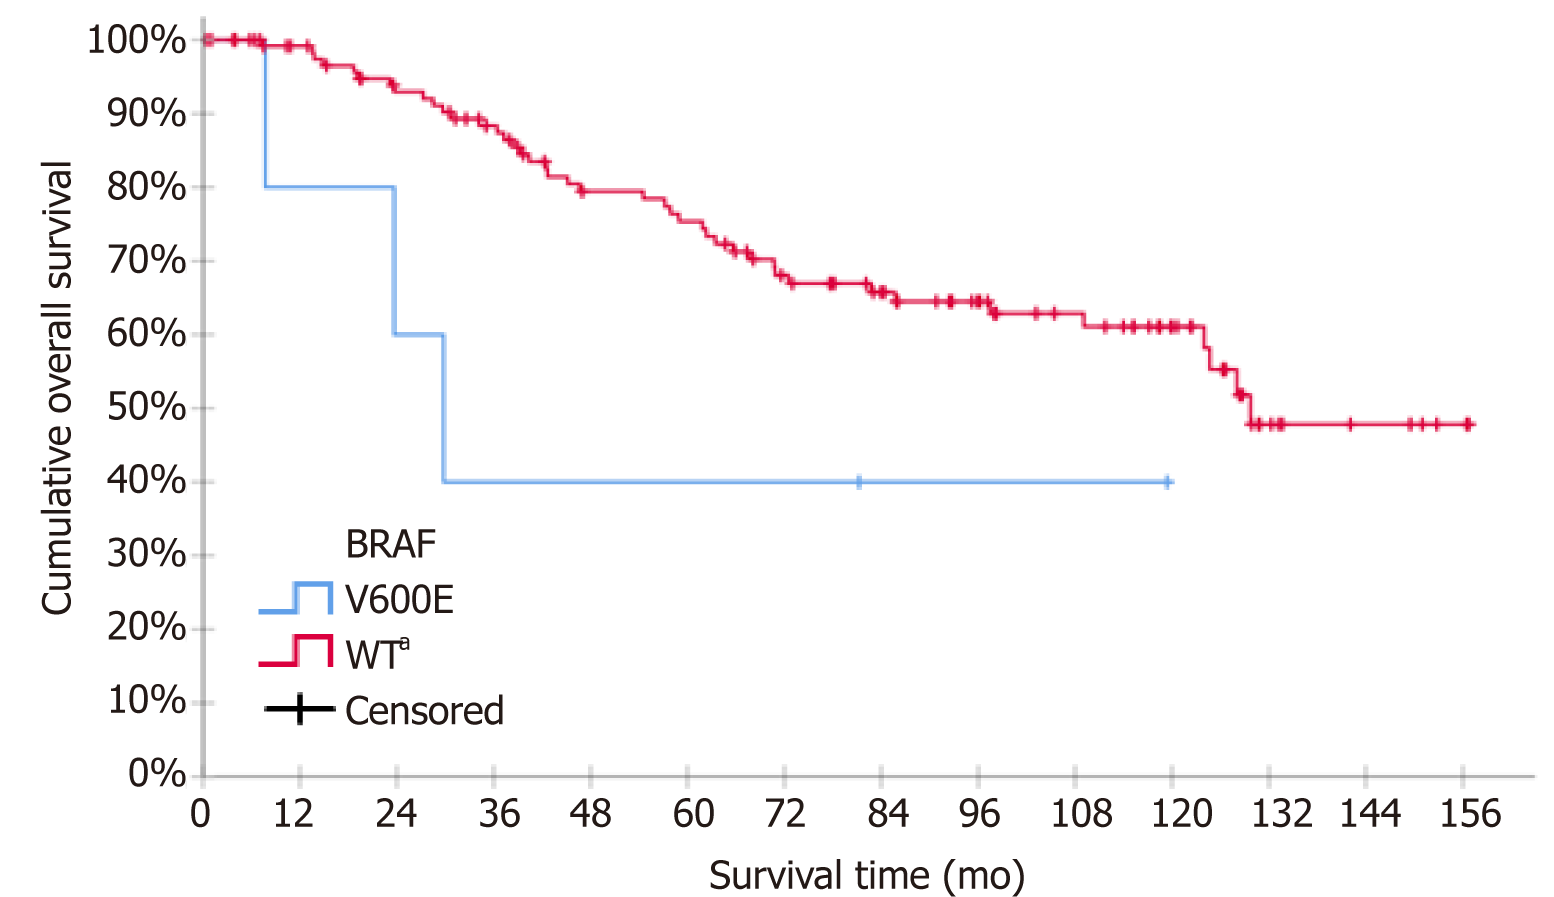
Figure 2 Kaplan-Meier survival curve for overall survival according to BRAF mutation status (V600E vs WT - wild type).
aP < 0.05.
- Citation: Ntavatzikos A, Spathis A, Patapis P, Machairas N, Vourli G, Peros G, Papadopoulos I, Panayiotides I, Koumarianou A. TYMS/KRAS/BRAF molecular profiling predicts survival following adjuvant chemotherapy in colorectal cancer. World J Gastrointest Oncol 2019; 11(7): 551-566
- URL: https://www.wjgnet.com/1948-5204/full/v11/i7/551.htm
- DOI: https://dx.doi.org/10.4251/wjgo.v11.i7.551


