Copyright
©The Author(s) 2019.
World J Gastrointest Oncol. Nov 15, 2019; 11(11): 1065-1080
Published online Nov 15, 2019. doi: 10.4251/wjgo.v11.i11.1065
Published online Nov 15, 2019. doi: 10.4251/wjgo.v11.i11.1065
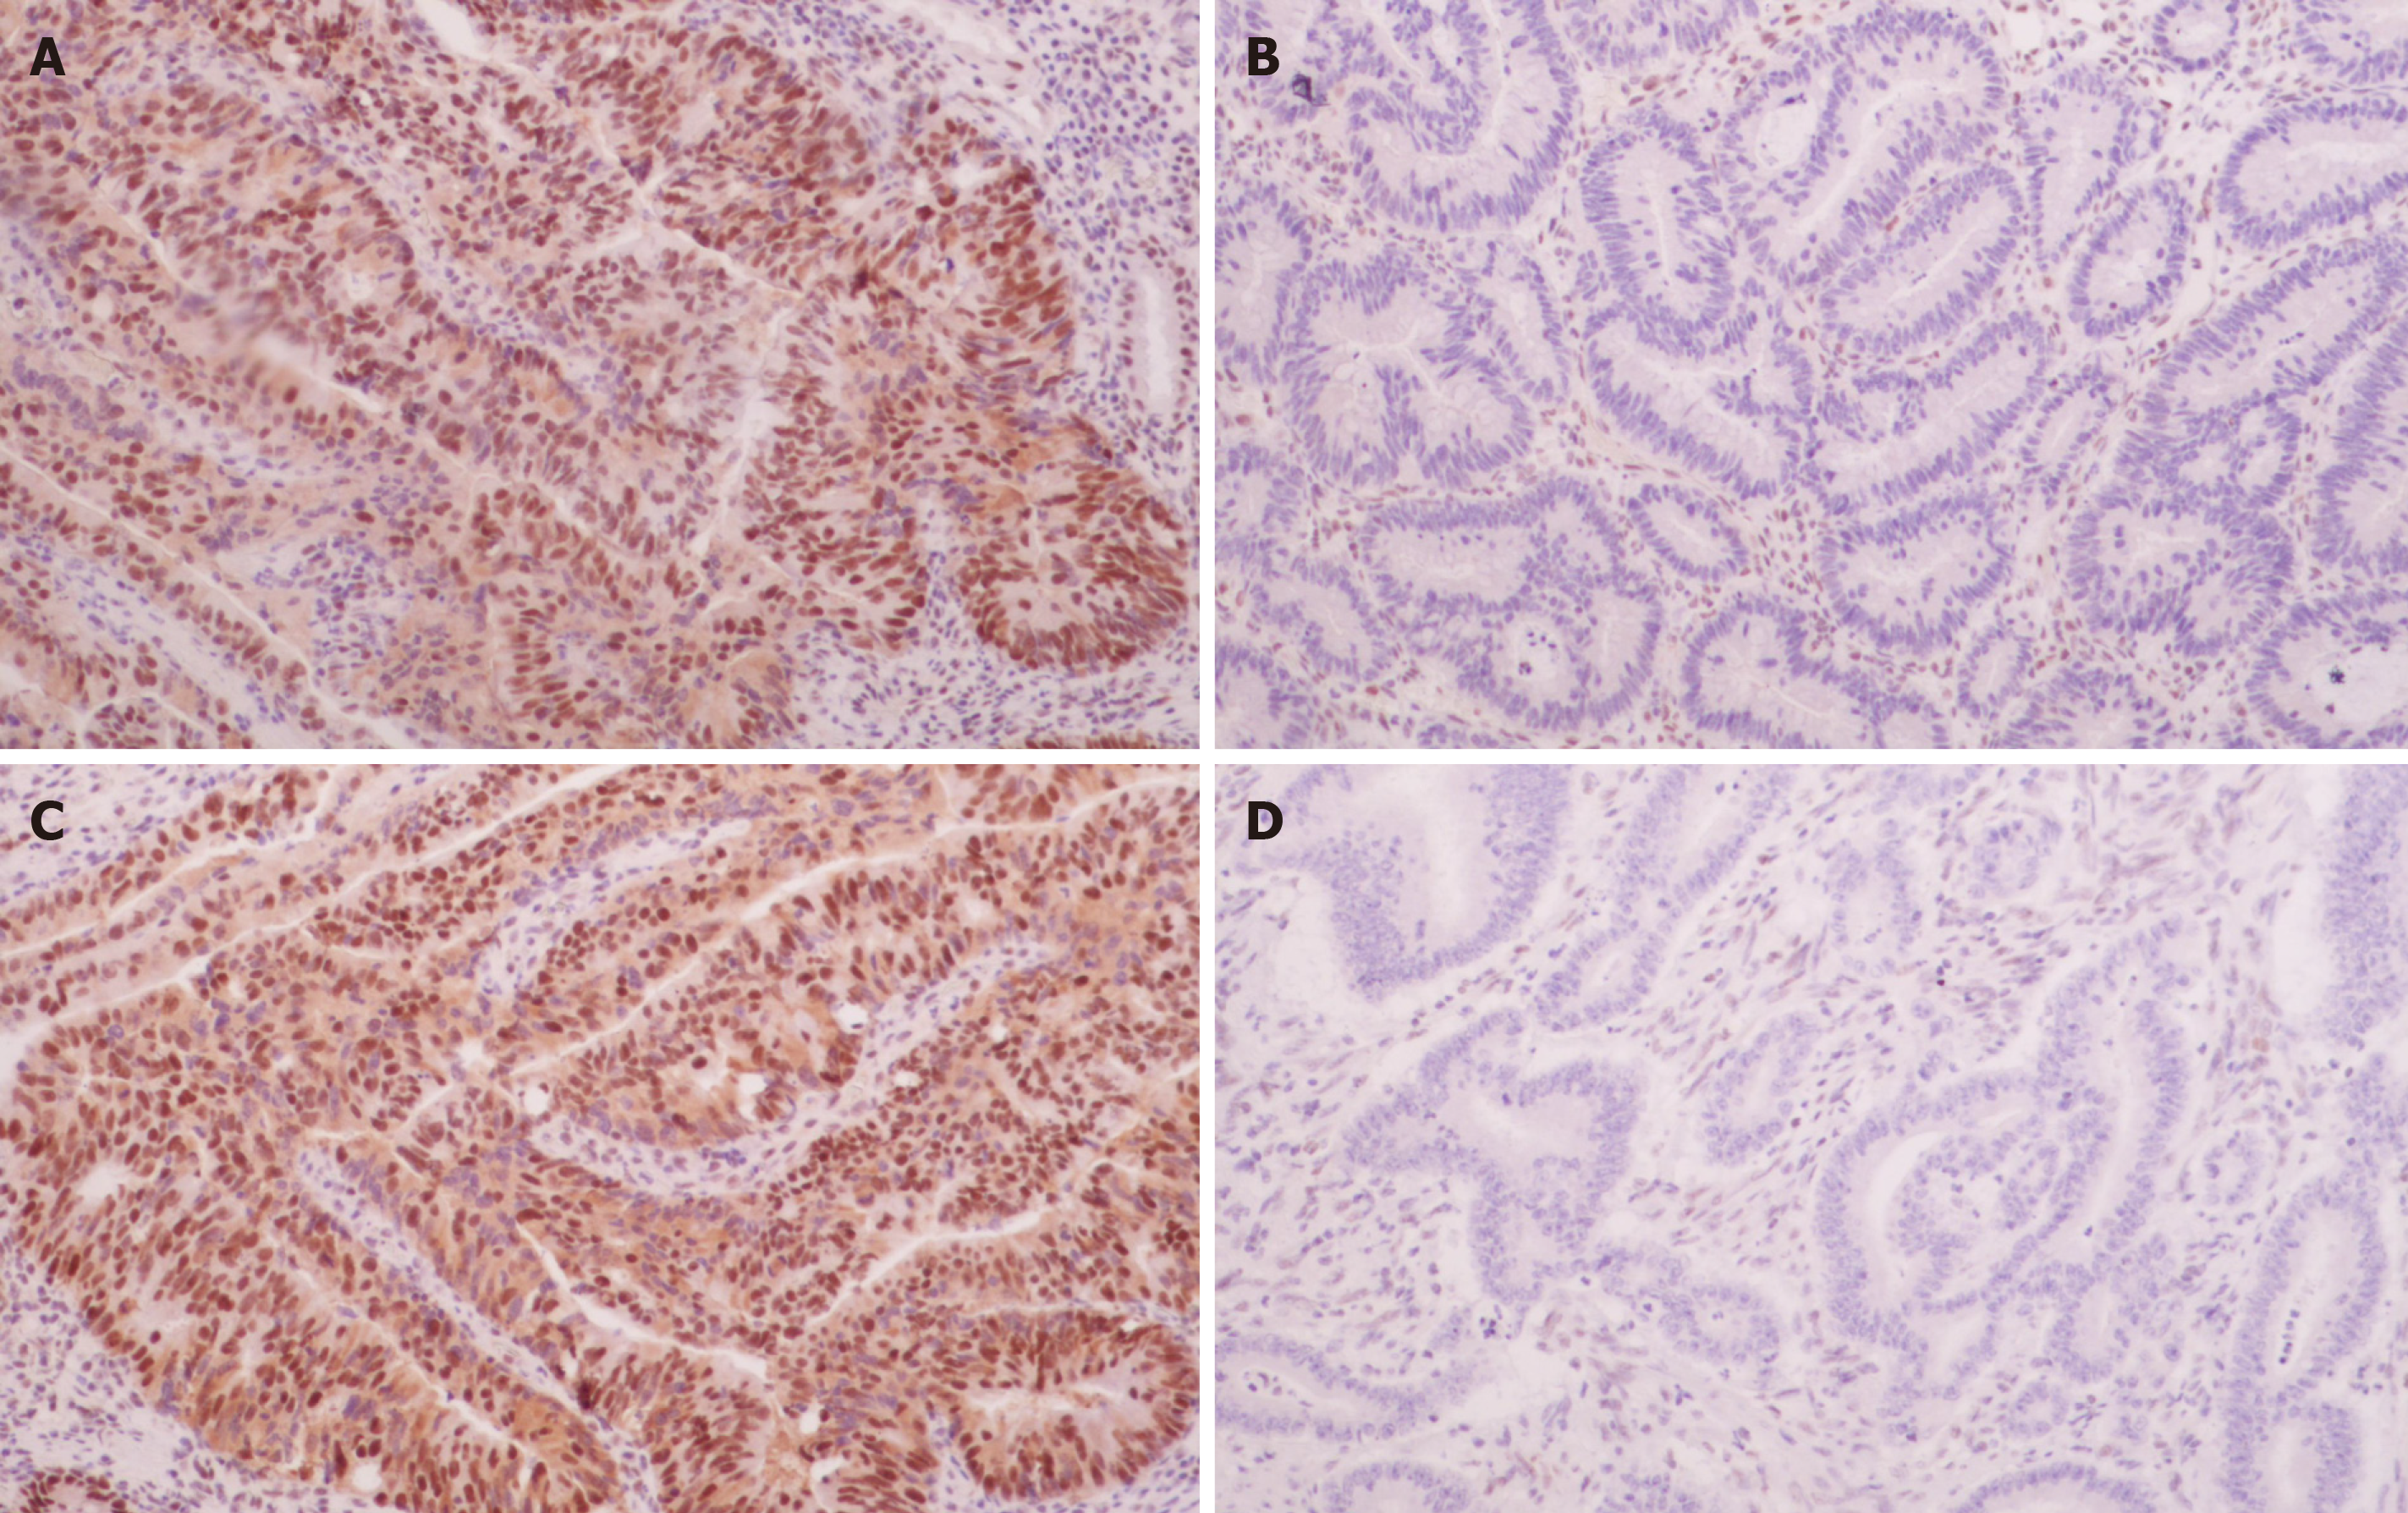
Figure 1 Expression of MLH1 and MSH2 in colorectal cancer tissues detected by immunohistochemistry (DAB staining, ×100).
A: MLH1 positivity; B: MLH1 negativity; C: MSH2 positivity; D: MSH2 negativity.
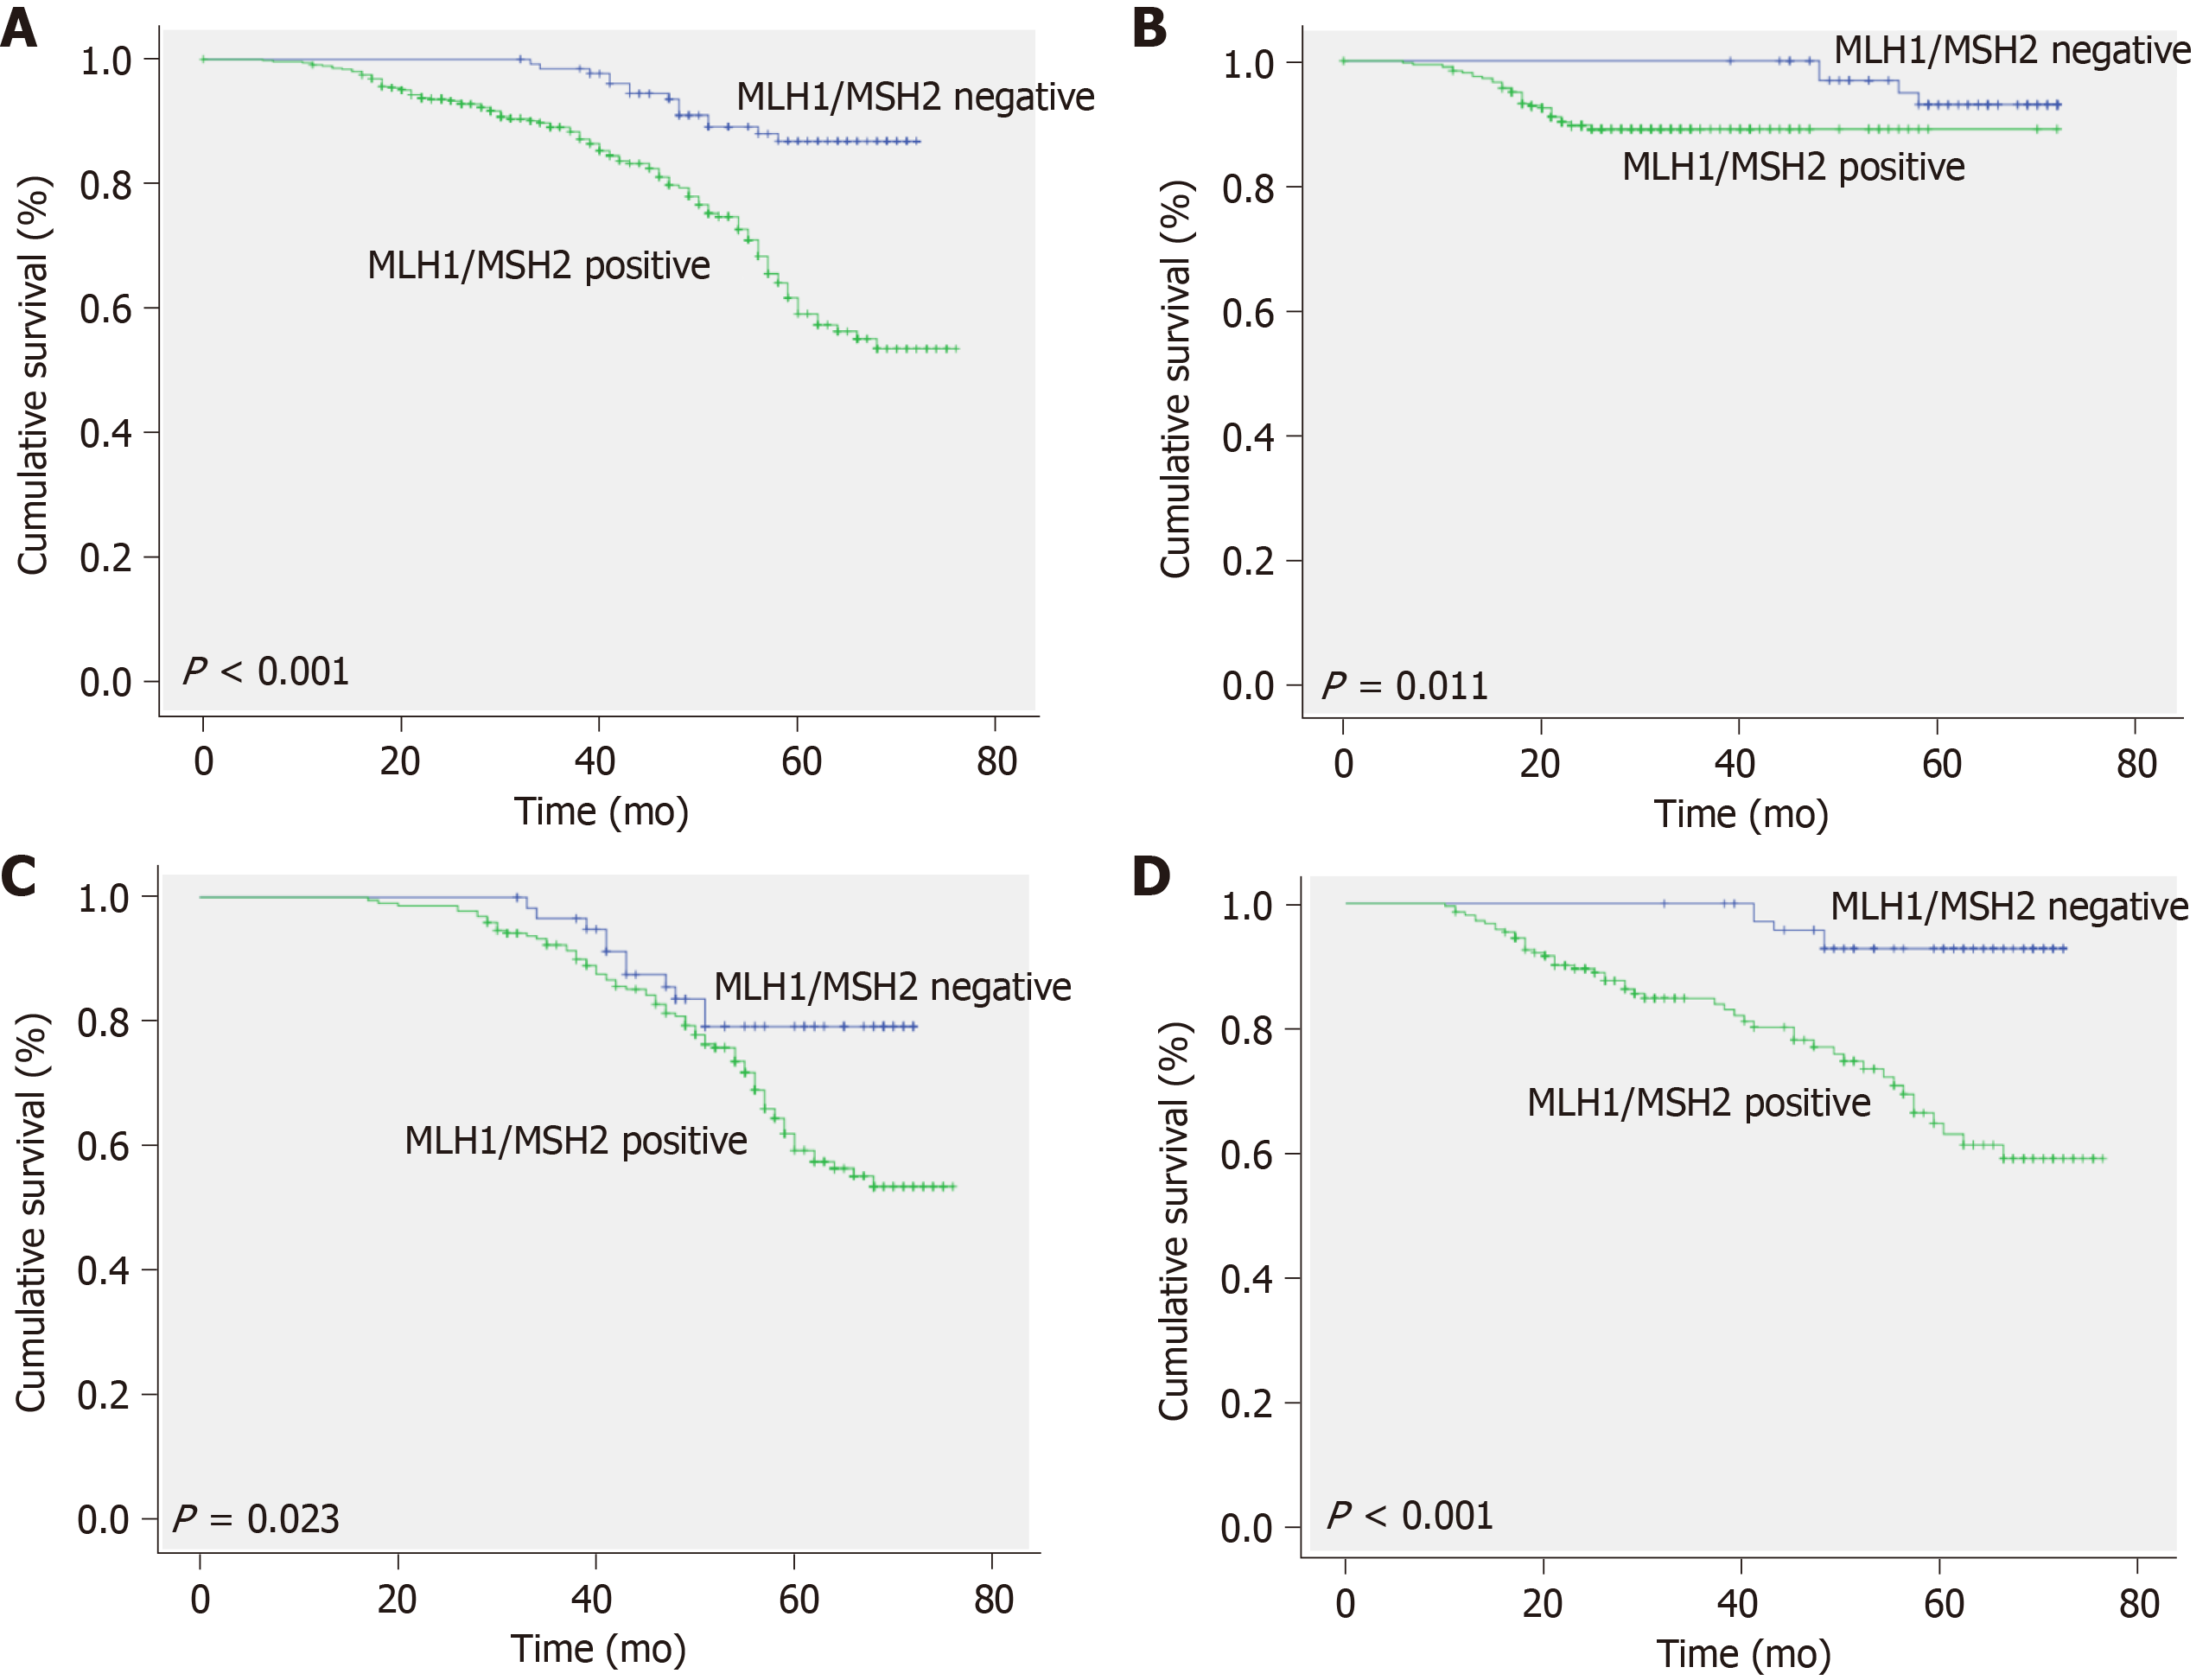
Figure 2 Kaplan–Meier survival curves for patients with colorectal cancer, stratified according to expression of MLH1/MSH2.
A: Overall survival of total colorectal cancer (CRC) patients classified as MLH1/MSH2-positive and MLH1/MSH2-negative subgroups; B: Overall survival of stage II CRC patients classified as MLH1/MSH2-positive and MLH1/MSH2-negative subgroups; C: Overall survival of stage III CRC patients classified as MLH1/MSH2-positive and MLH1/MSH2-negative subgroups; D: Overall survival of all adjuvant chemotherapy patients classified as MLH1/MSH2-positive and MLH1/MSH2-negative subgroups.
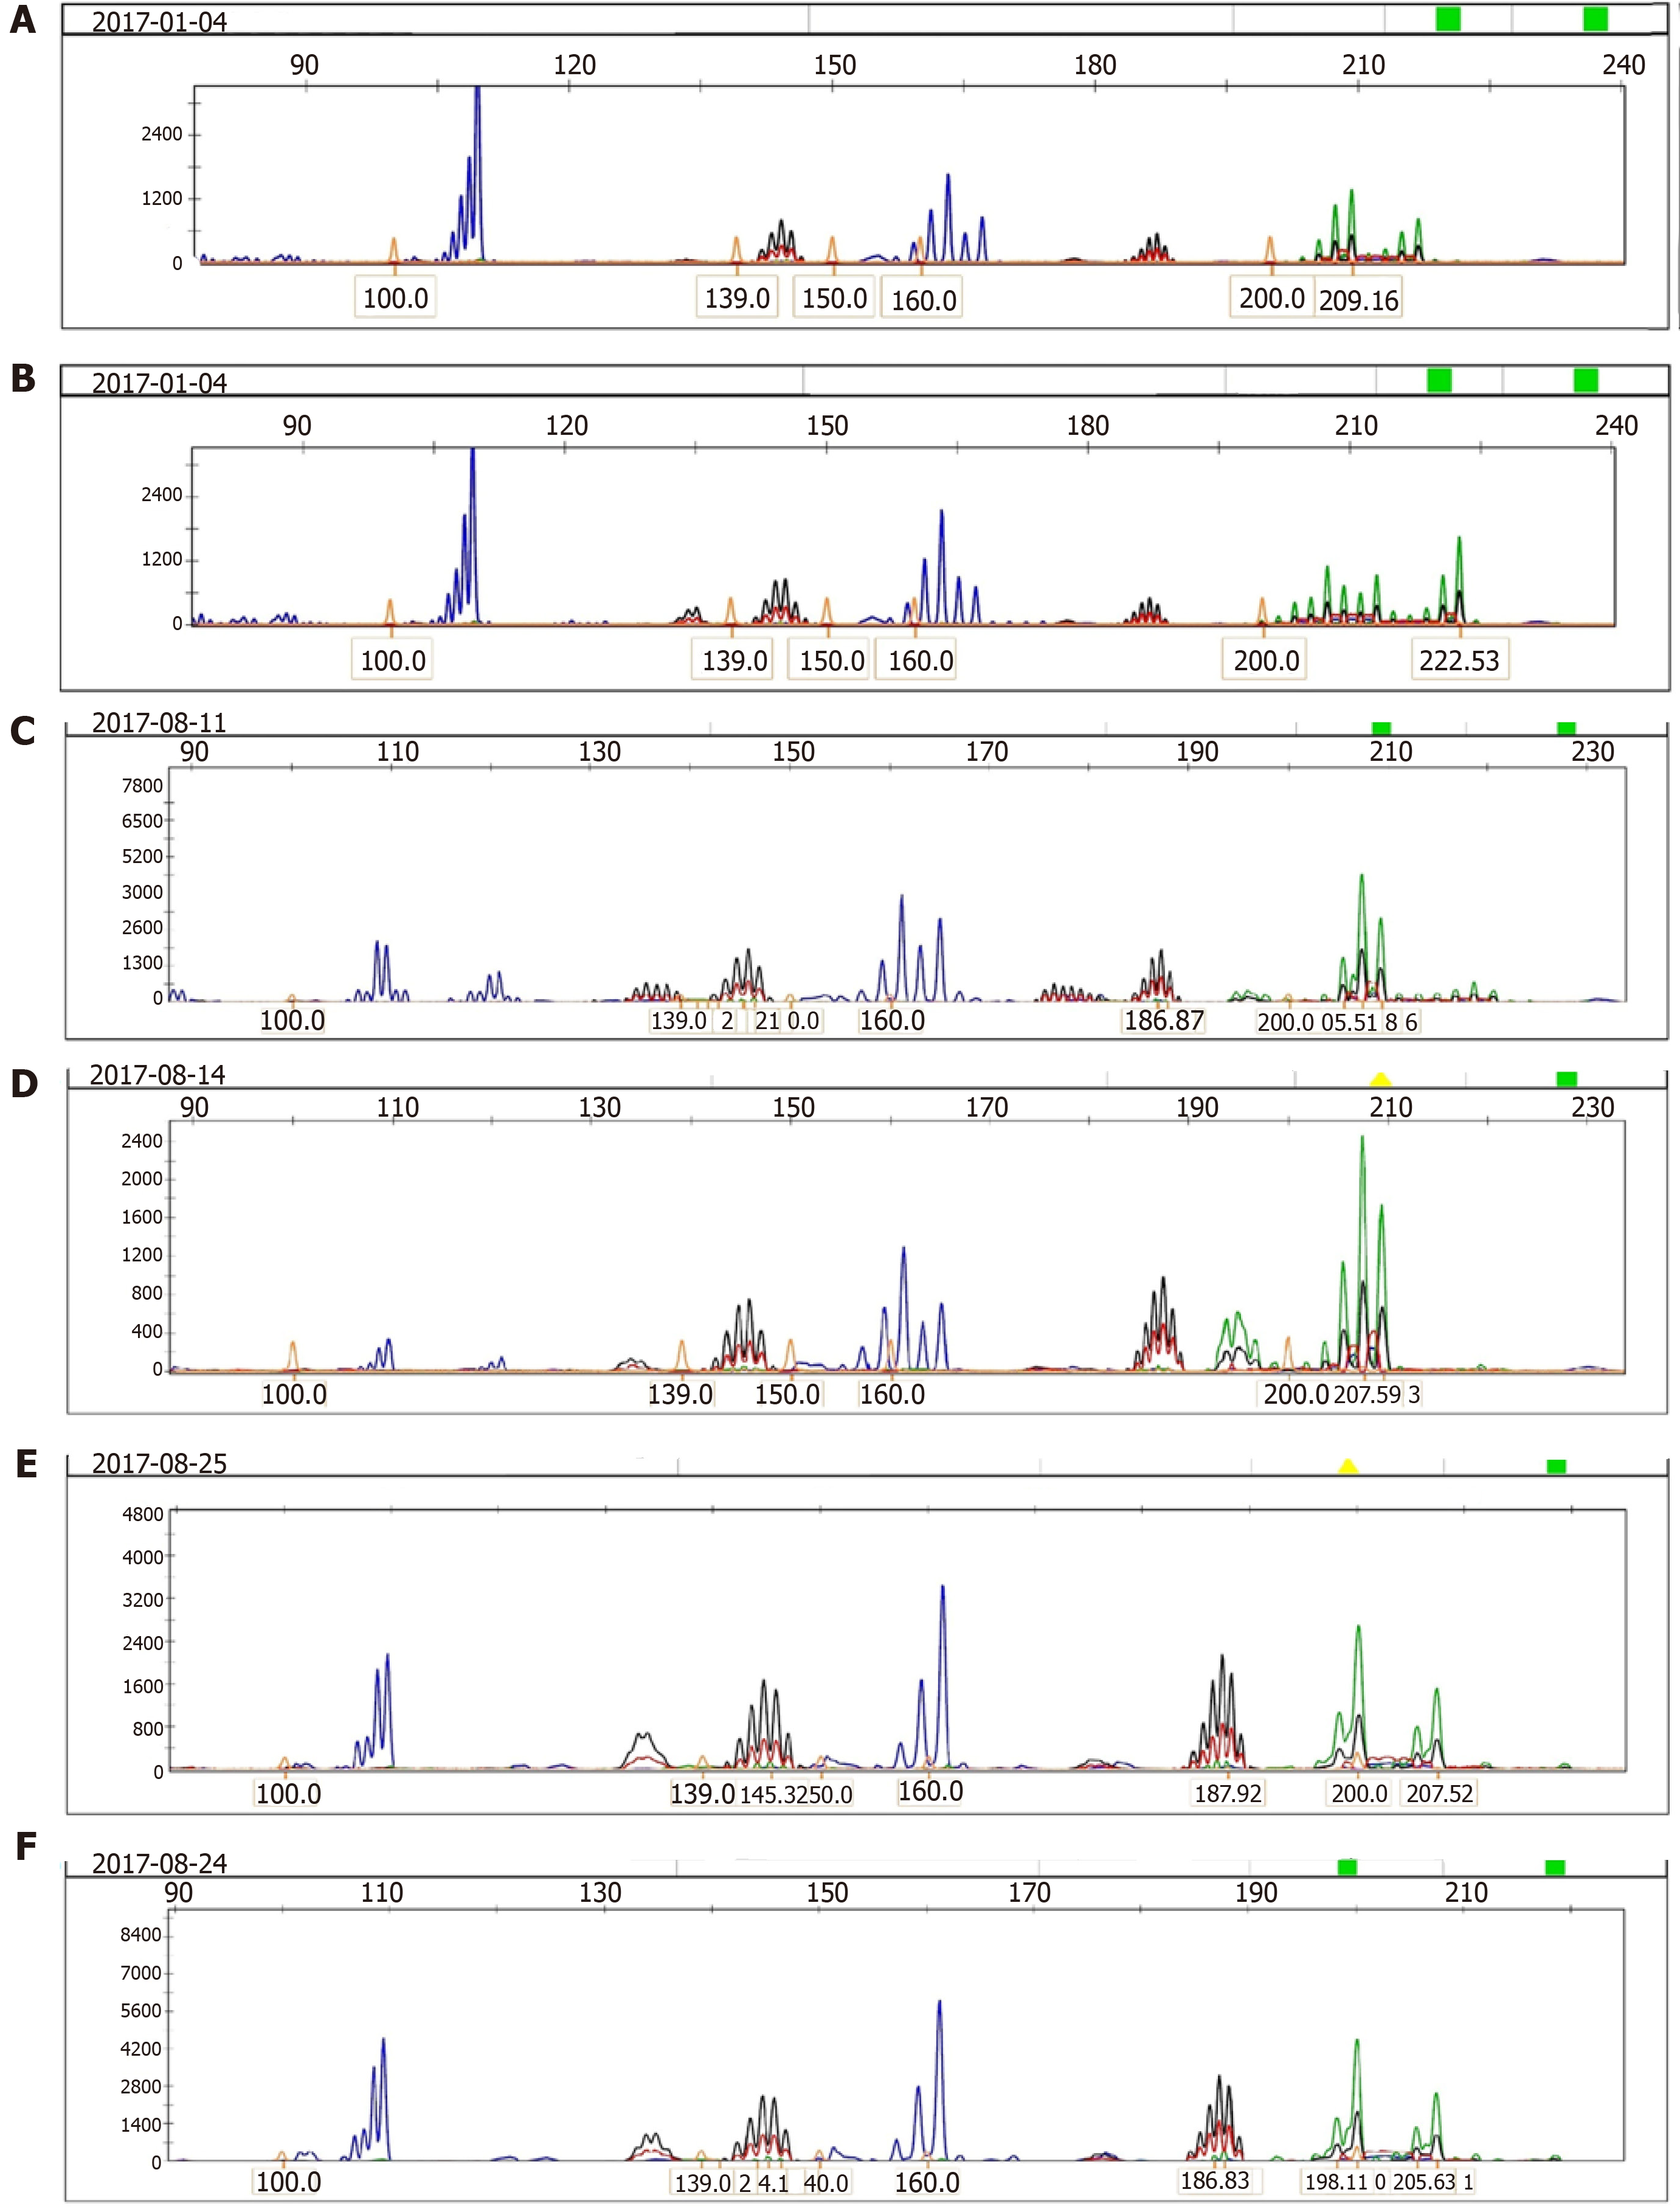
Figure 3 Analysis of microsatellite instability in colorectal cancer tissues and corresponding normal mucosa using the five markers of the international workshop of Bethesda and fluorescence-based multiplex polymerase chain reaction.
Fragment pattern of a high-frequency microsatellite instability tumor showing instability at all five loci examined is shown. A: Low microsatellite instability (MSI-L) of tumor tissue; B: MSI-L of corresponding normal tissue; C: High microsatellite instability (MSI-H) of tumor tissue; D: MSI-H of corresponding normal tissue; E: Microsatellite stability (MSS) of tumor tissue; F: MSS of corresponding normal tissue.
- Citation: Wang SM, Jiang B, Deng Y, Huang SL, Fang MZ, Wang Y. Clinical significance of MLH1/MSH2 for stage II/III sporadic colorectal cancer. World J Gastrointest Oncol 2019; 11(11): 1065-1080
- URL: https://www.wjgnet.com/1948-5204/full/v11/i11/1065.htm
- DOI: https://dx.doi.org/10.4251/wjgo.v11.i11.1065


