Copyright
©The Author(s) 2018.
World J Gastrointest Oncol. Apr 15, 2018; 10(4): 103-107
Published online Apr 15, 2018. doi: 10.4251/wjgo.v10.i4.103
Published online Apr 15, 2018. doi: 10.4251/wjgo.v10.i4.103
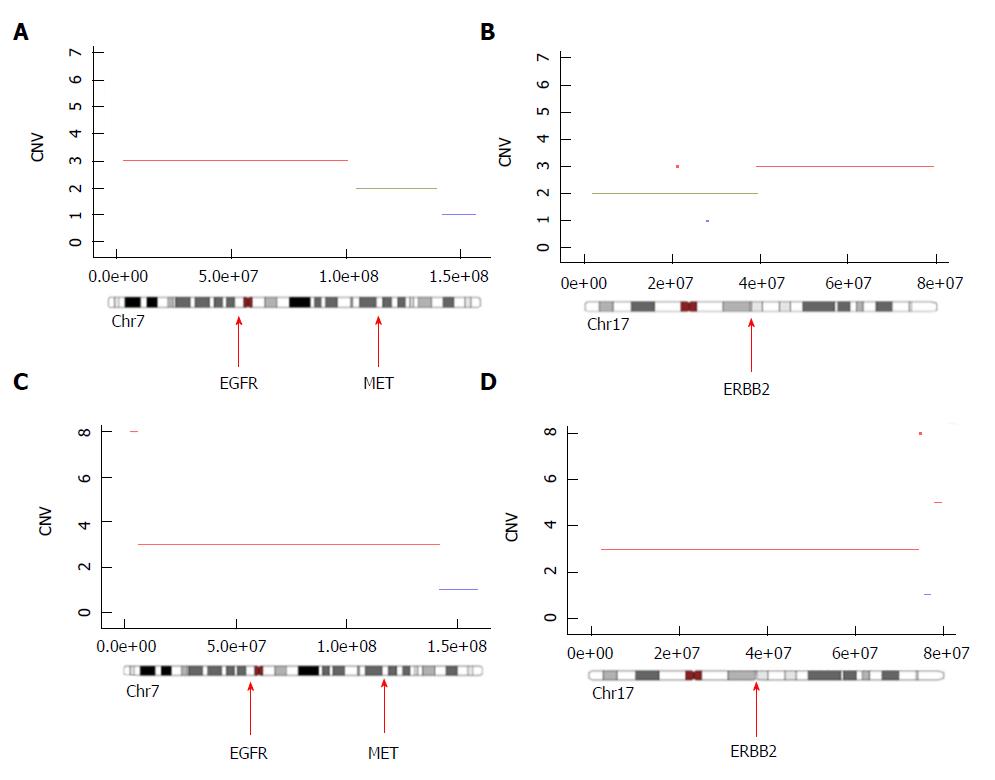
Figure 1 Representation of chromosomal amplification and deletion in chromosomes 7 (A, C) and 17 (B, D) in the primary tumor (C, D) and the liver metastasis (A, B).
Portions in red are amplified, portions in blue are deleted and portions in green are diploid. Genes of interest are indicated by a red arrow.
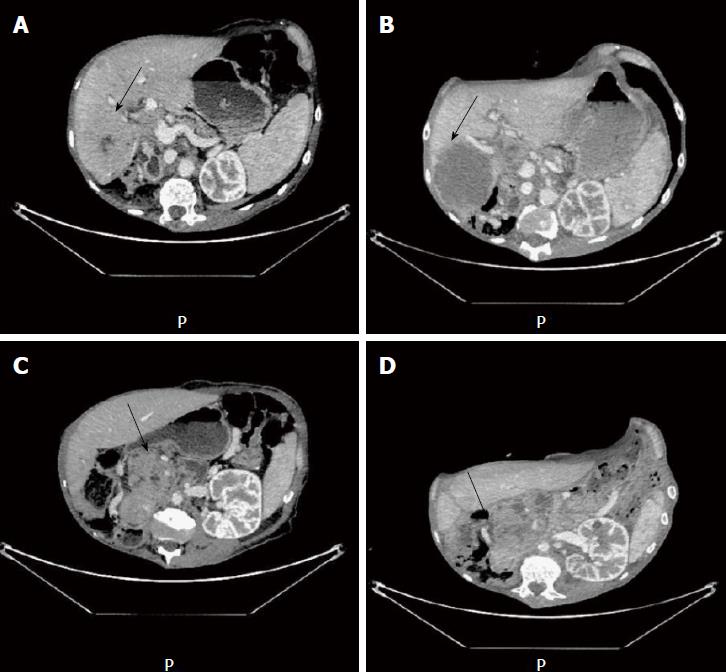
Figure 2 Primary tumor and liver metastasis response to FOLFIRI plus panitumumab.
A and B: CT scan axial images of liver metastasis at baseline and 4 wk of therapy; C and D: Axial images of at primary pancreatic tumor at baseline and 4 wk of therapy. Lesions are indicated by a arrow.
- Citation: Richard C, Niogret J, Boidot R, Ghiringhelli F. EGFR amplification induces sensitivity to antiEGFR therapy in pancreatic acinar cell carcinoma. World J Gastrointest Oncol 2018; 10(4): 103-107
- URL: https://www.wjgnet.com/1948-5204/full/v10/i4/103.htm
- DOI: https://dx.doi.org/10.4251/wjgo.v10.i4.103


