©The Author(s) 2025.
World J Gastrointest Endosc. Jul 16, 2025; 17(7): 108307
Published online Jul 16, 2025. doi: 10.4253/wjge.v17.i7.108307
Published online Jul 16, 2025. doi: 10.4253/wjge.v17.i7.108307
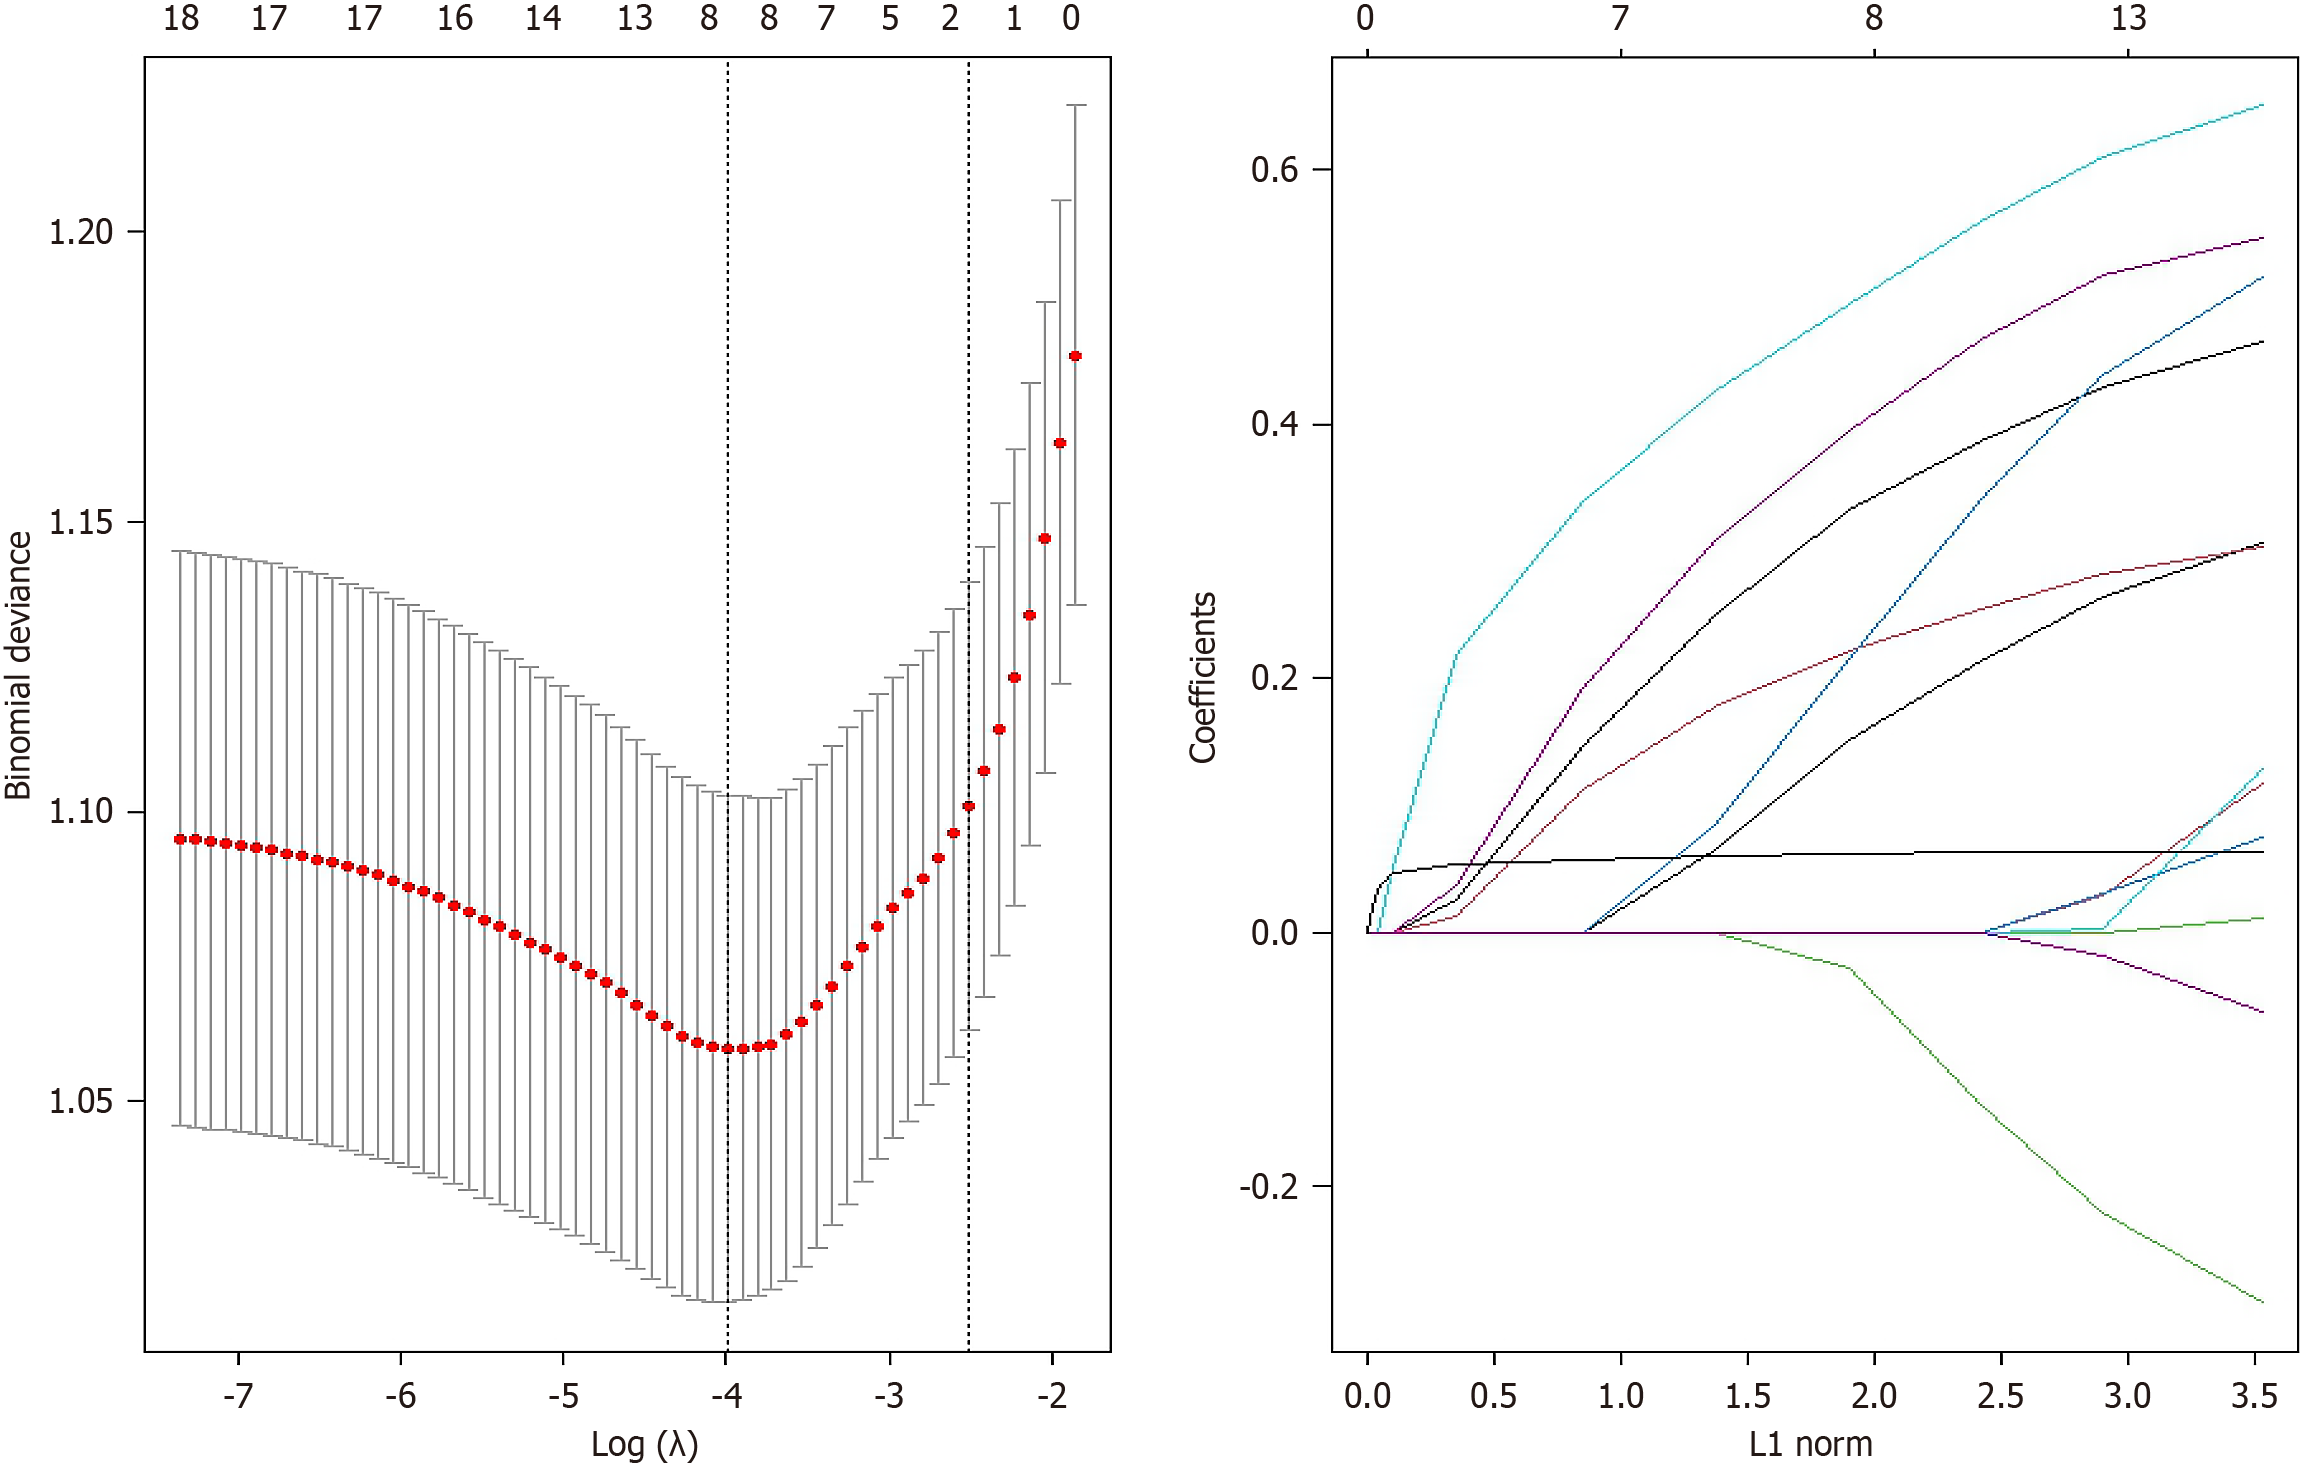
Figure 1
Least absolute shrinkage and selection operator regression variable screening diagram.
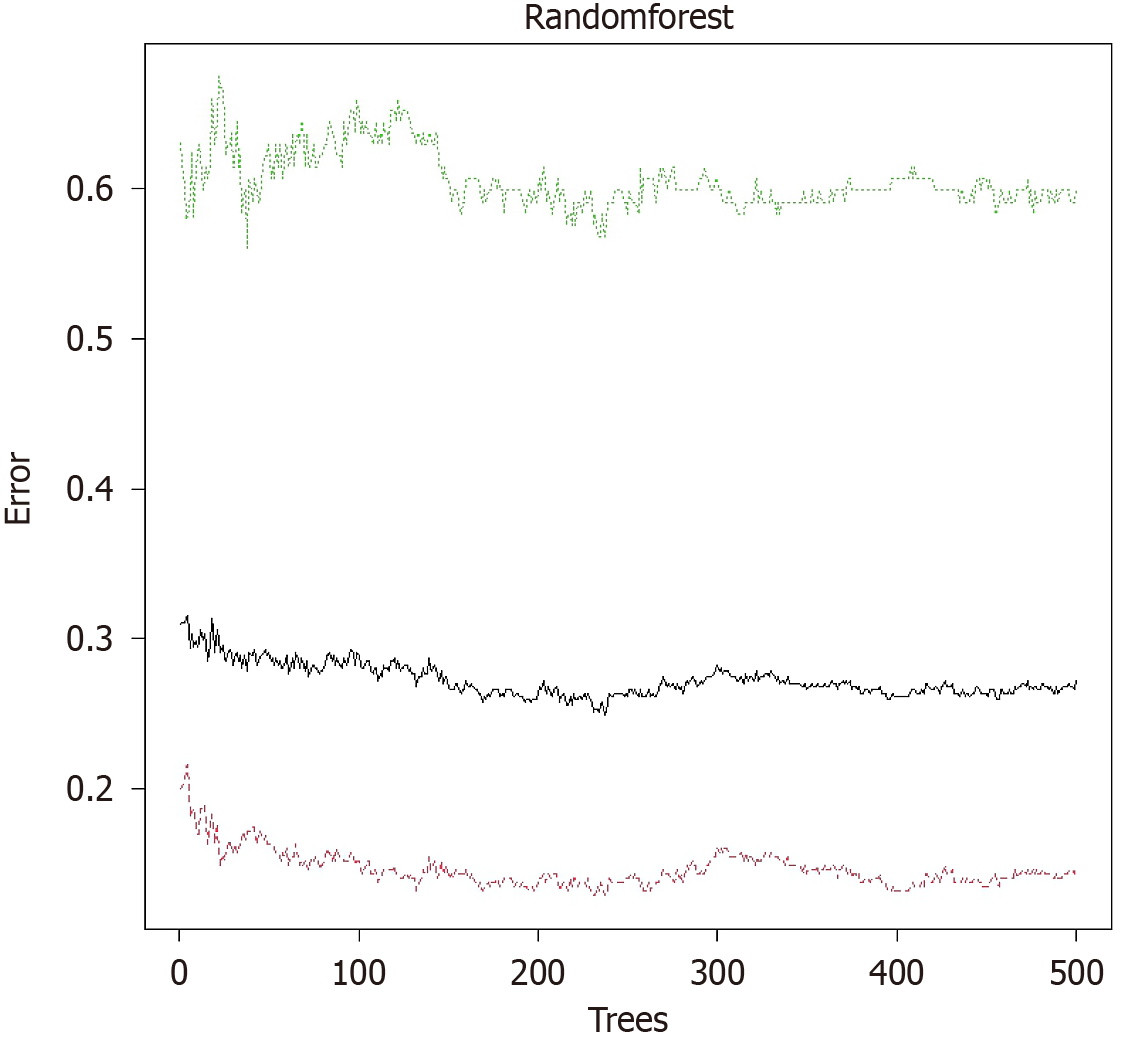
Figure 2
Random forest model.
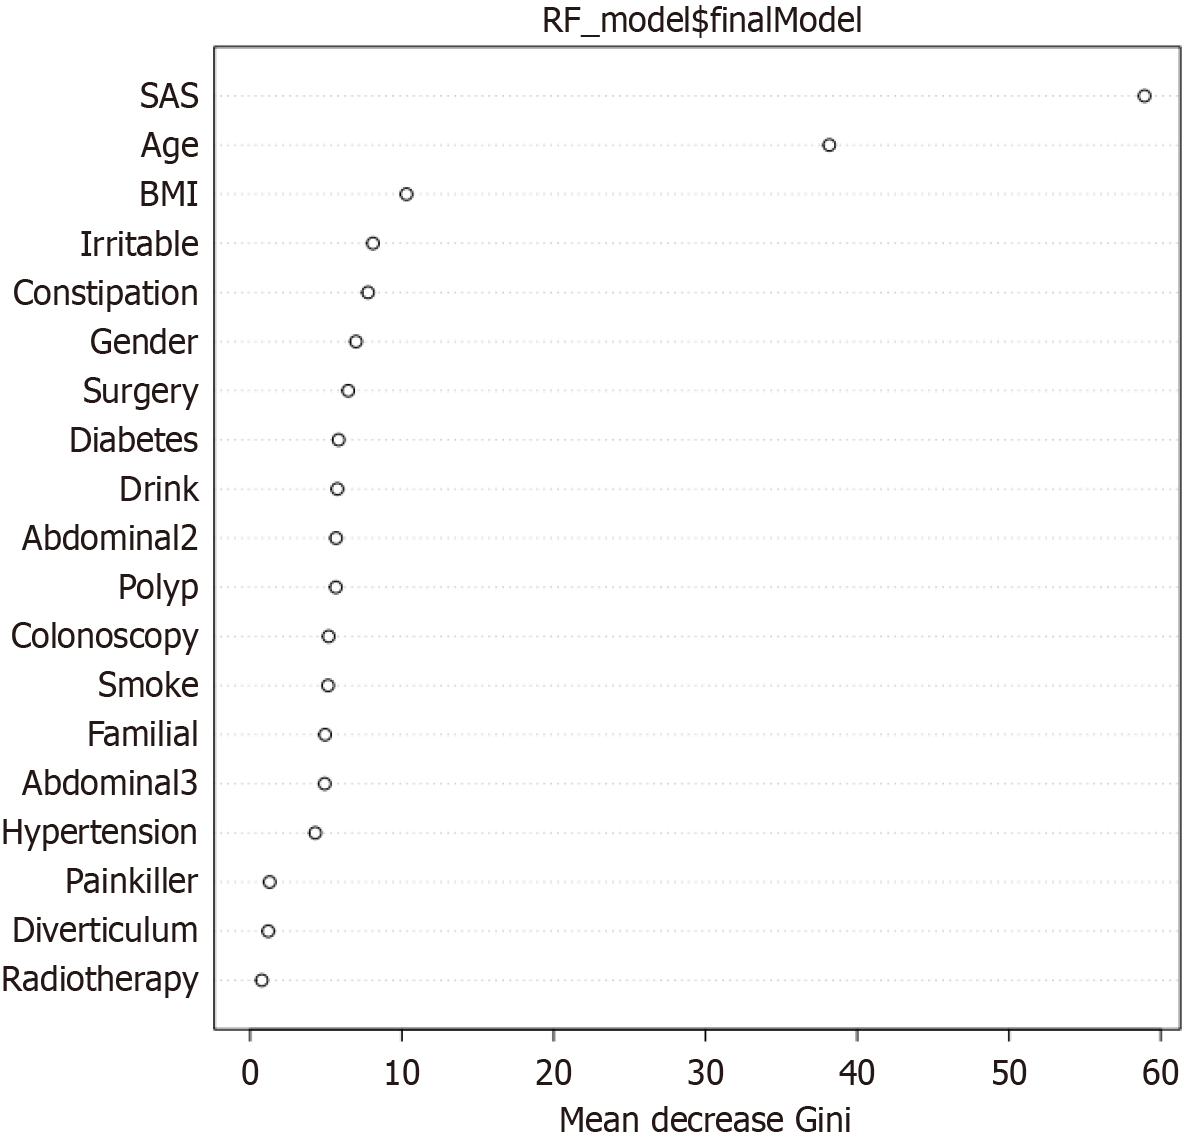
Figure 3 Mean decrease Gini diagram of random forest.
BMI: Body mass index; RF: Random forest; SAS: Self-Rating Anxiety Scale.
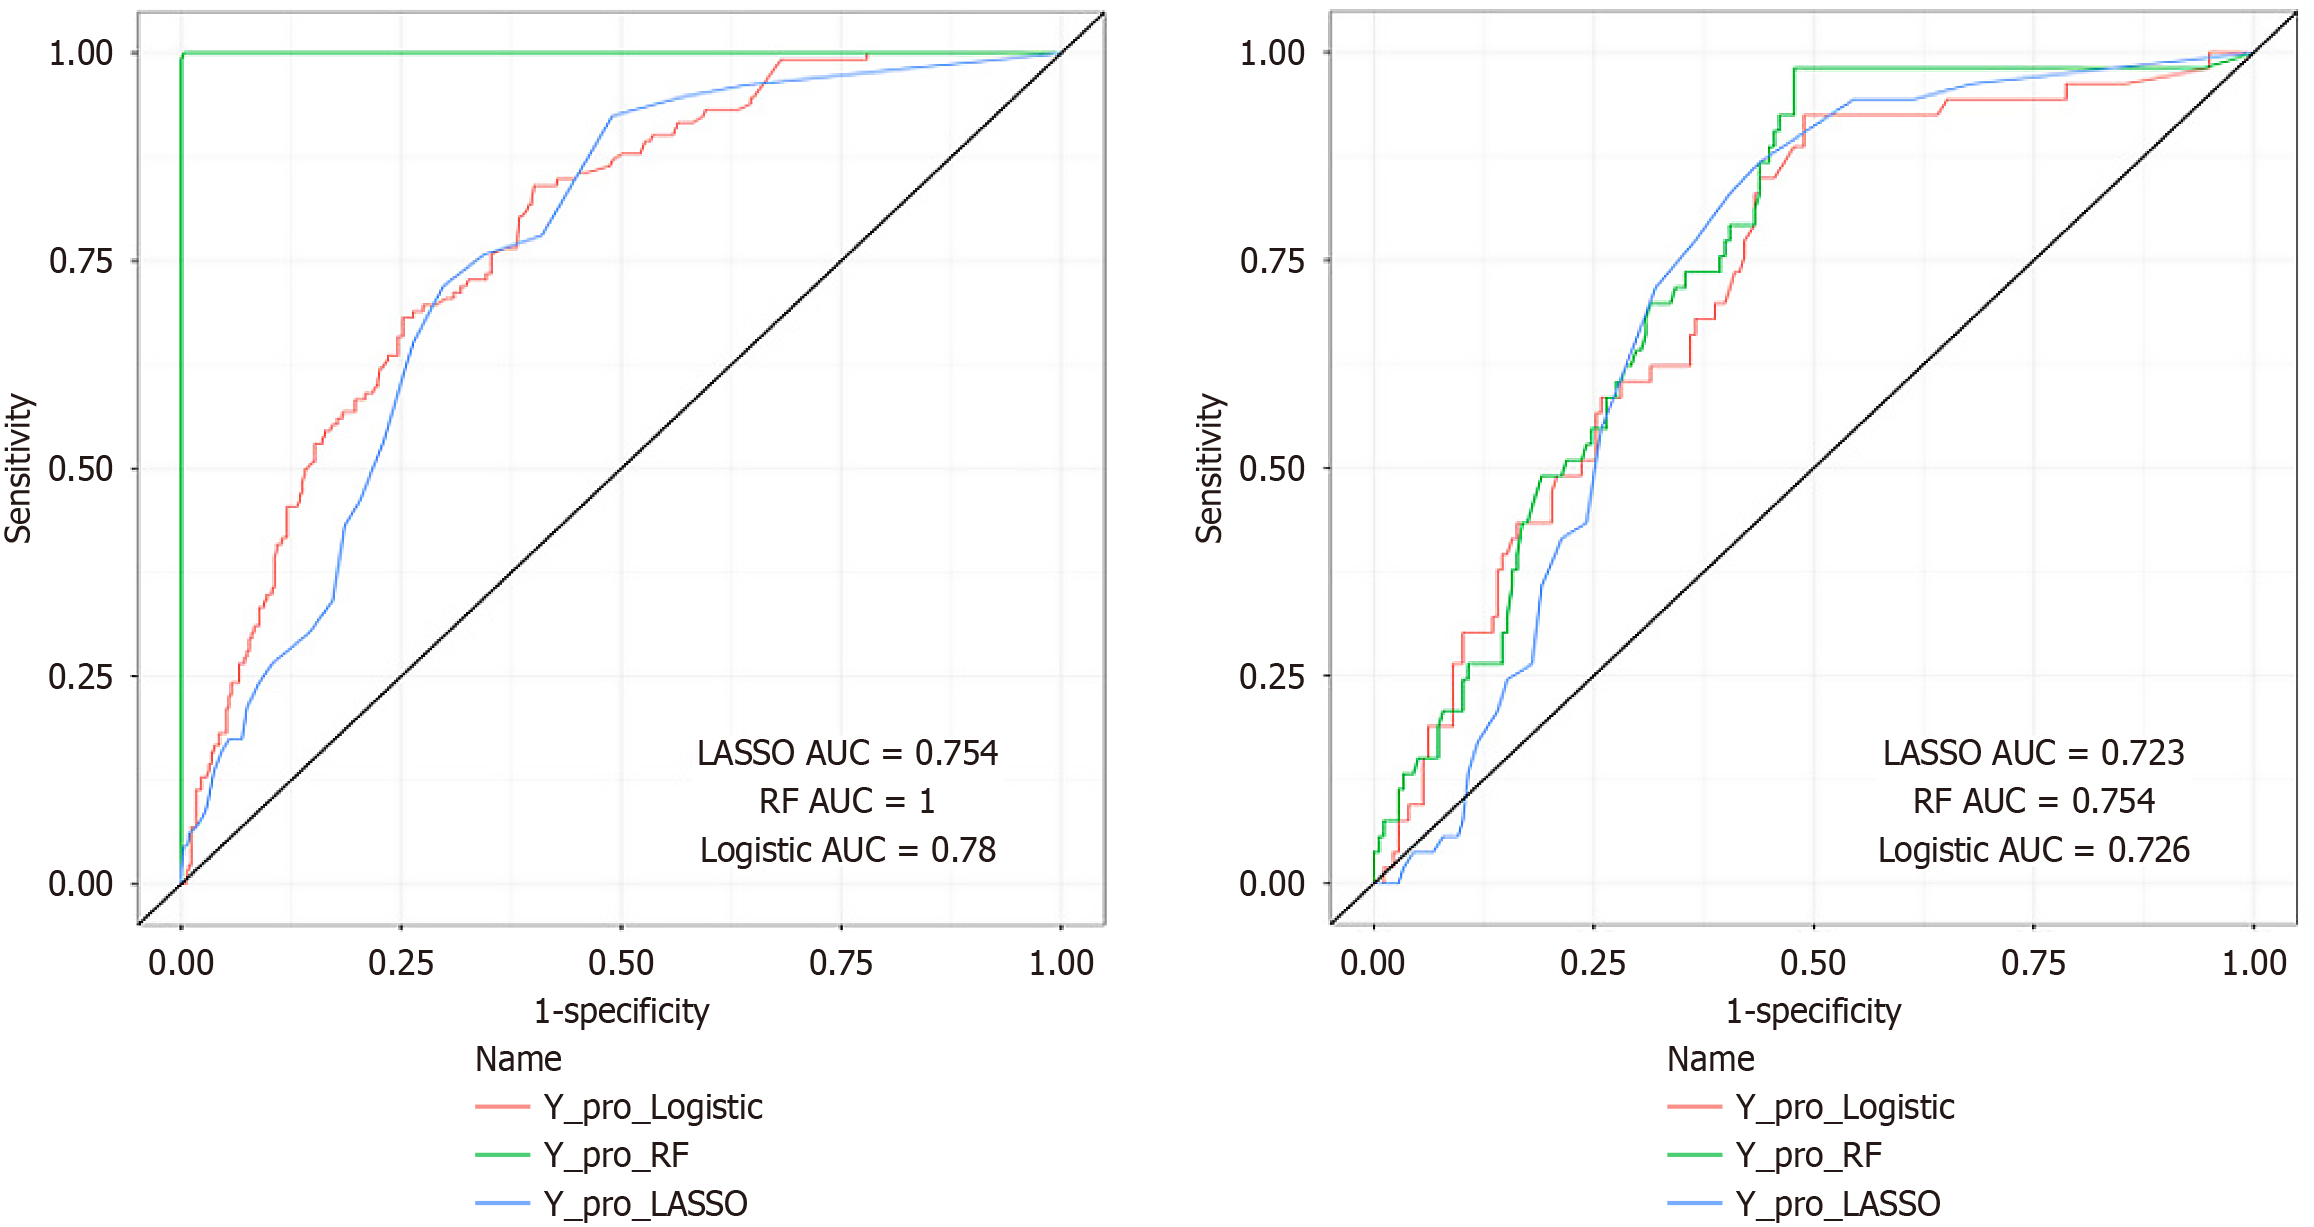
Figure 4 Receiver operating characteristic curves in training and validation set.
A: Receiver operating characteristic (ROC) curves of three models in training set; B: ROC curves of three models in validation set. AUC: Area under the receiver operating characteristic curve; LASSO: Least absolute shrinkage and selection operator; RF: Random forest.
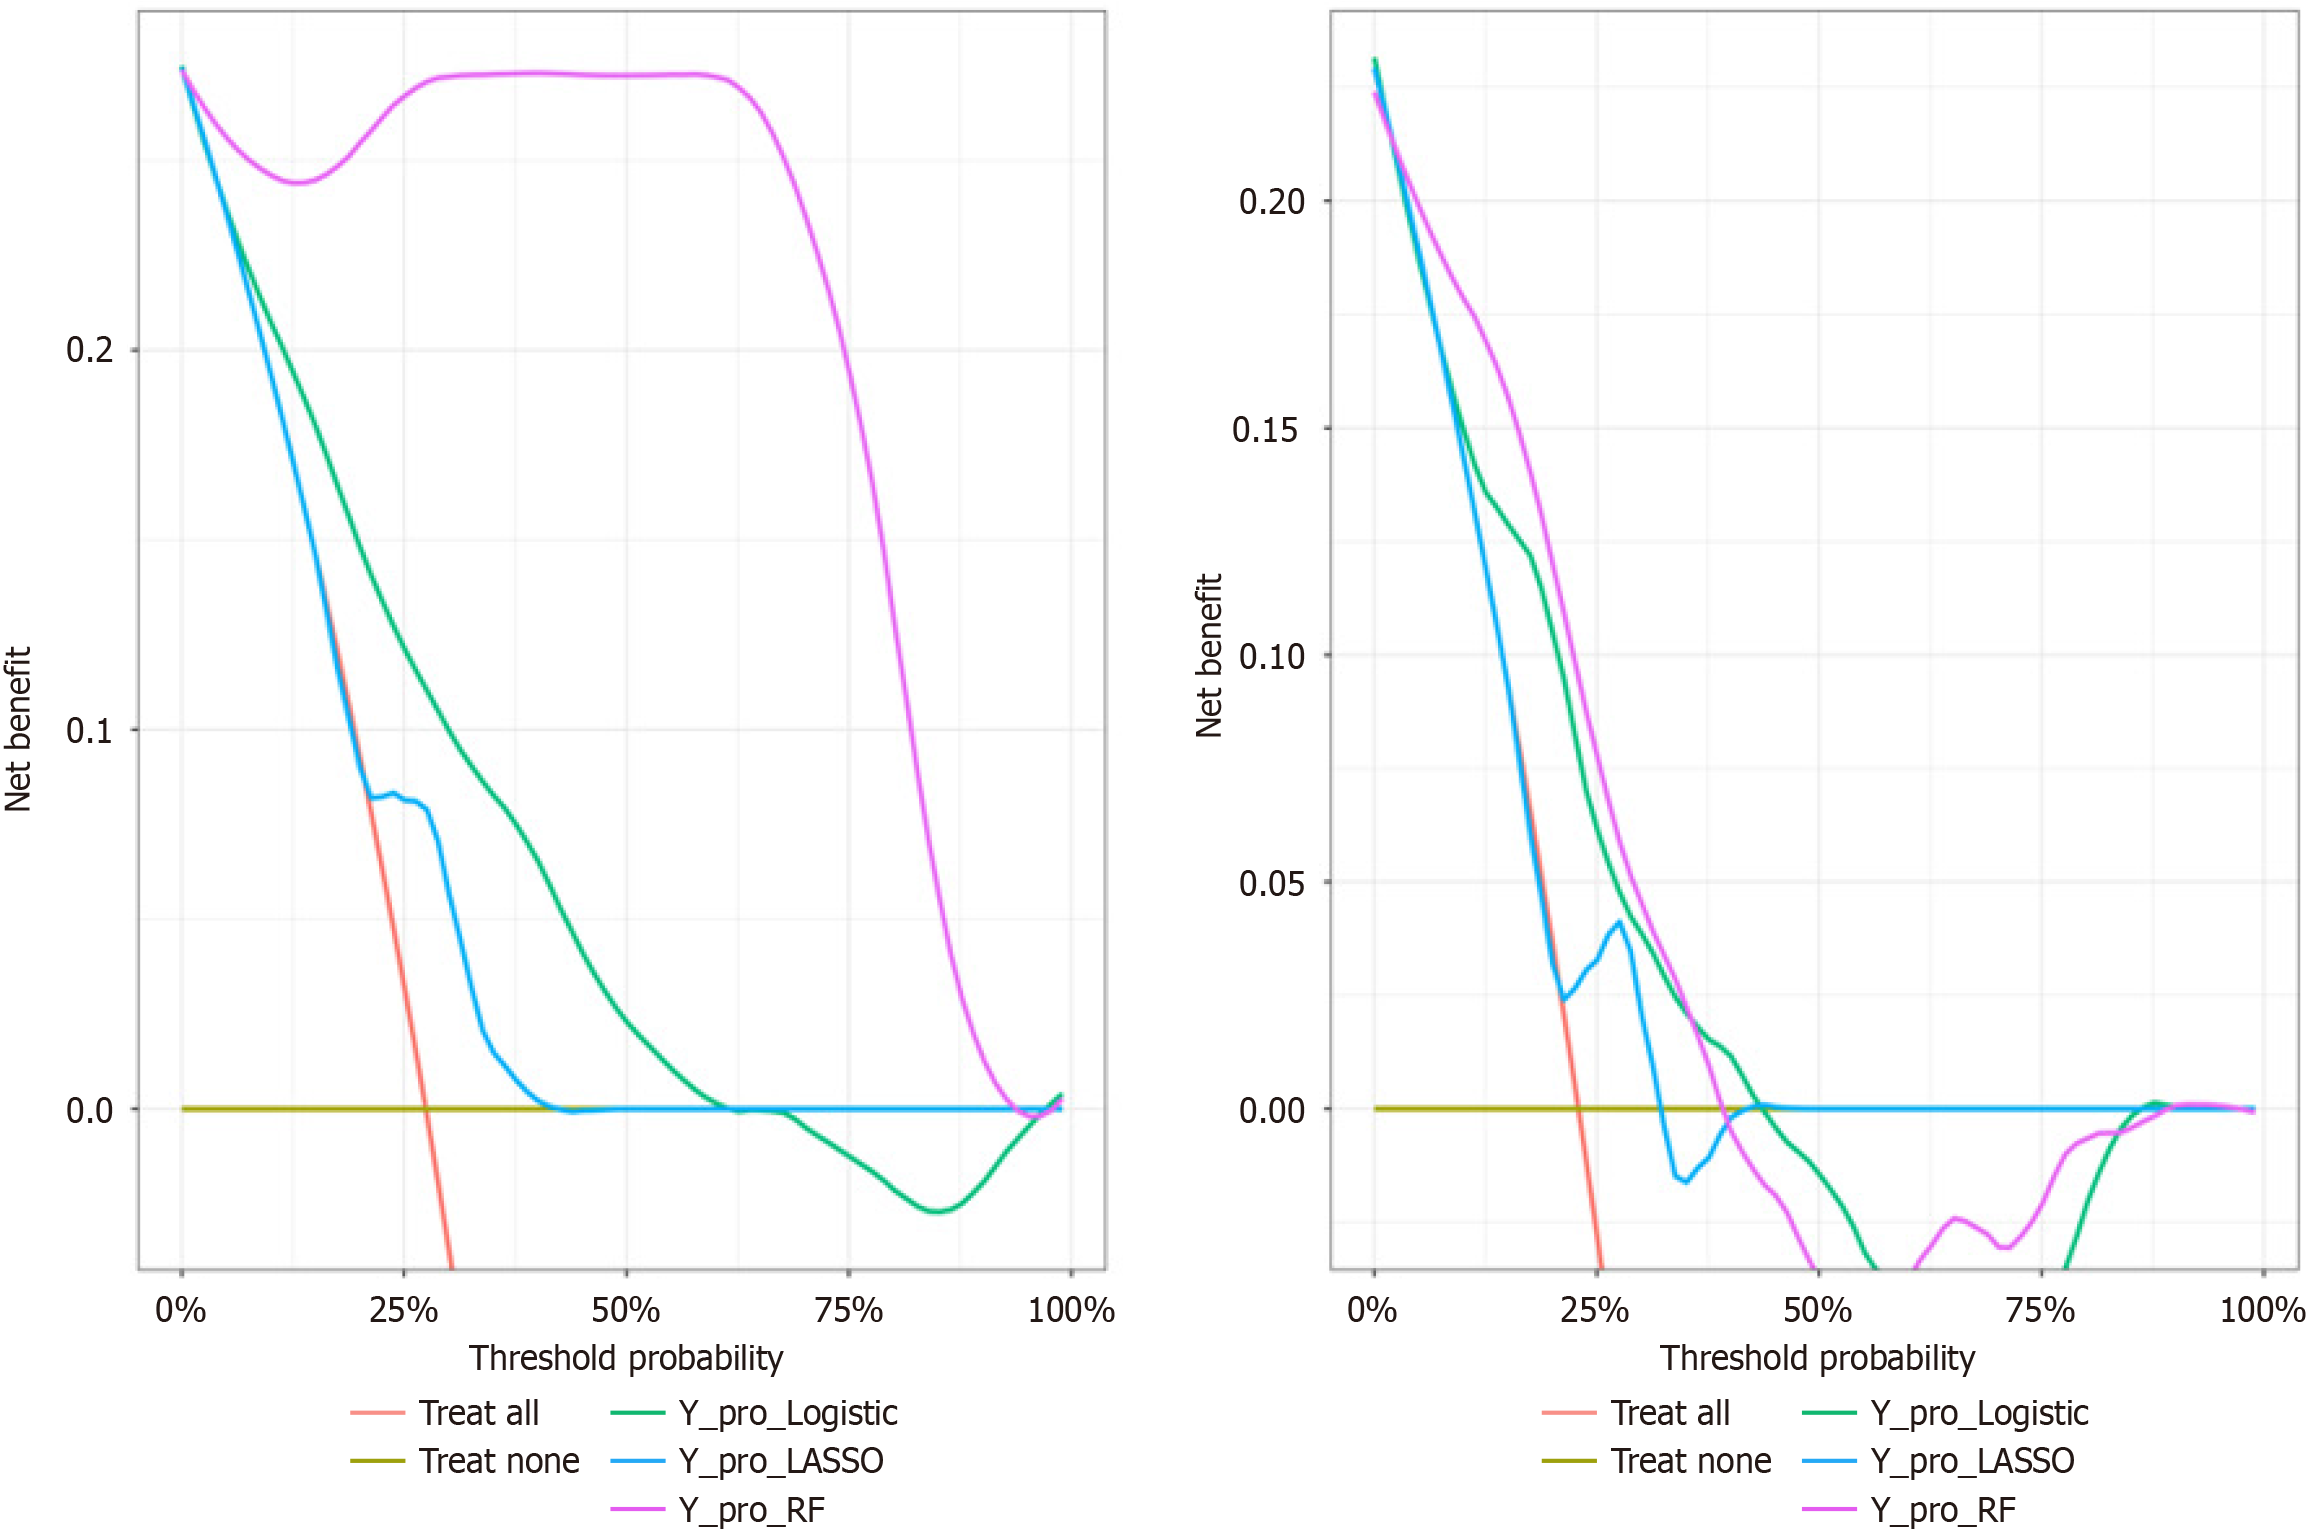
Figure 5 Decision curve analysis curves in training and validation sets.
A: Decision curve analysis (DCA) curves of three models in training set; B: DCA curves of three models in validation set. LASSO: Least absolute shrinkage and selection operator; RF: Random forest.
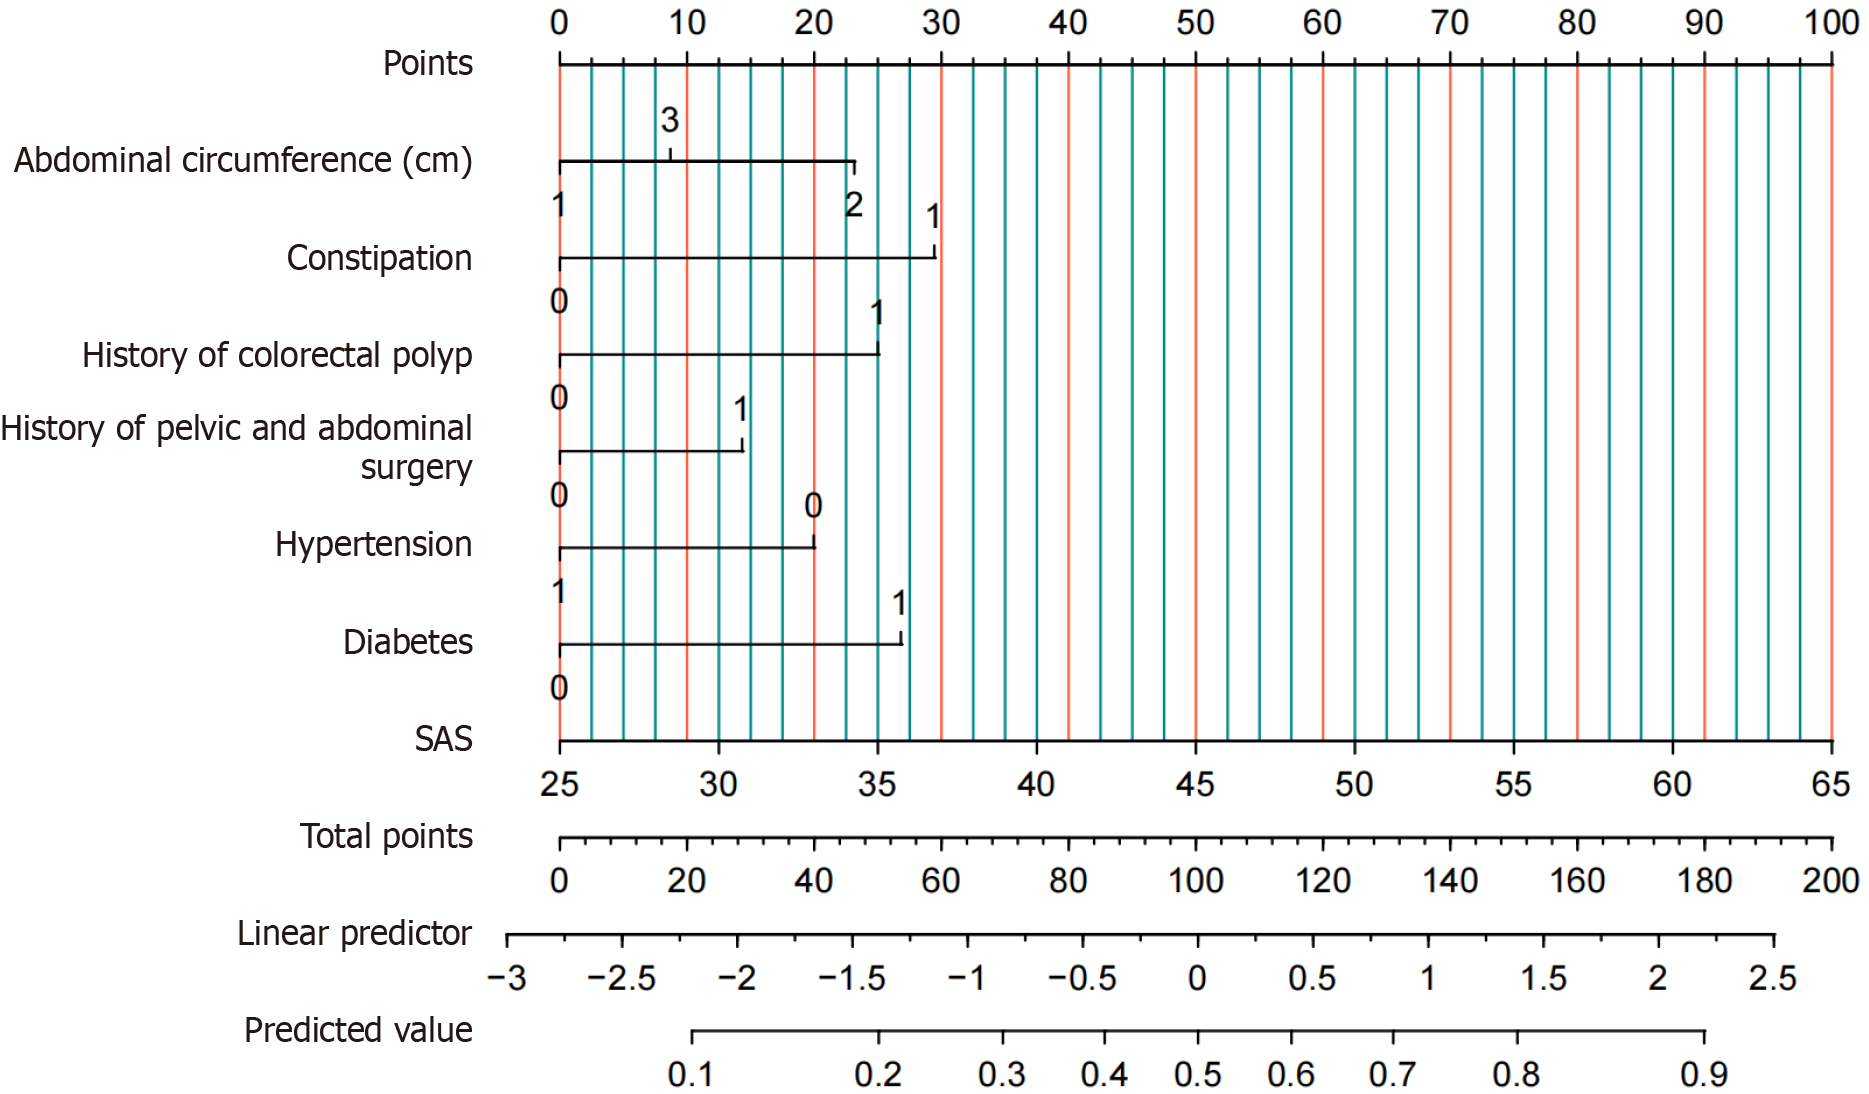
Figure 6 Nomogram prediction model incorporating selected risk factors.
SAS: Self-Rating Anxiety Scale.
- Citation: Gao RX, Wang XL, Tian MJ, Li XM, Zhang JJ, Wang JJ, Gao J, Zhang C, Li ZT. Construction and validation of a machine learning algorithm-based predictive model for difficult colonoscopy insertion. World J Gastrointest Endosc 2025; 17(7): 108307
- URL: https://www.wjgnet.com/1948-5190/full/v17/i7/108307.htm
- DOI: https://dx.doi.org/10.4253/wjge.v17.i7.108307


