Copyright
©The Author(s) 2025.
World J Gastrointest Endosc. Jun 16, 2025; 17(6): 107142
Published online Jun 16, 2025. doi: 10.4253/wjge.v17.i6.107142
Published online Jun 16, 2025. doi: 10.4253/wjge.v17.i6.107142
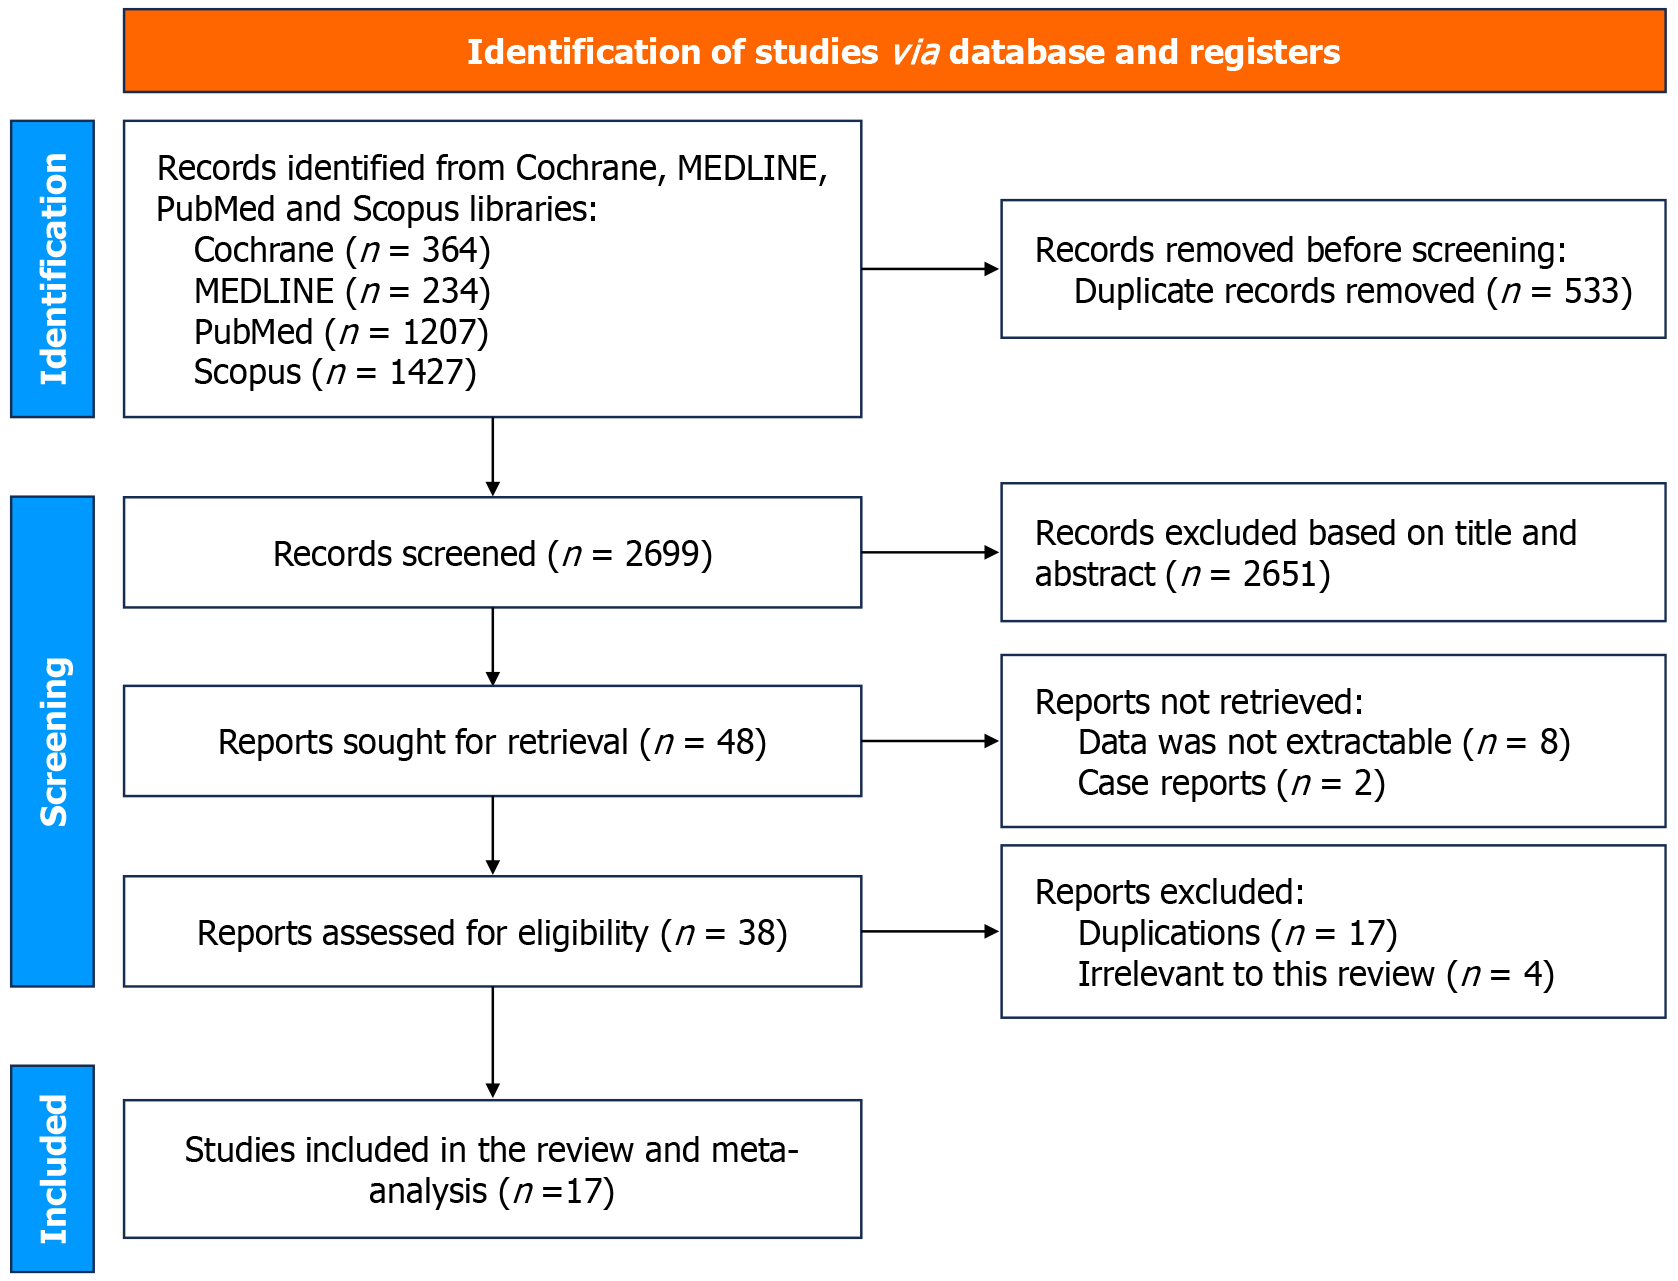
Figure 1
PRISMA flowchart of the included studies.
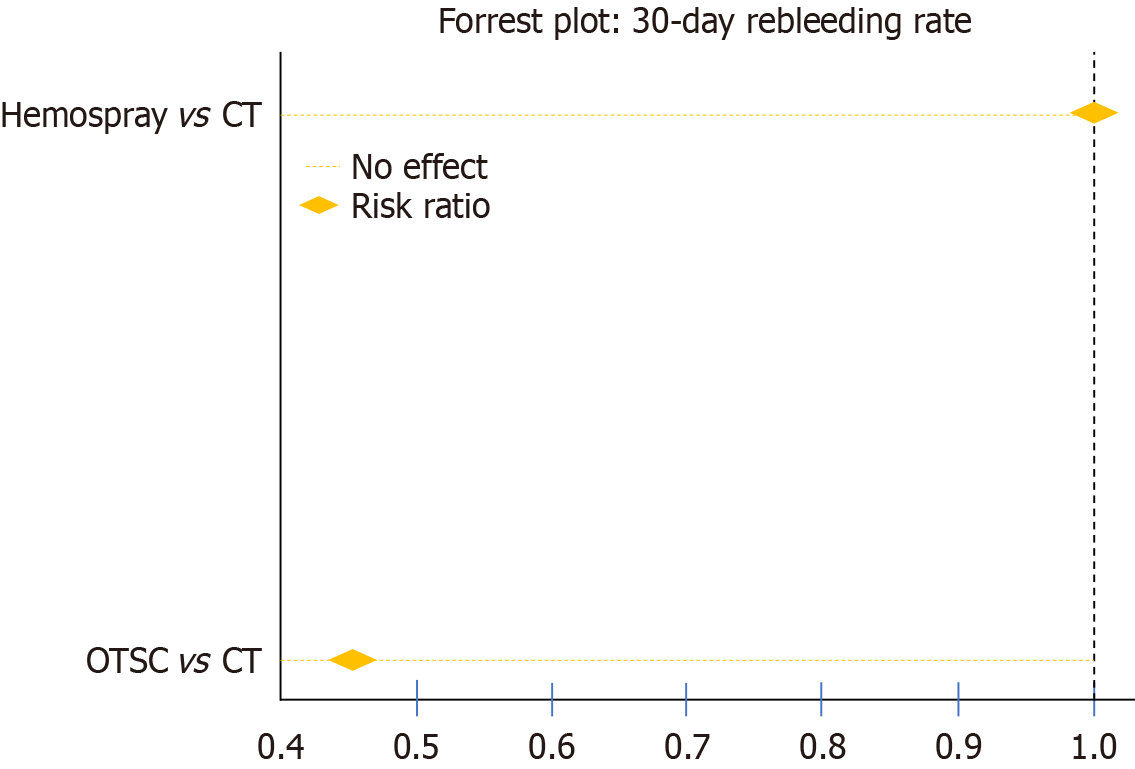
Figure 2 Forest plot demonstrating the 30-day rebleeding rates, comparing over-the-scope clips and hemostatic powder to conventional therapy.
The results indicate that over-the-scope clips demonstrates a significantly lower risk ratio compared to computed tomography [0.47 (95%CI: 0.33-0.65)], suggesting superior efficacy in preventing rebleeding. OTSC: Over-the-scope clips; CT: Computed tomography.
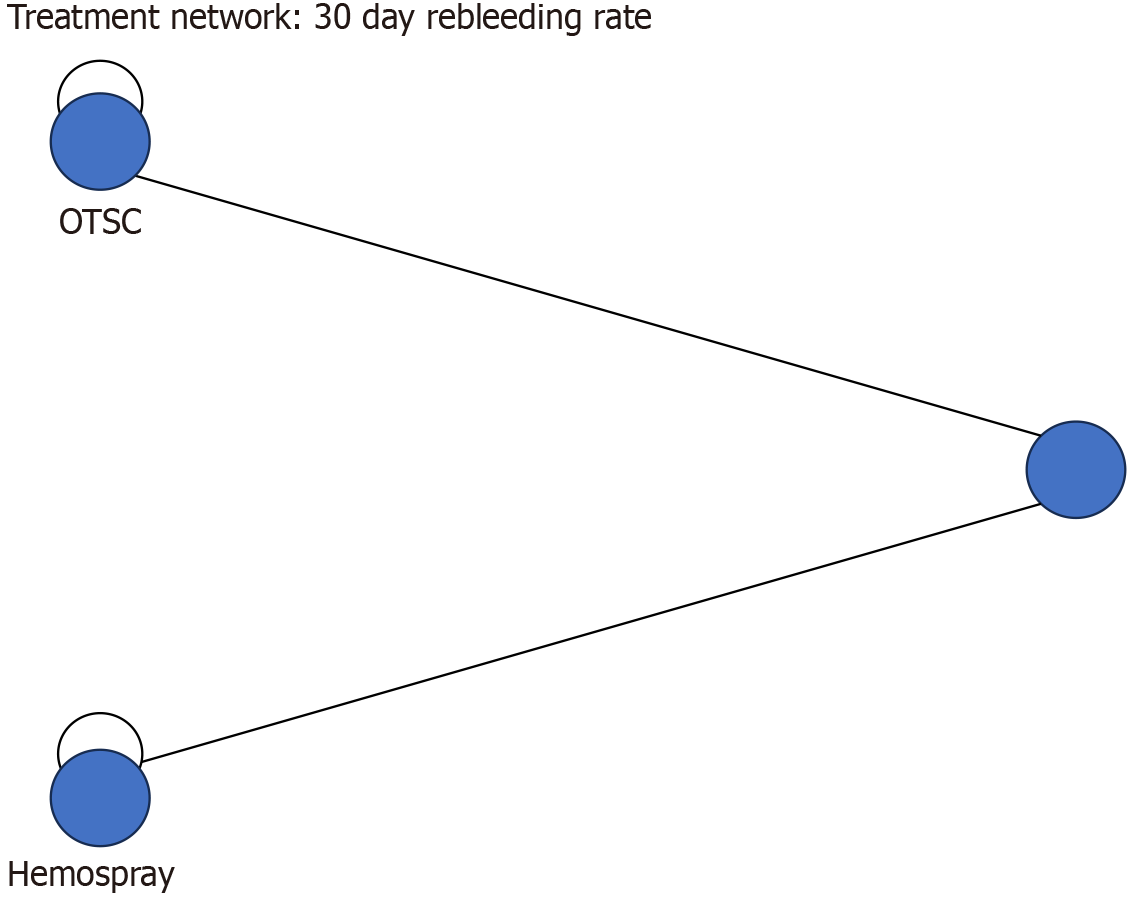
Figure 3 The network meta-analysis visualization illustrates the relationships among the different treatment modalities, providing a comprehensive comparison of their effectiveness.
OTSC: Over-the-scope clips.
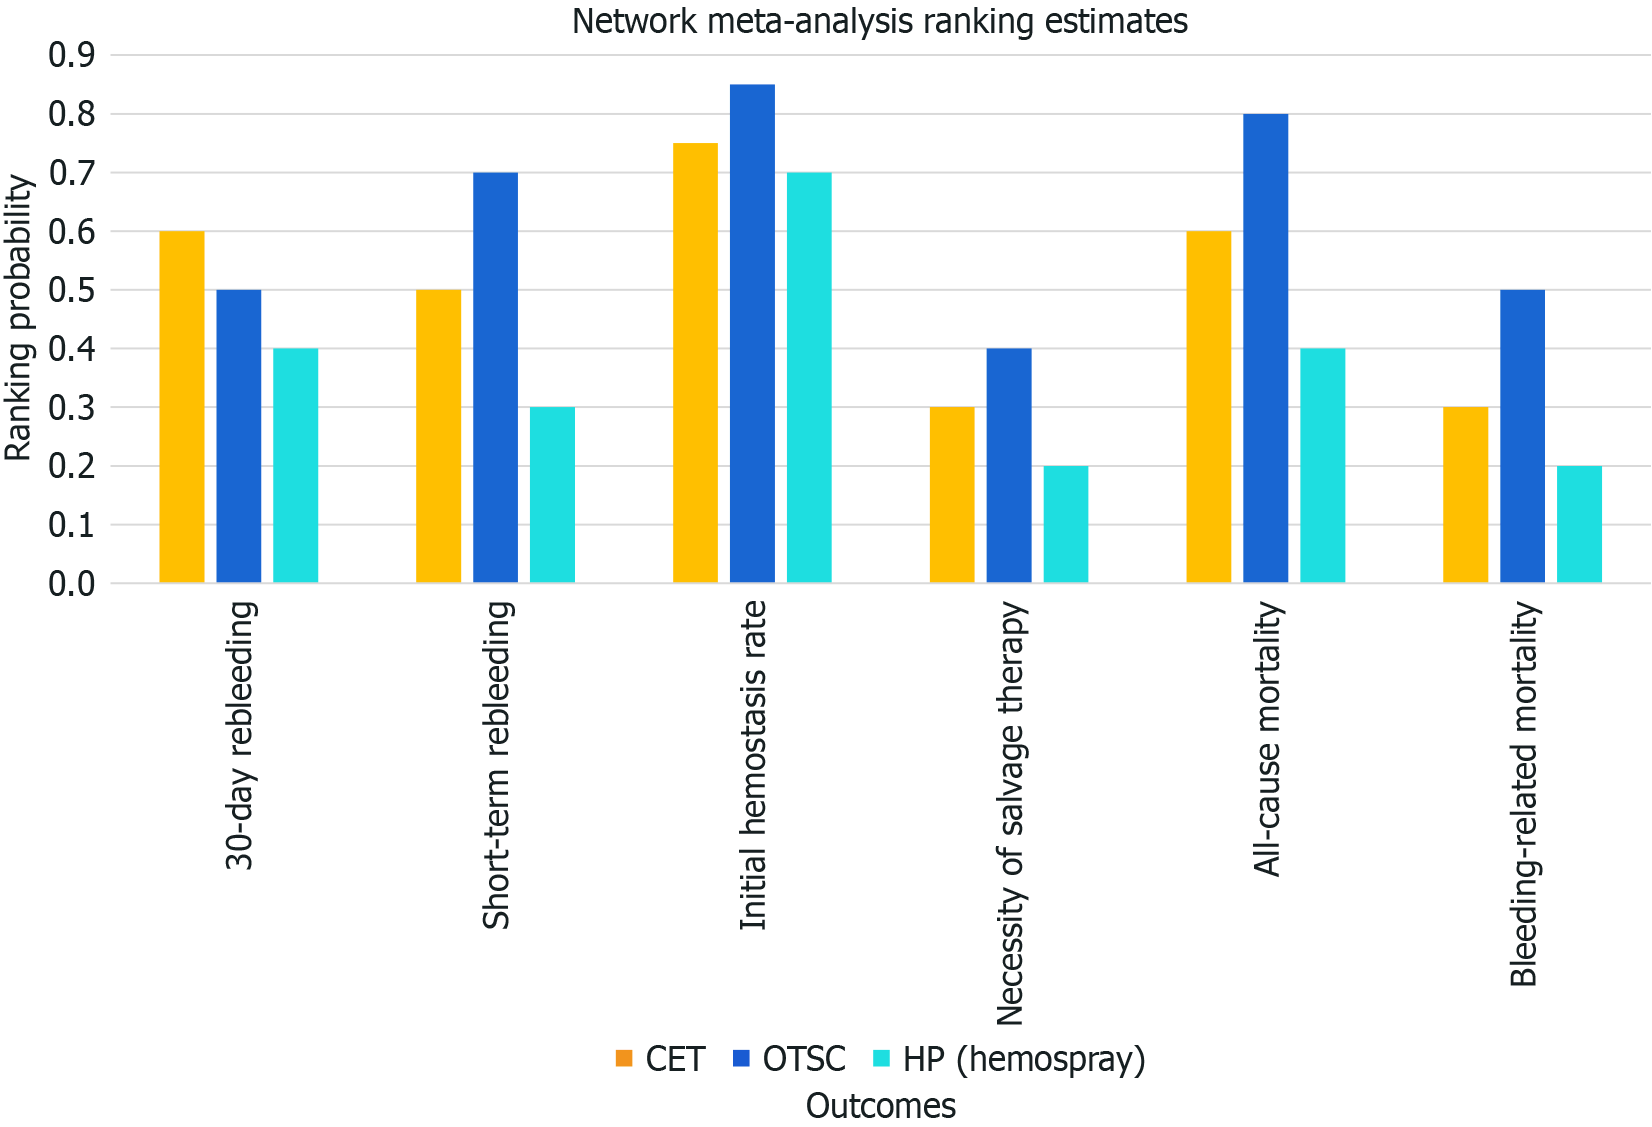
Figure 4 Displays the network meta-analysis ranking visualization, showing the ranking probabilities for treatments (computed tomo
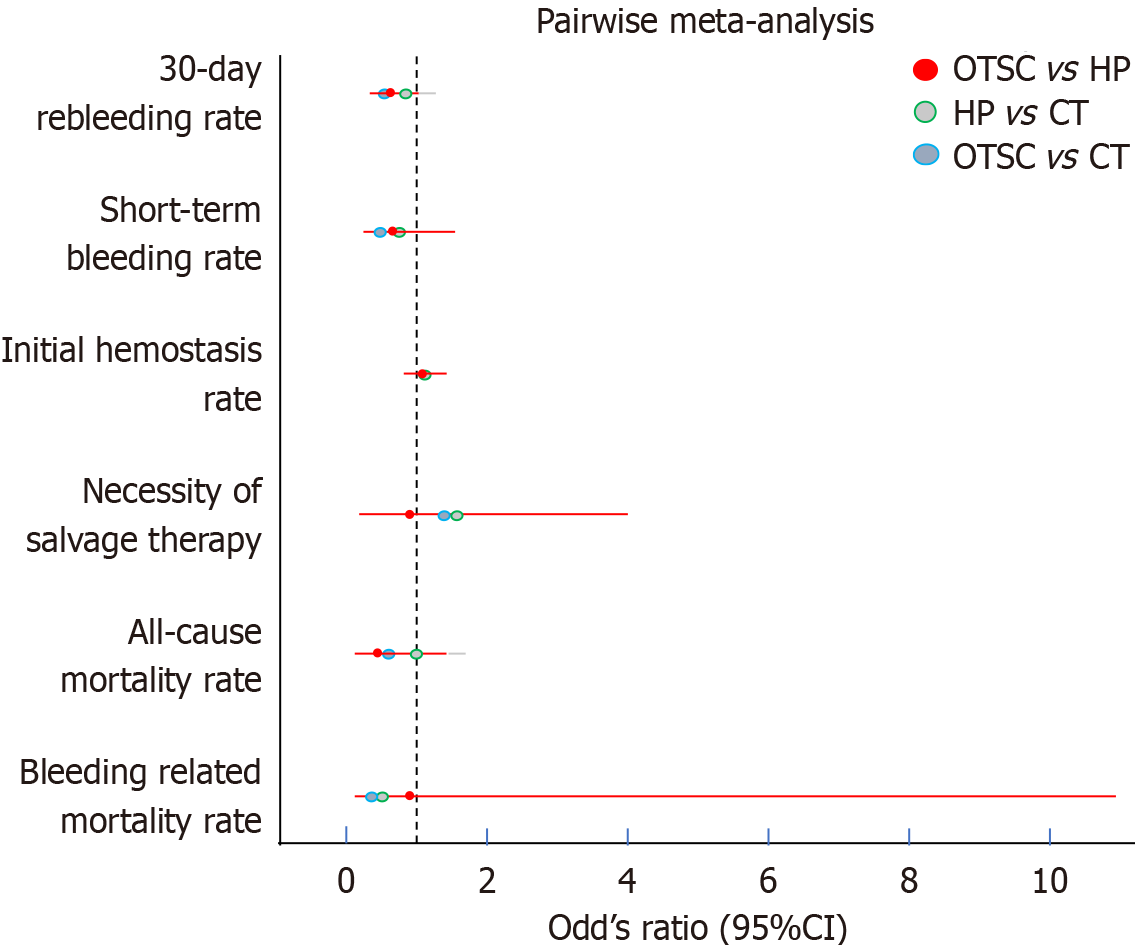
Figure 5 Pairwise meta-analysis comparing over-the-scope clips, hemostatic powders, and conventional therapy across six clinical outcomes.
OR with 95%CI are presented for each outcome. Comparisons include over-the-scope clips (OTSC) vs computed tomography (CT) (blue), hemostatic powder (HP) vs CT (green), and OTSC vs HP (red). The vertical dashed line represents an OR of 1, indicating no difference between groups. OTSC: Over-the-scope clips; HP: Hemostatic powder; CT: Computed tomography.
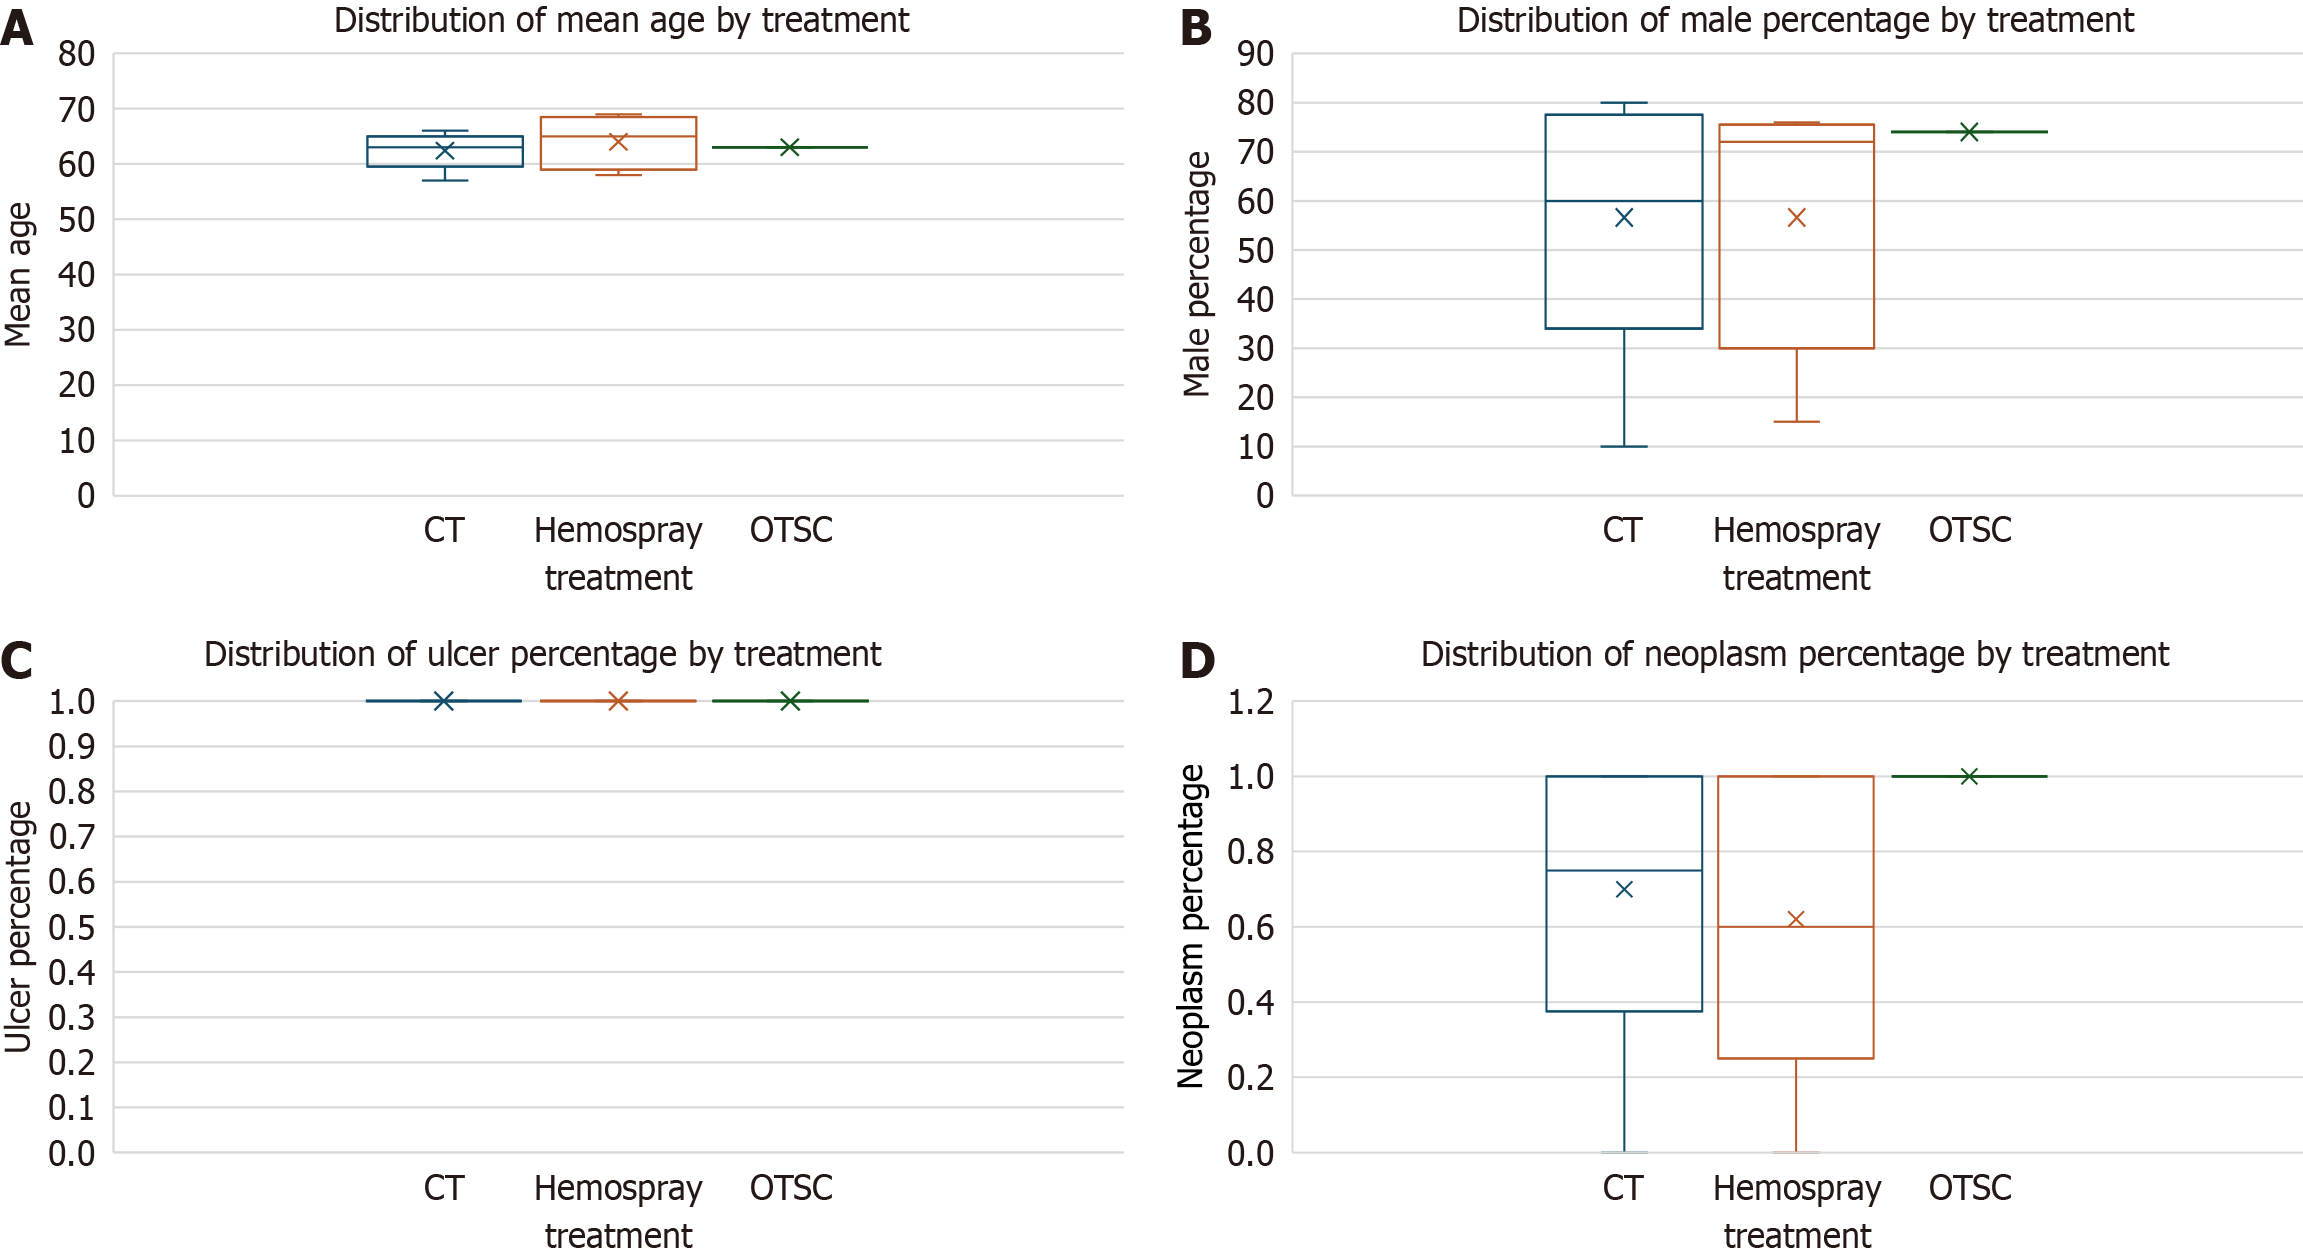
Figure 6 The boxplots show the distribution of key trial-level covariates (mean age, male percentage, ulcer percentage, and neoplasm percentage) across the treatments (over-the-scope clips, hemostatic powder, and computed tomography).
A: Mean age: Similar ranges across all treatment groups, indicating comparability; B: Male percentage: Slight differences but overlaps suggest transitivity is likely maintained; C: Ulcer percentage: Variability observed between groups; may need further exploration for potential impact; D: Neoplasm percentage: Differences between treatment groups could affect transitivity, especially if one treatment is more commonly applied in neoplasm-related cases. OTSC: Over-the-scope clips; HP: Hemostatic powder; CT: Computed tomography.
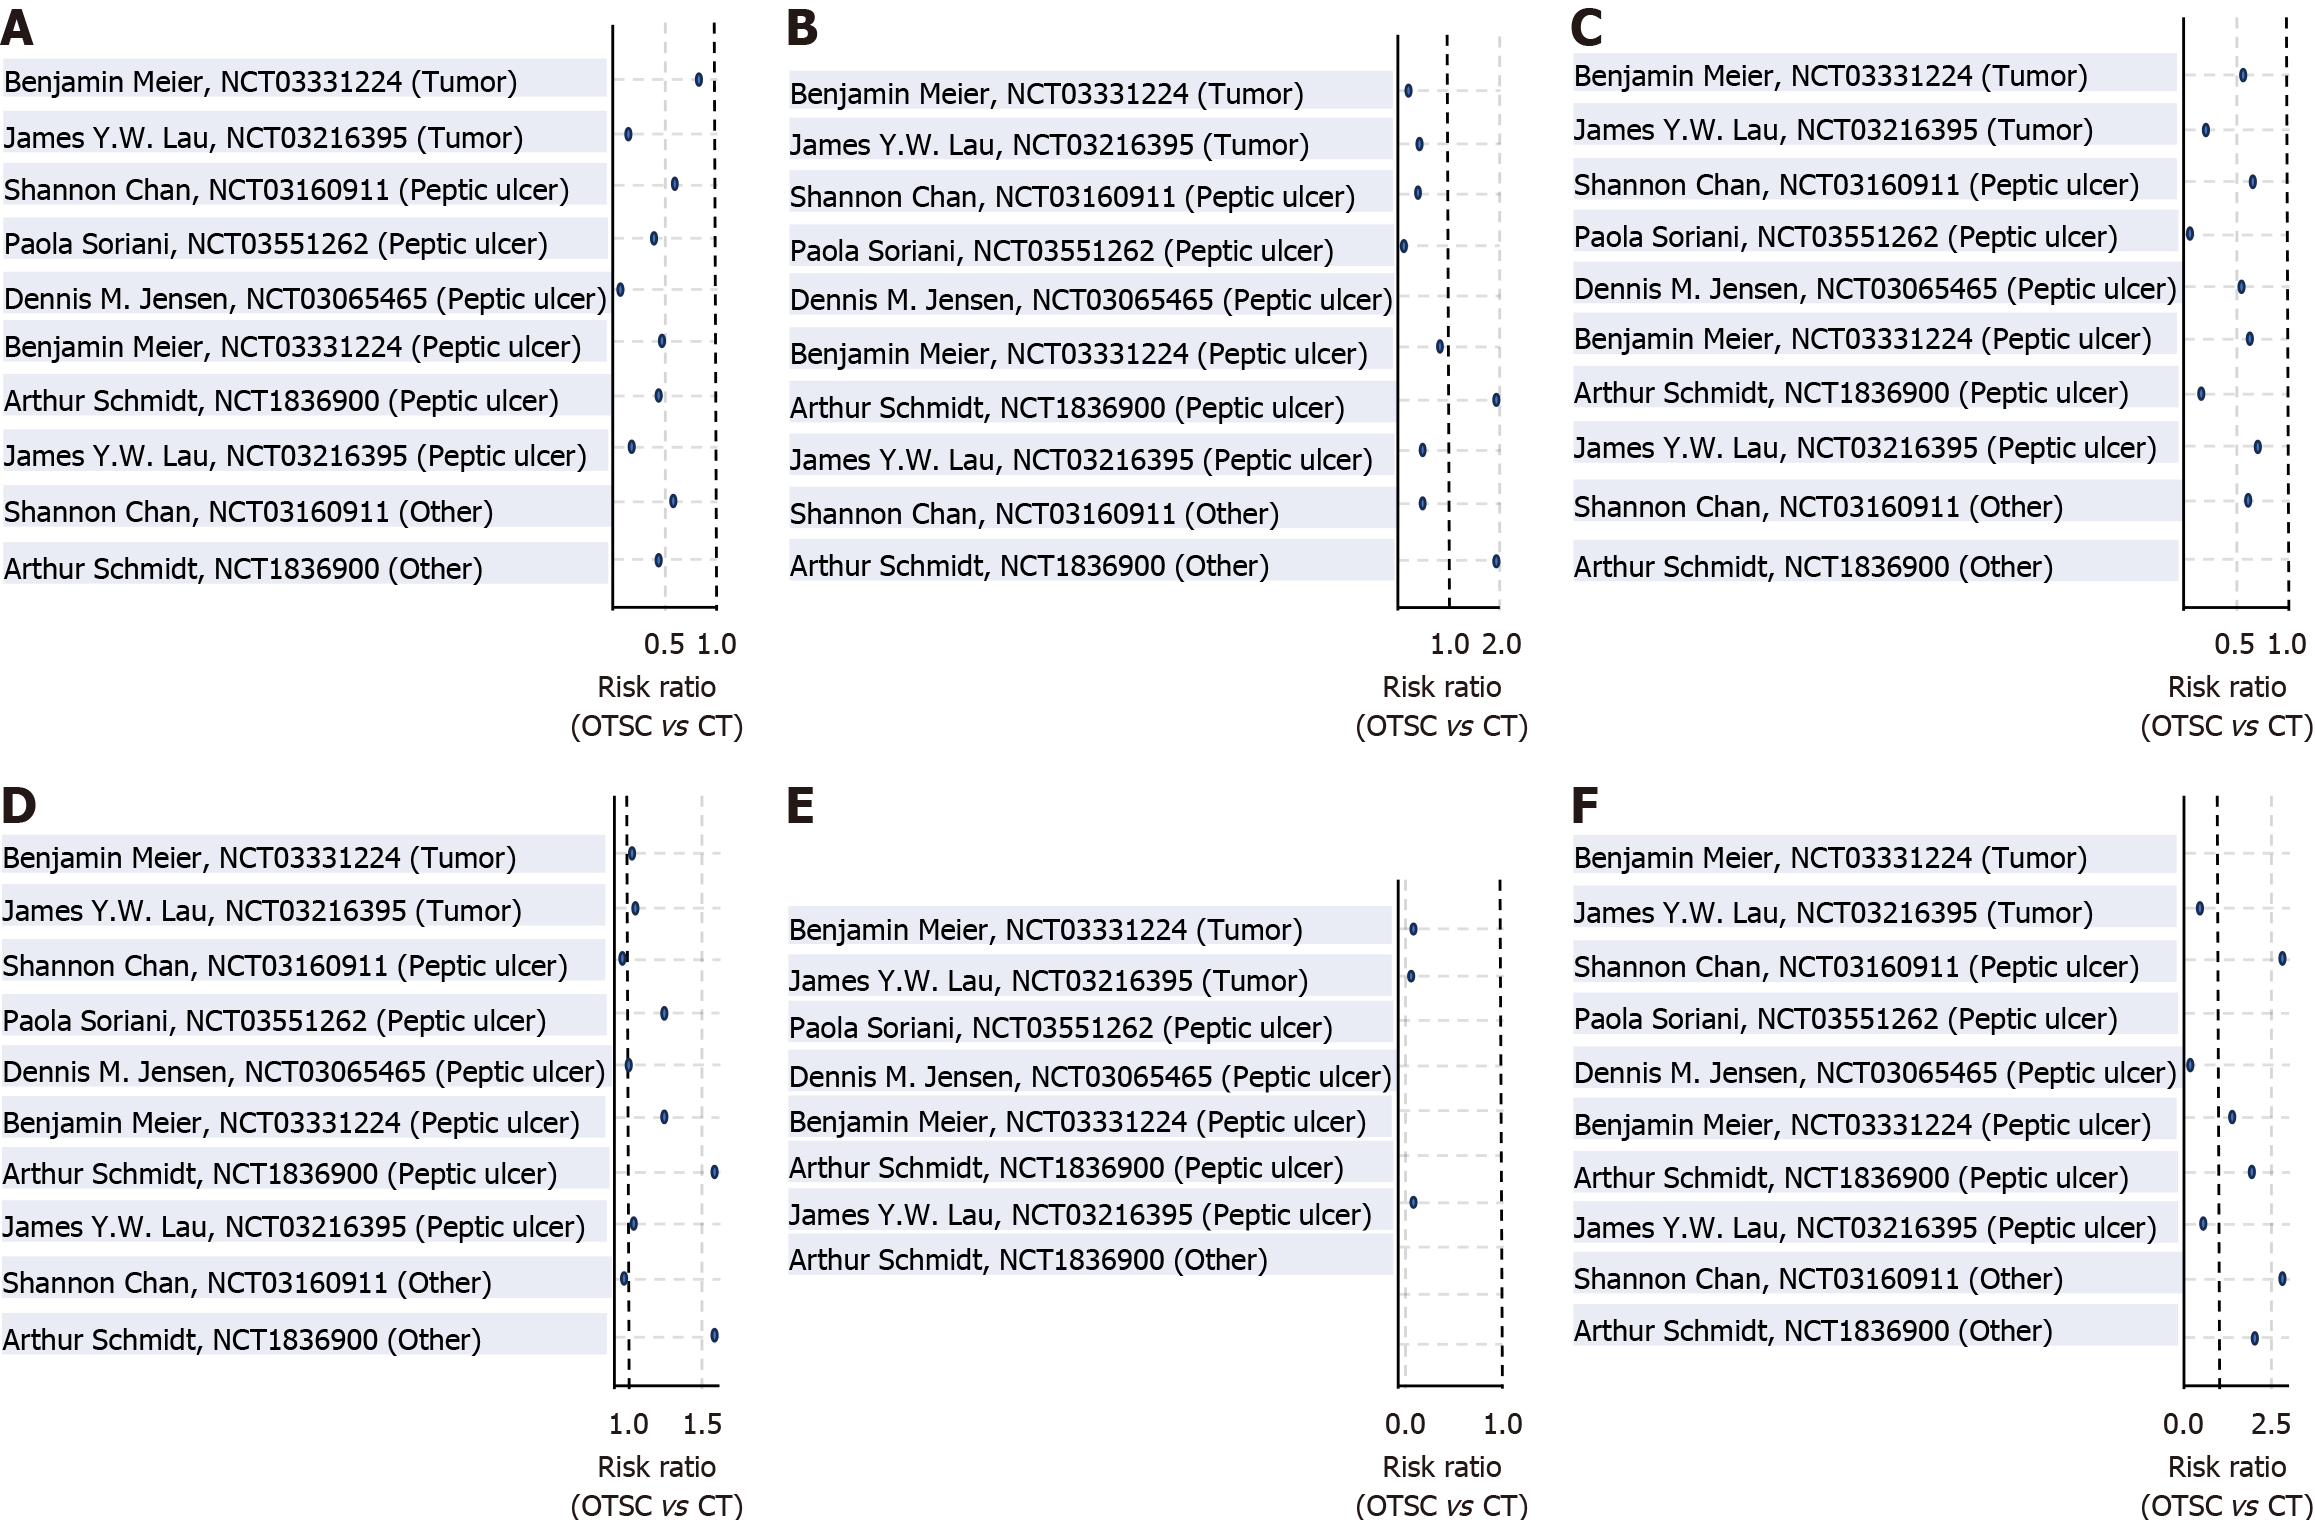
Figure 7 Forest plots comparing all outcomes between over-the-scope clip therapy and conventional therapy across all subgroups including bleeding from peptic ulcer, tumor and other (including Mallory-Weiss tear, Deulofeu’s lesion and other lesions).
A: Forrest plot: 30-day rebleeding; B: Forrest plot: Short term rebleeding; C: Forrest plot: Initial hemostasis; D: Forrest plot: Surgical/TAE necessity; E: Forrest plot: 30-day mortality; F: Forrest plot: Bleeding mortality.
- Citation: Duggal S, Kalra I, Kalra K, Bhagat V. Advancing hemostasis: A meta-analysis of novel vs conventional endoscopic therapies for non variceal upper gastrointestinal bleeding. World J Gastrointest Endosc 2025; 17(6): 107142
- URL: https://www.wjgnet.com/1948-5190/full/v17/i6/107142.htm
- DOI: https://dx.doi.org/10.4253/wjge.v17.i6.107142


