Copyright
©The Author(s) 2023.
World J Gastrointest Endosc. Dec 16, 2023; 15(12): 735-744
Published online Dec 16, 2023. doi: 10.4253/wjge.v15.i12.735
Published online Dec 16, 2023. doi: 10.4253/wjge.v15.i12.735
Figure 1
Flow diagram of specific literature searching process.
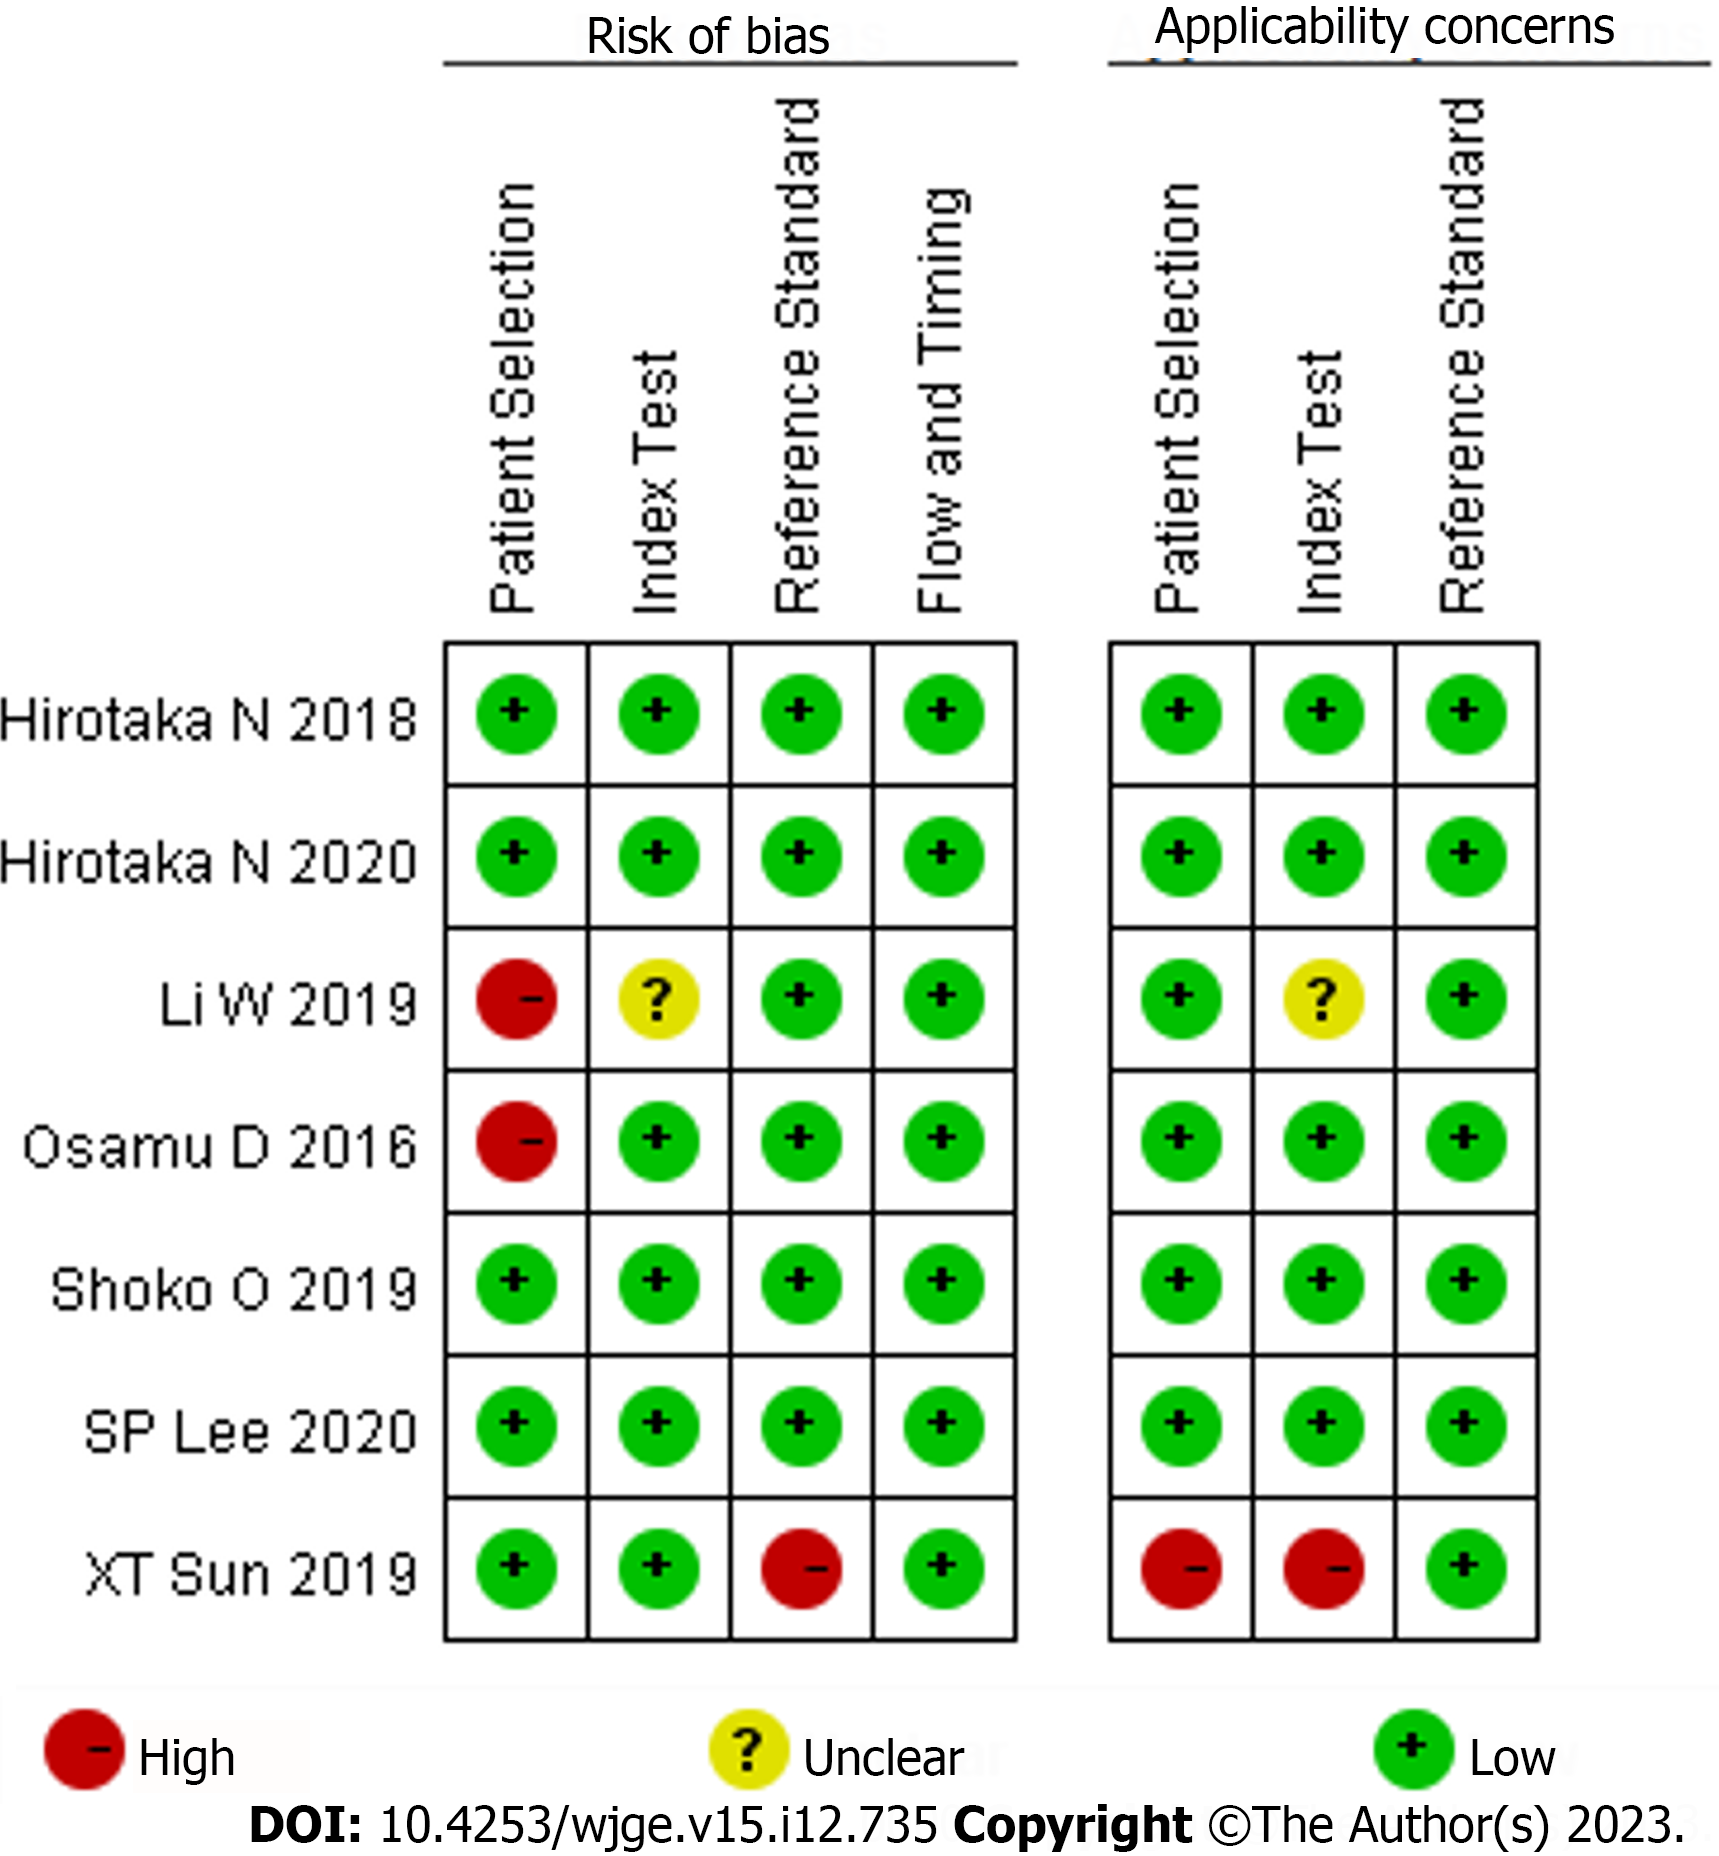
Figure 2
The assessment of bias risk.
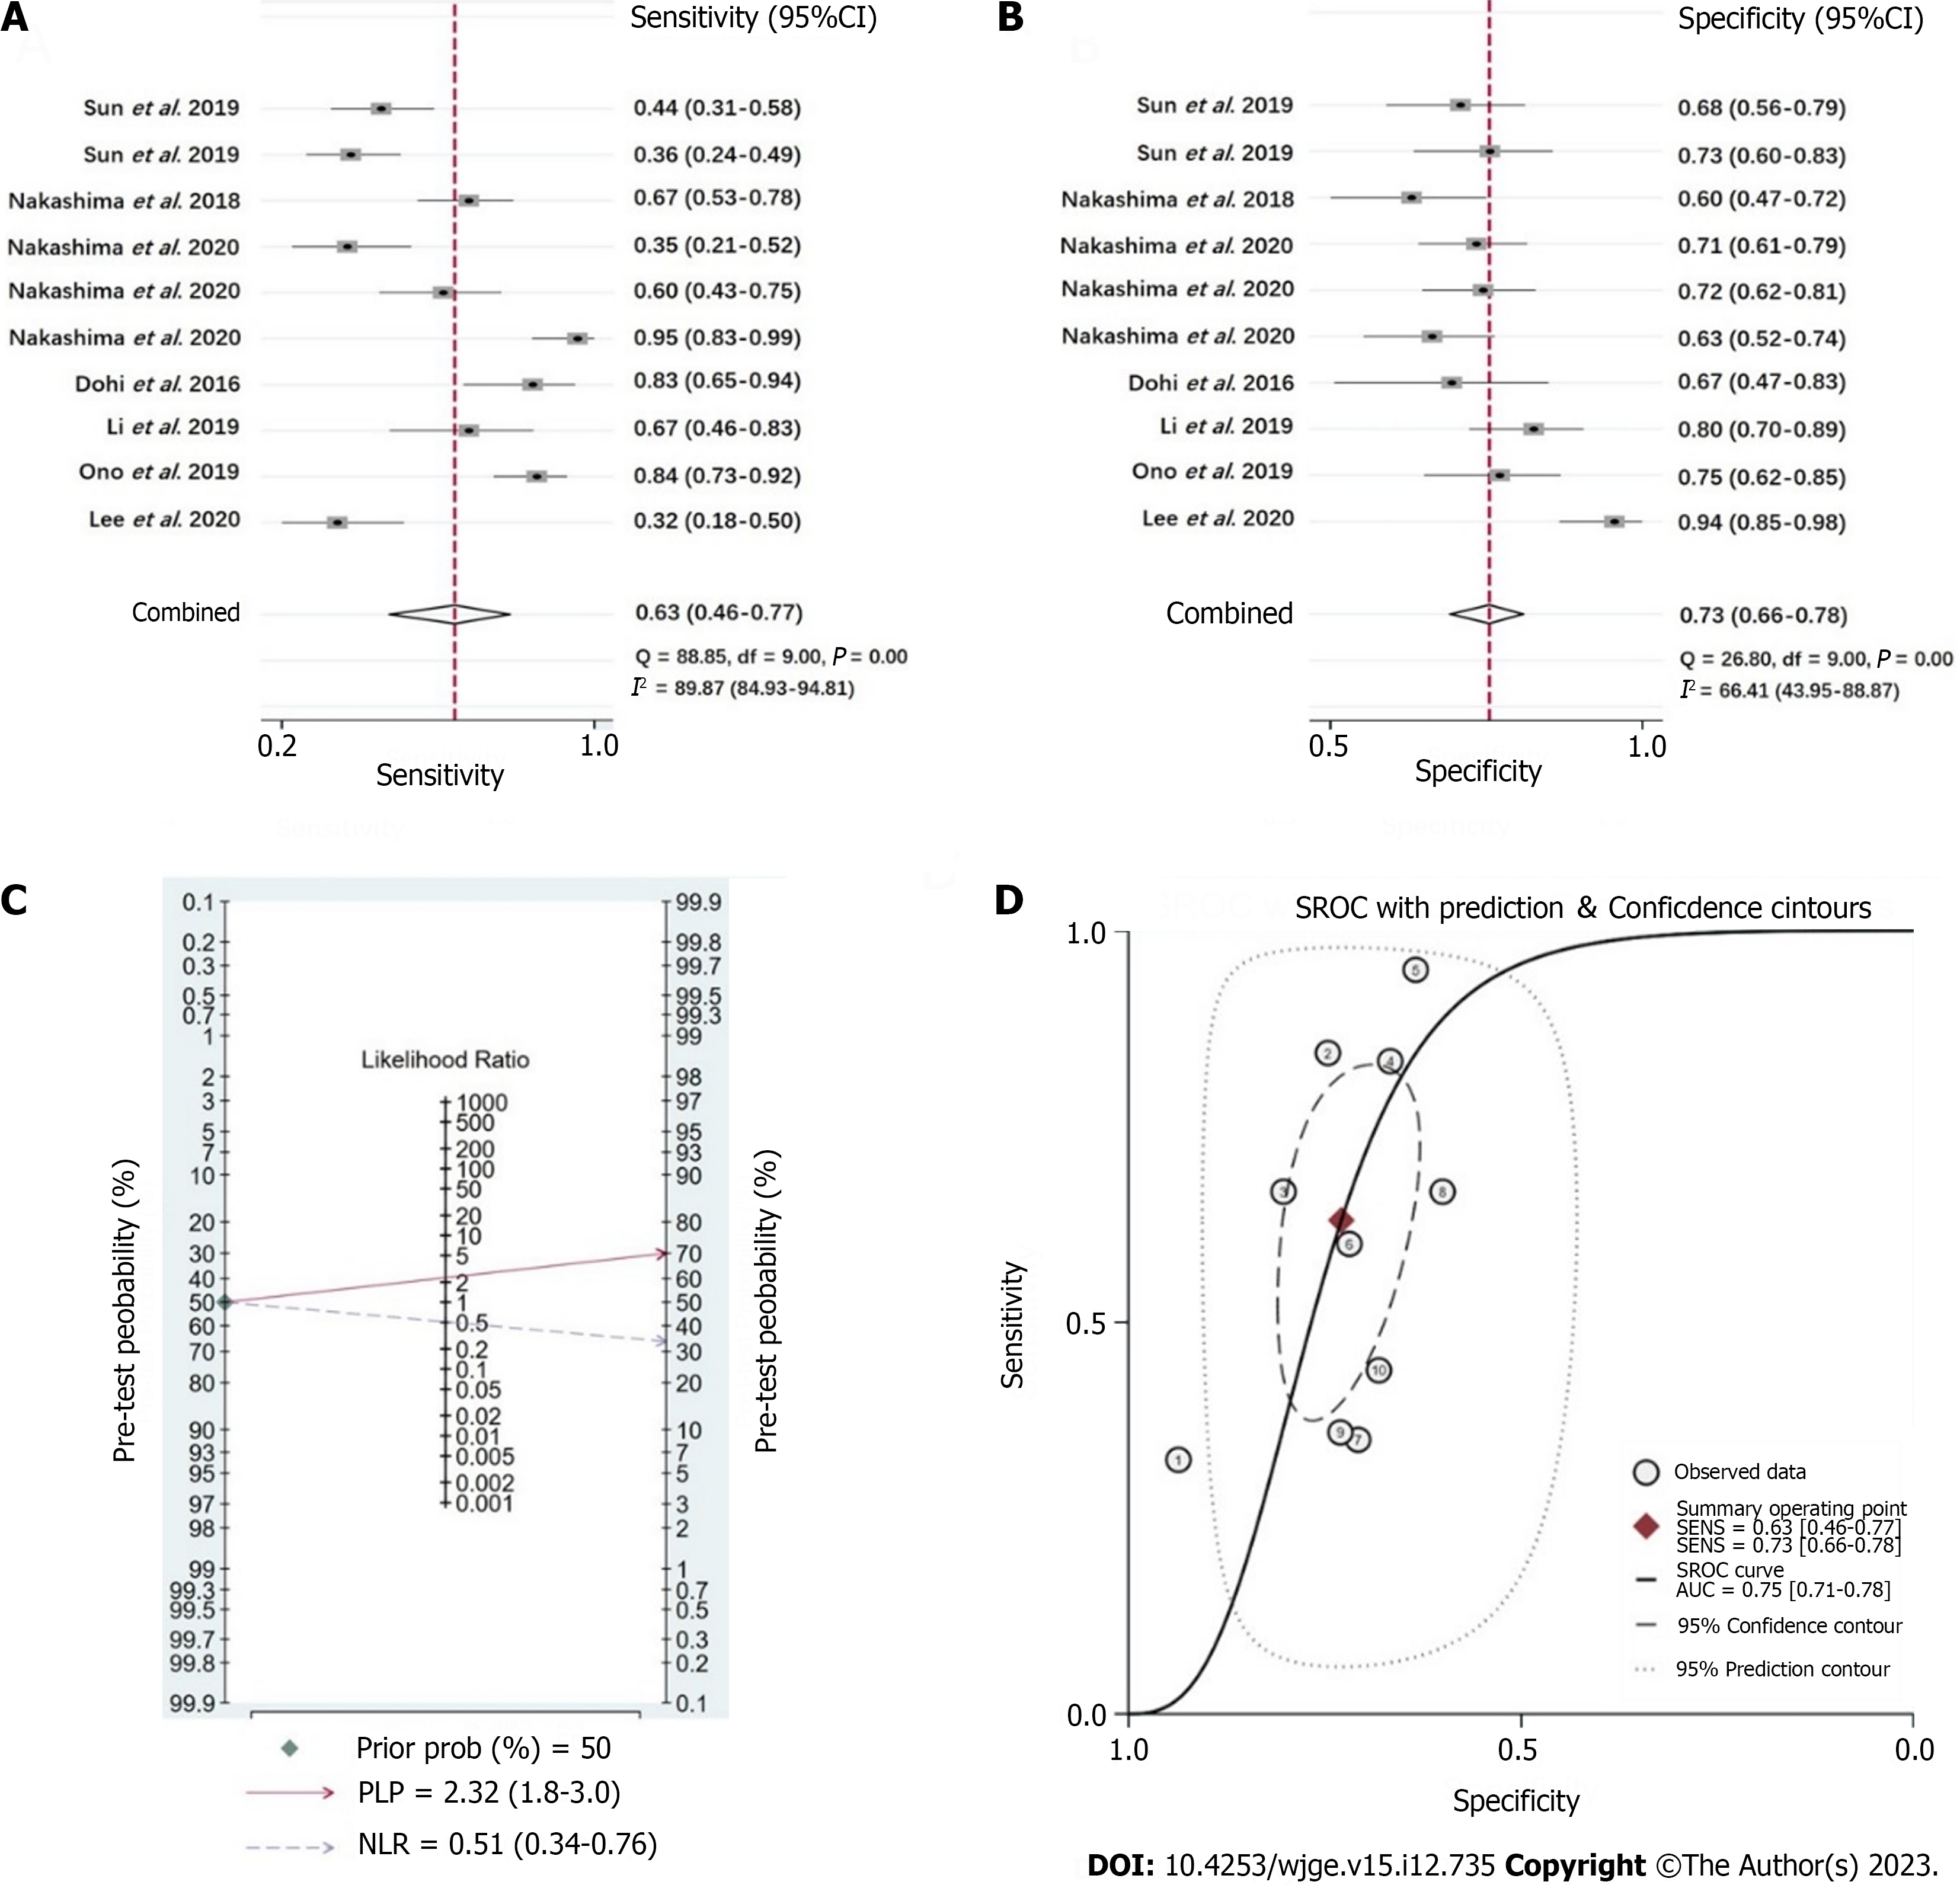
Figure 3 Pooled results of efficacy of white light imaging on Helicobacter pylori infection diagnosis.
A-D: Pooled sensitivity (A), specificity (B), positive likelihood ratio and negative likelihood ratio (C). Symmetric receiver operator characteristic curve and area under the curve (D). 95%CI: 95% confidence interval; SROC: Symmetric receiver operator characteristic; PLR: Positive likelihood rate; NLR: Negative likelihood rate.
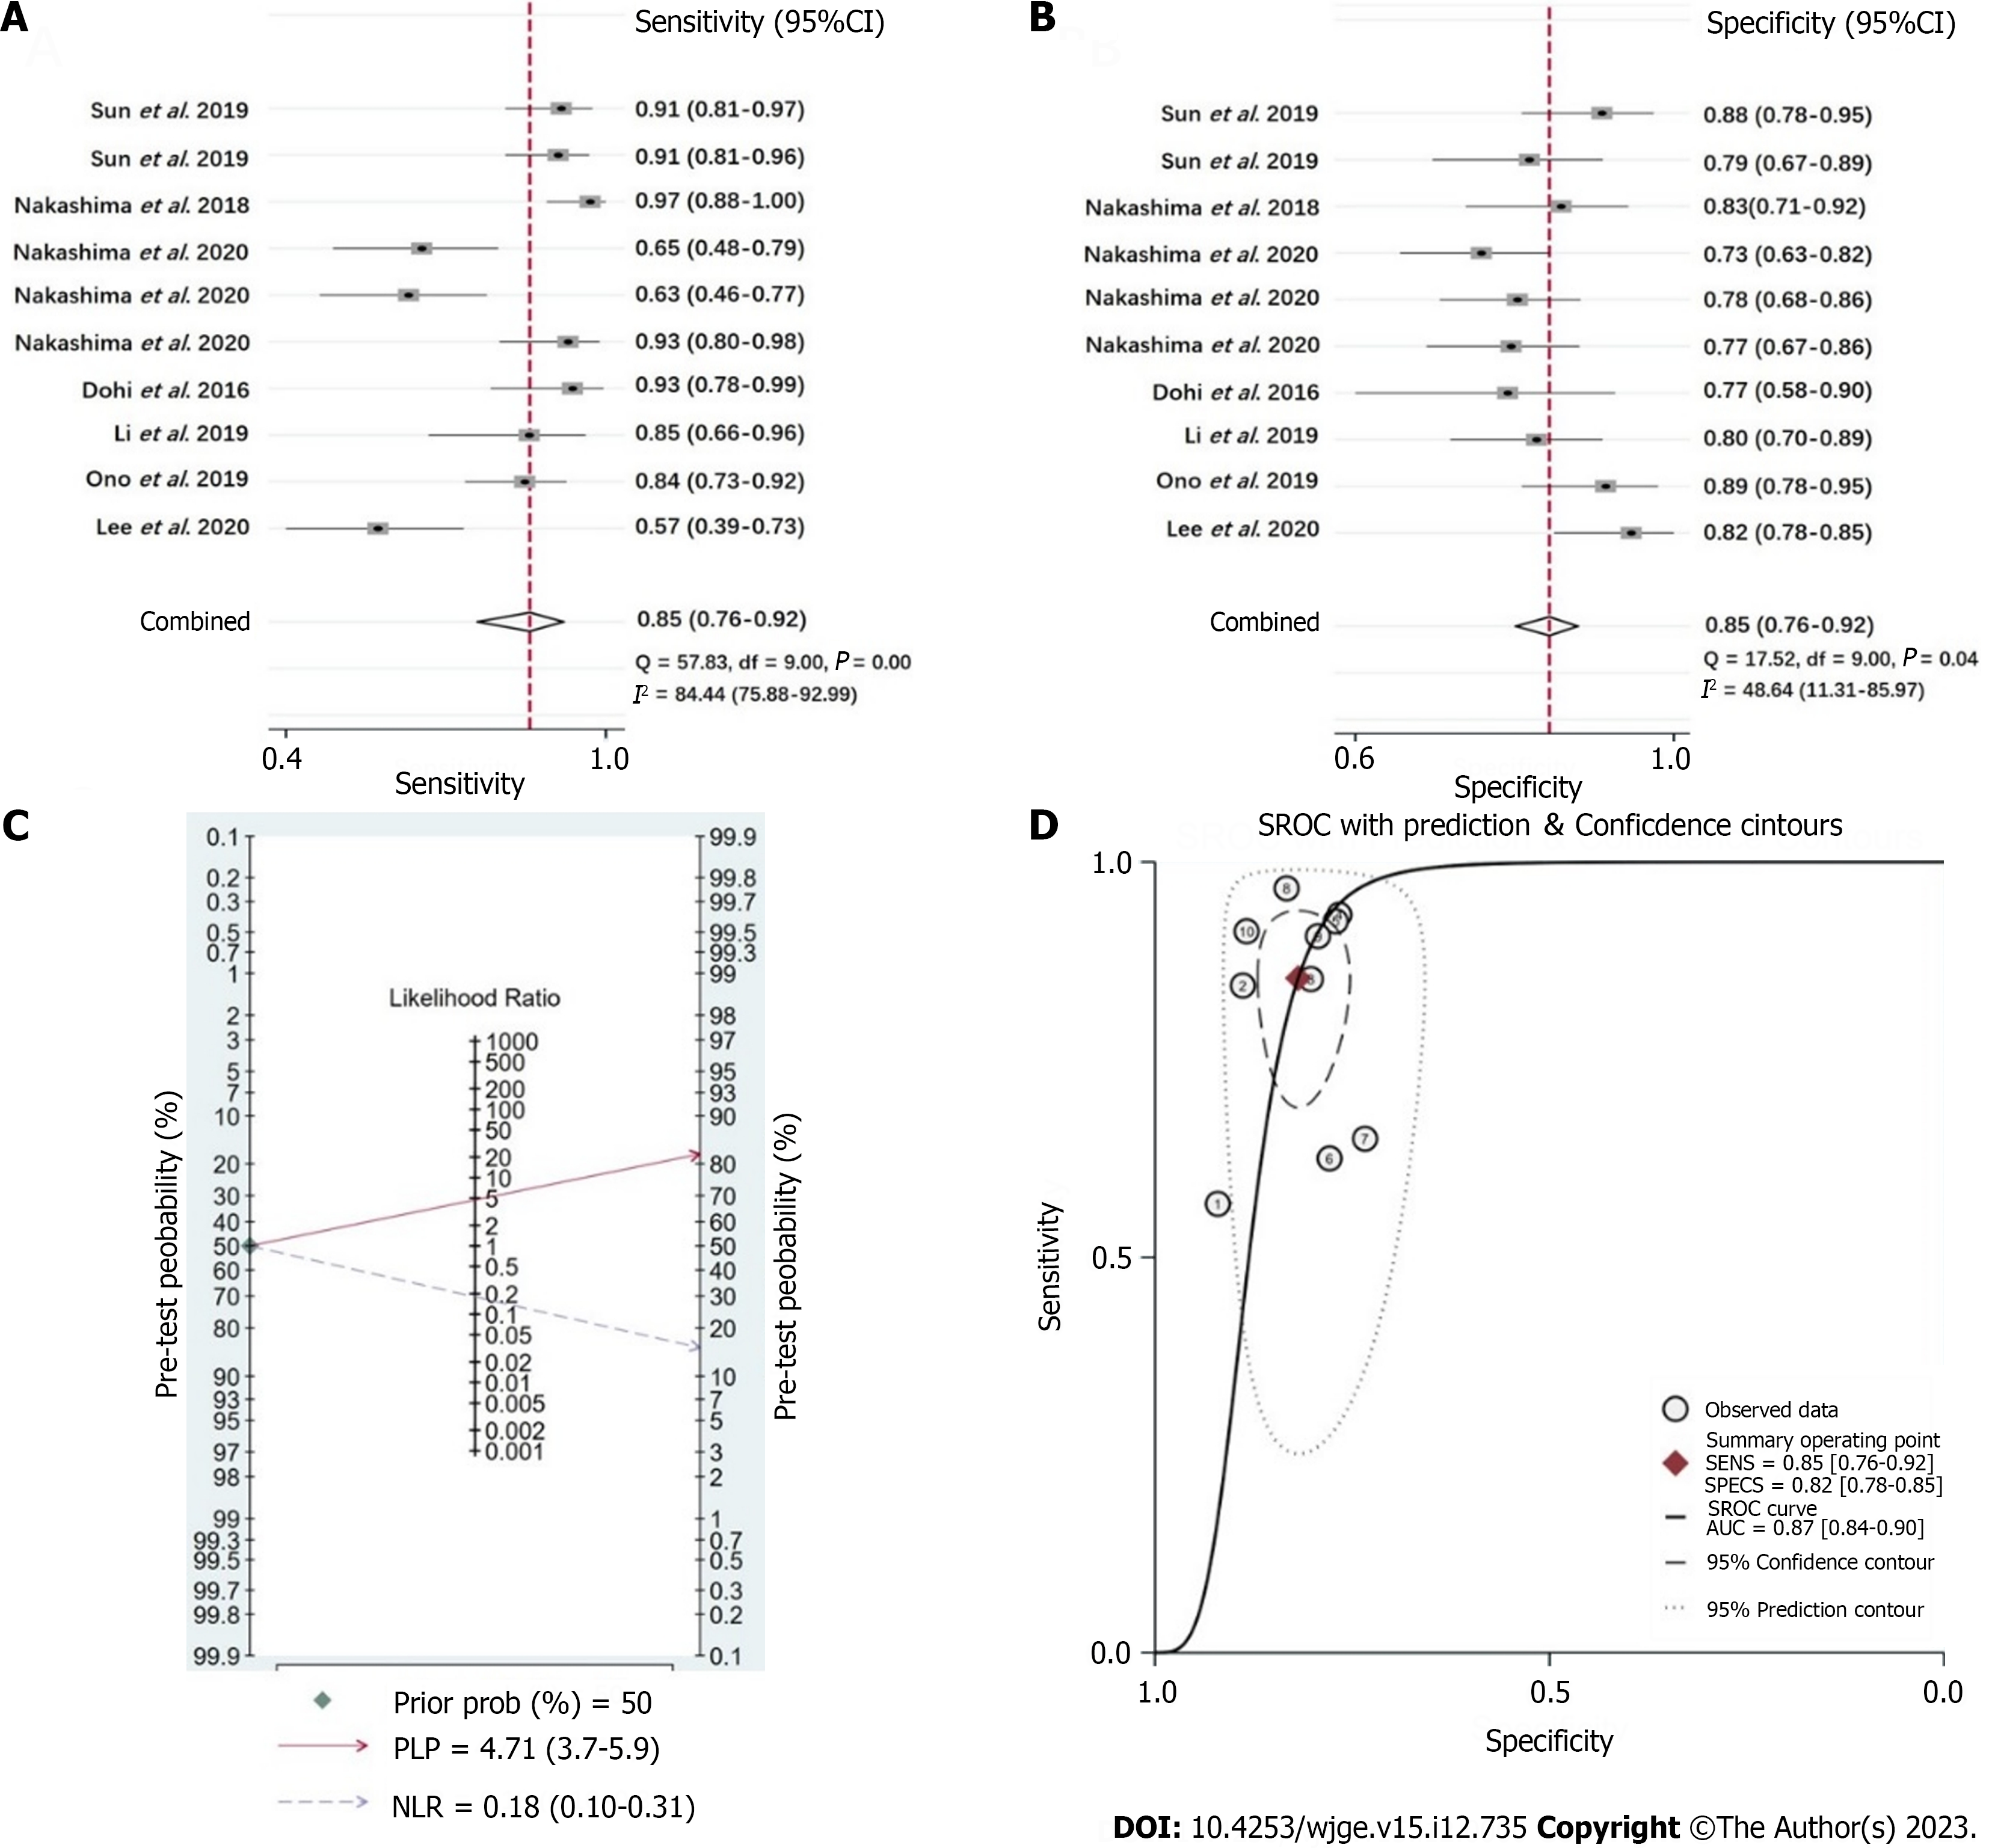
Figure 4 Pooled results of efficacy of linked color imaging on Helicobacter pylori infection diagnosis.
A-D: Pooled sensitivity (A), specificity (B), positive likelihood ratio and negative likelihood ratio (C). Symmetric receiver operator characteristic curve and area under the curve (D). 95%CI: 95% confidence interval; SROC: Symmetric receiver operator characteristic; PLR: Positive likelihood rate; NLR: Negative likelihood rate.
- Citation: Zhang Y, Wang JZ, Bai X, Zhang PL, Guo Q. Clinical usefulness of linked color imaging in identifying Helicobacter pylori infection: A systematic review and meta-analysis. World J Gastrointest Endosc 2023; 15(12): 735-744
- URL: https://www.wjgnet.com/1948-5190/full/v15/i12/735.htm
- DOI: https://dx.doi.org/10.4253/wjge.v15.i12.735


