Published online Jan 27, 2023. doi: 10.4254/wjh.v15.i1.116
Peer-review started: October 17, 2022
First decision: November 15, 2022
Revised: October 29, 2022
Accepted: December 23, 2022
Article in press: December 23, 2022
Published online: January 27, 2023
Processing time: 90 Days and 18.2 Hours
We have found that the expression of ring finger and WD repeat domain 3 (RF
Core Tip: We have discovered that ring finger and WD repeat domain 3 (RFWD3) expression is remarkably higher in tumor tissues compared to corresponding non-tumor tissues, regardless of hepatocellular carcinoma (HCC) tissue type (unpaired or paired). The RFWD3 expression also showed a significant correlation with the infiltration level of 14 immune cell types and was identified as an independent prognostic element in HCC by univariate Cox regression analysis. Our collective findings suggest that RFWD3 has the ability to accurately predict prognosis of HCC.
- Citation: Miao YD, Quan WX, Wang JT, Gan J, Dong X, Zhang F. Prognostic role of ring finger and WD repeat domain 3 and immune cell infiltration in hepatocellular carcinoma. World J Hepatol 2023; 15(1): 116-122
- URL: https://www.wjgnet.com/1948-5182/full/v15/i1/116.htm
- DOI: https://dx.doi.org/10.4254/wjh.v15.i1.116
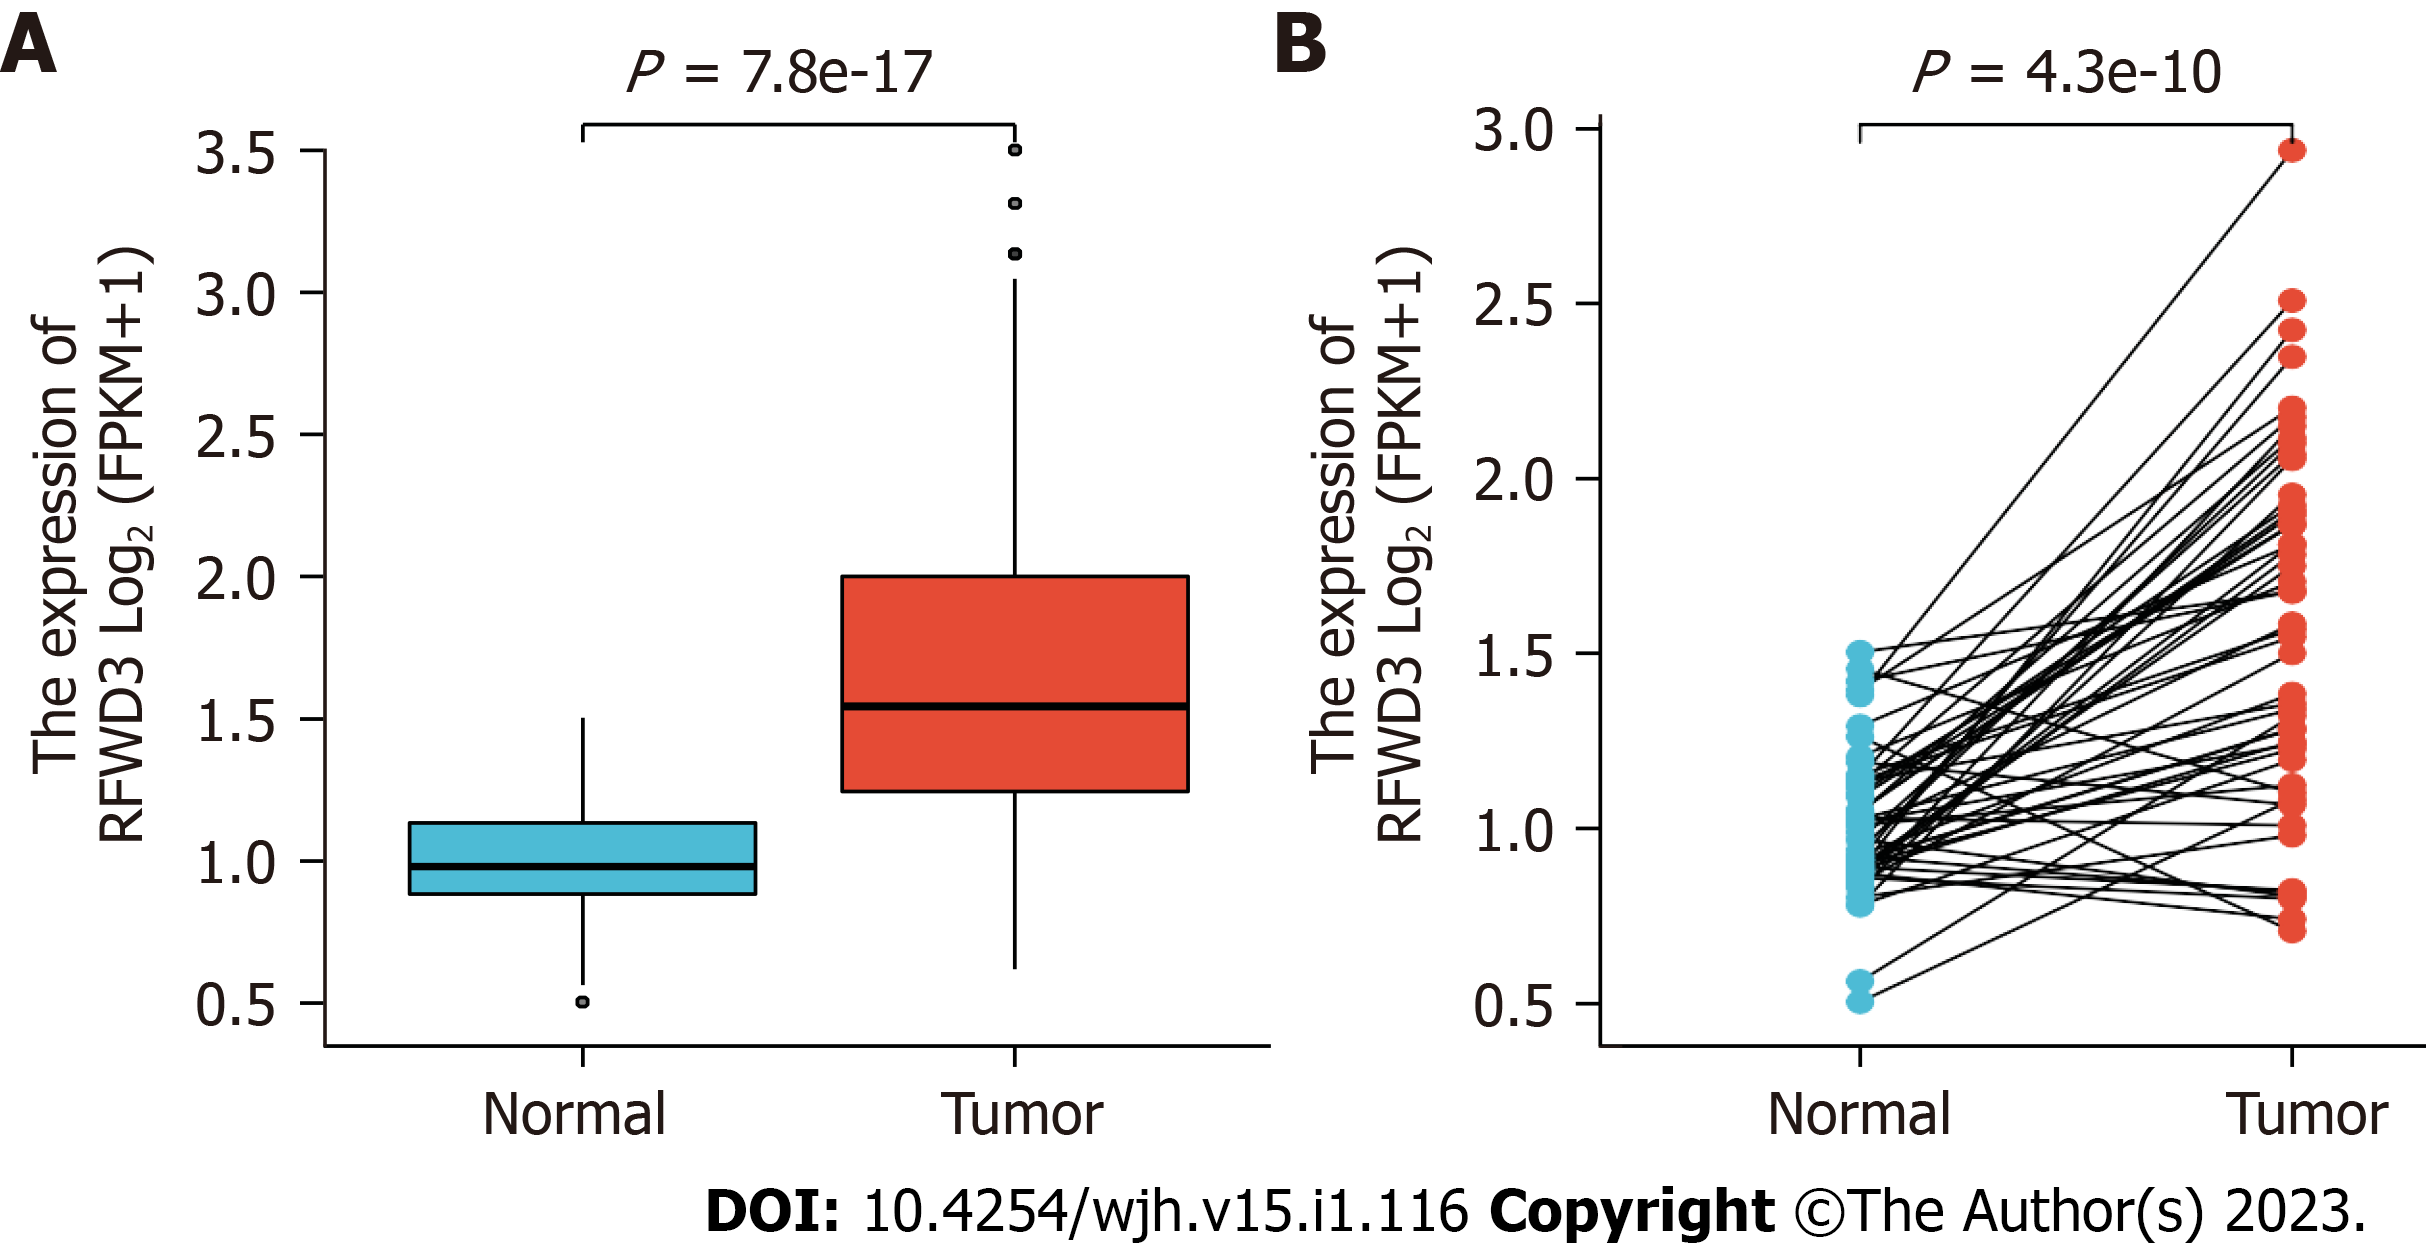
We perused the recently published paper by Liang et al[1] with much interest. The authors reported on their assessments of ring finger and WD repeat domain 3 (RFWD3) expression levels in hepatocellular carcinoma (HCC) patients. Their findings included RFWD3 effects on HCC prognosis, the processes of proliferation, invasion and metastasis, and the underlying mechanisms, specifically regulation via the Wnt/β-catenin signaling pathway. We have a particular appreciation for these authors' novel investigation into the prognostic implication of RFWD3 in HCC as we have also discovered that the expression of RFWD3 is prominently higher in both unpaired and paired HCC tissues from HCC patients than in their corresponding normal tissues (Figure 1A and B).
According to the current literature, cancer cells, endothelial cells, stromal cells, immune cells, and cancer-associated fibroblasts cells all exist in the tumor microenvironment (TME)[3,4]. While the TME is known to play crucial roles in development, invasion and metastasis of HCC, the immune escape of HCC cells has yet to be fully understood and continues to complicate cancer treatment[5]. Due to the ongoing and well-known limitations of chemotherapy in general, immunotherapies are a hot topic of bench and clinical research. This newly emerging cancer therapy exploits immune cells both inside and outside the TME to target and attack cancer cells; its demonstrated advantages are high specificity and low side-effects[6]. The power of this therapeutic method’s potential lies in the fact that different types of immune-related cells serve diverse roles; for HCC, the research into defining and developing those immune cells that inhibit/promote tumor processes has a long way to go[7].
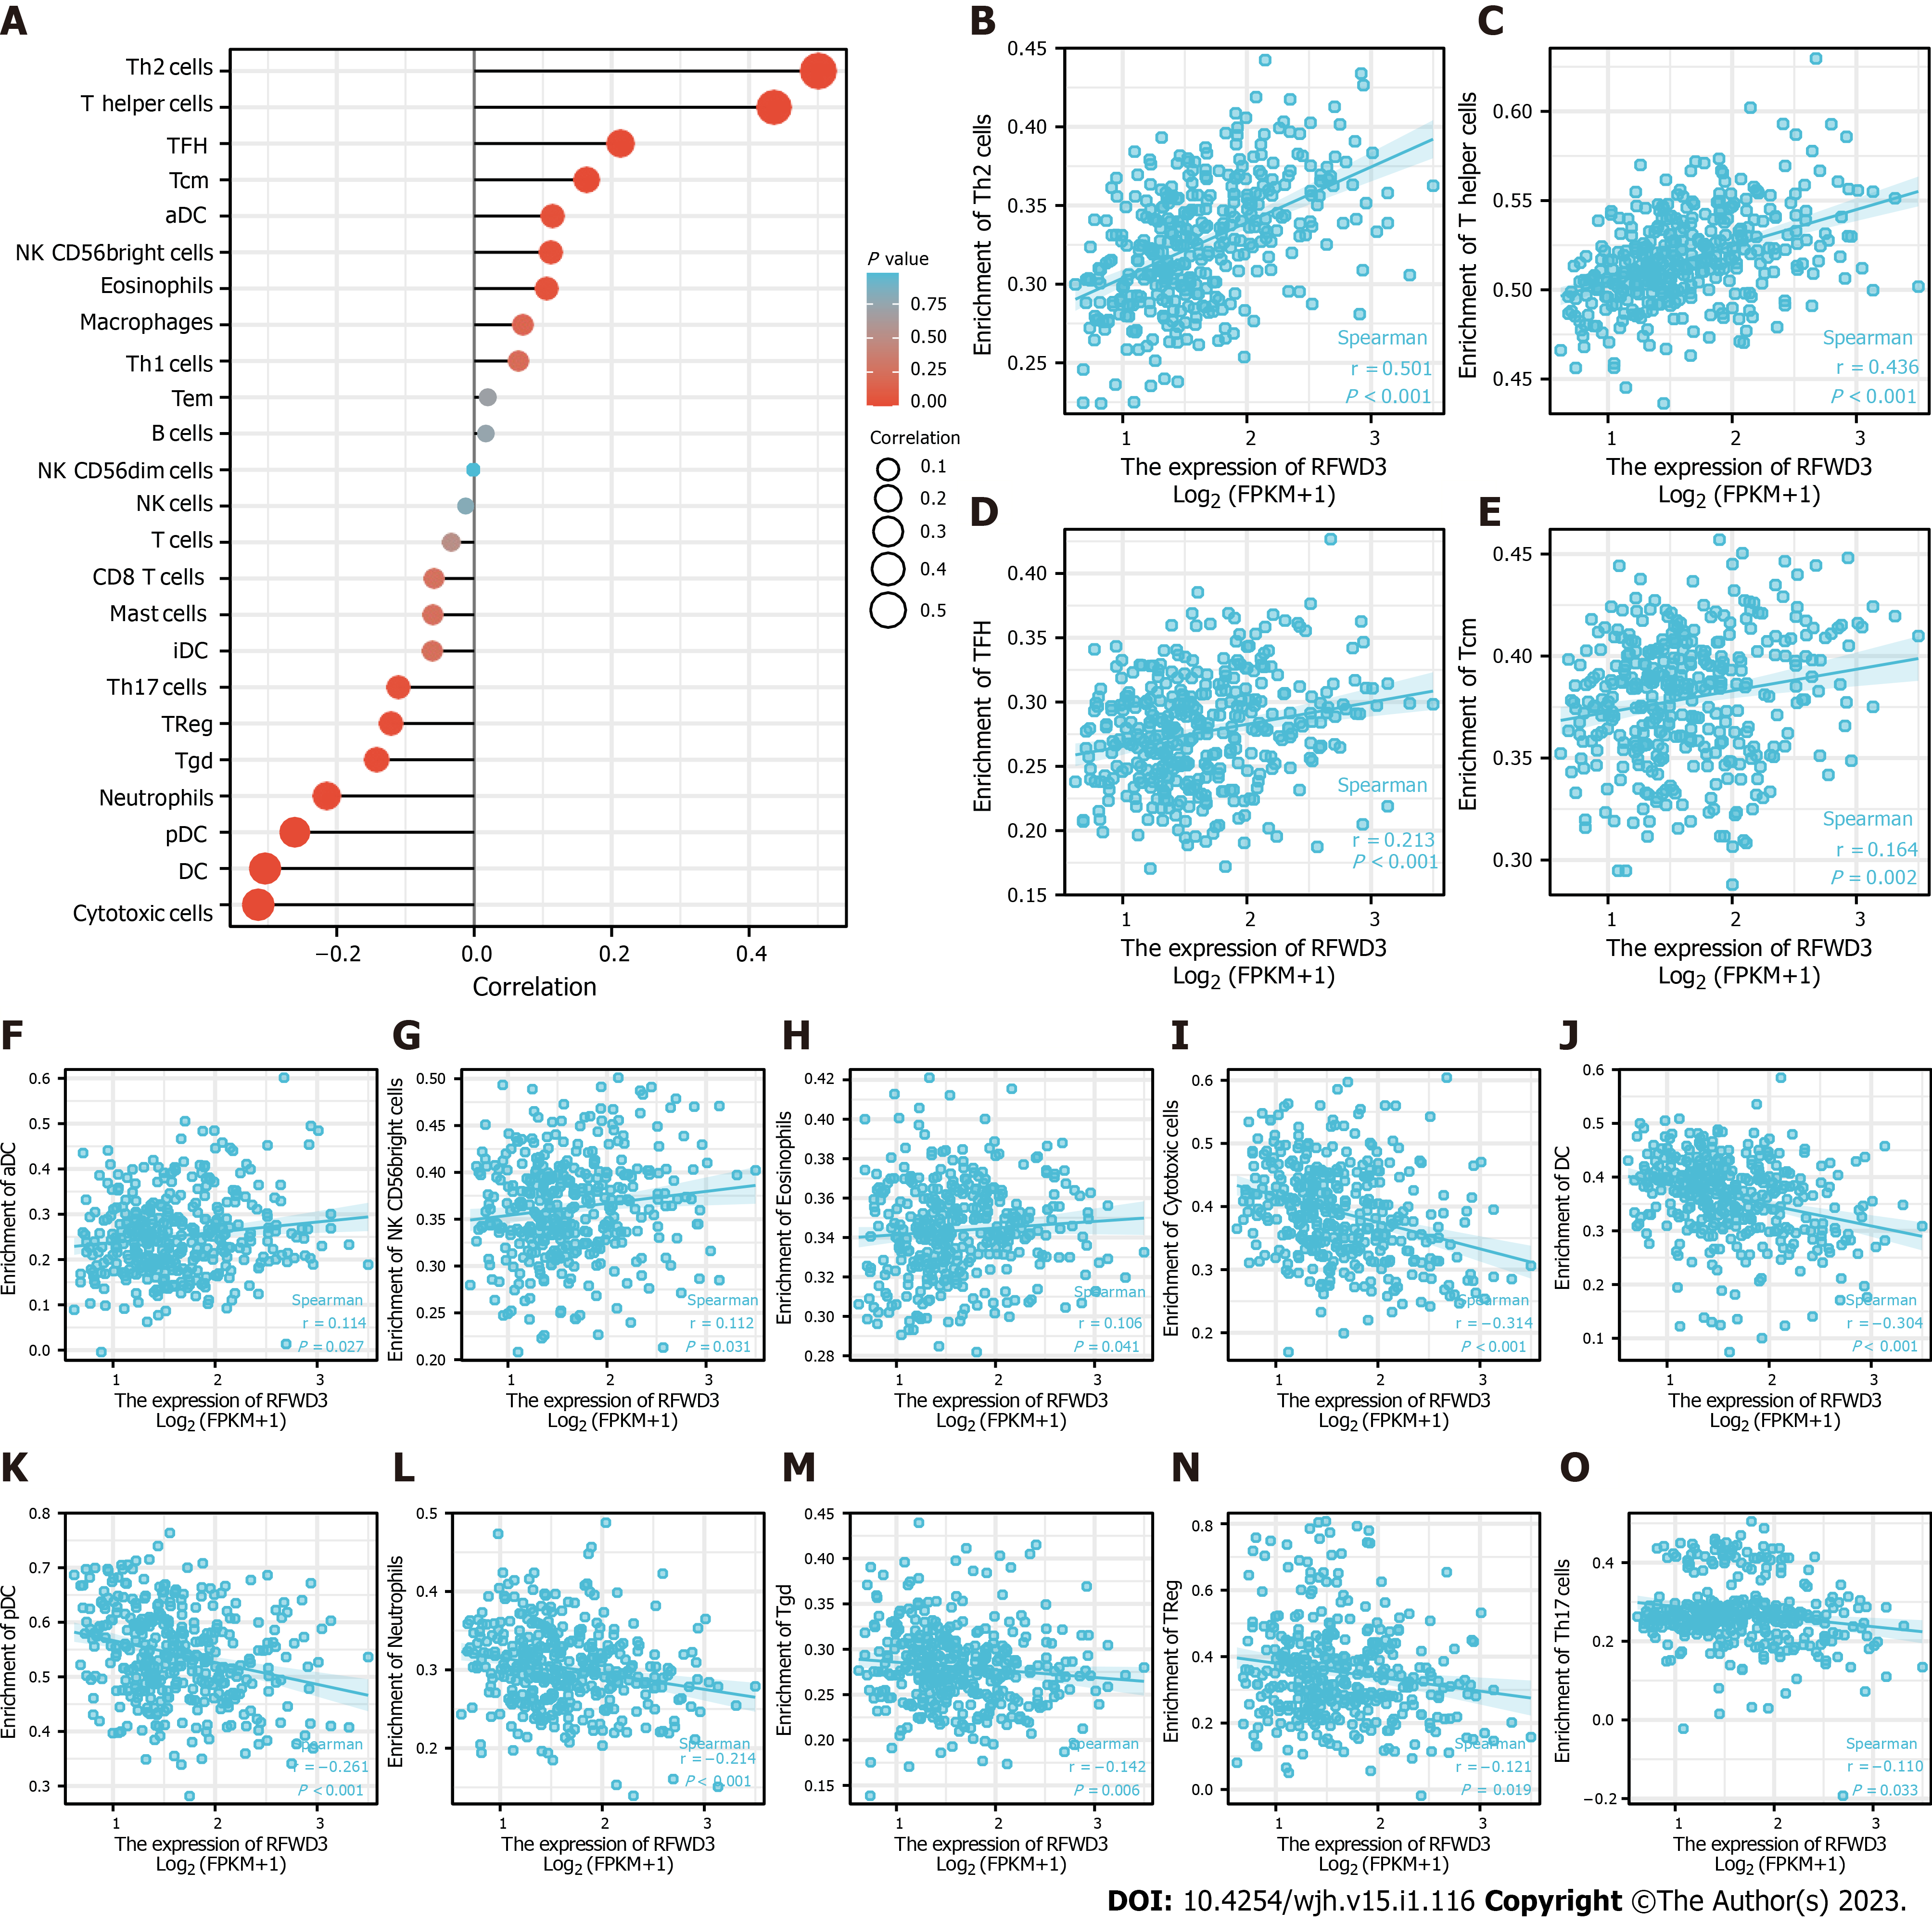
Upon reading the report that Liang et al[1] found RFWD3 is able to affect the prognosis of HCC, we tested a hypothesis that the expression of RFWD3 may be associated with immune cell infiltration in HCC. Detailed information is shown in Table 1. Following our initial positive data, we systematically explored the correlation between RFWD3 expression and infiltration level of 24 immune cell types, using a single-sample gene set analysis (also known as ssGSEA) algorithm and Spearman coefficient correlation analysis[8]. We found that RFWD3 expression has a remarkable correlation with the infiltration level of 14 immune cell types (Figure 2A). Among them, RFWD3 expression was positively associated with the infiltration level of T helper (Th) cells in general, Th2 cells in particular, T follicular helper (TFH) cells, T central memory (Tcm) cells, activated dendritic cells (DCs), natural killer (NK) CD56bright cells, and eosinophils ( all P < 0.05; Figure 2B-H). There were negative associations with cytotoxic cells, DCs, plasmacytoid DCs (pDCs), neutrophils, T gamma delta (Tgd) cells, T regulatory cells (Tregs), and Th17 cells (all P < 0.05; Figure 2I-O). We hope our findings will encourage further investigations into RFWD3 as an HCC immunotherapy. Detailed information on this aspect is presented in Table 2.
| Gene | Group | n | Minimum | Maximum | Median | IQR | Lower quartile | Upper quartile | Mean | SD | SE |
| RFWD3 | Normal | 50 | 0.504 | 1.504 | 0.98 | 0.251 | 0.883 | 1.133 | 1.013 | 0.208 | 0.029 |
| Tumor | 374 | 0.62 | 3.5 | 1.544 | 0.755 | 1.245 | 2 | 1.647 | 0.559 | 0.029 | |
| Normal | 50 | 0.504 | 1.504 | 0.98 | 0.251 | 0.883 | 1.133 | 1.013 | 0.208 | 0.029 | |
| Tumor | 50 | 0.707 | 2.939 | 1.577 | 0.716 | 1.204 | 1.92 | 1.578 | 0.521 | 0.074 |
| Gene | Immune cell type | Pearson’s correlation coefficient | Pearson’s P value | Spearman’s correlation coefficient | Spearman’s P value |
| RFWD3 | Th2 cells | 0.499 | < 0.001 | 0.501 | < 0.001 |
| Th cells | 0.434 | < 0.001 | 0.436 | < 0.001 | |
| Cytotoxic cells | -0.304 | < 0.001 | -0.314 | < 0.001 | |
| DCs | -0.281 | < 0.001 | -0.304 | < 0.001 | |
| pDCs | -0.261 | < 0.001 | -0.261 | < 0.001 | |
| Neutrophils | -0.210 | < 0.001 | -0.214 | < 0.001 | |
| TFH cells | 0.226 | < 0.001 | 0.213 | < 0.001 | |
| Tcm cells | 0.187 | < 0.001 | 0.164 | 0.002 | |
| Tgd cells | -0.105 | 0.043 | -0.142 | 0.006 | |
| Tregs | -0.155 | 0.003 | -0.121 | 0.019 | |
| aDCs | 0.141 | 0.006 | 0.114 | 0.027 | |
| NK CD56bright cells | 0.128 | 0.013 | 0.112 | 0.031 | |
| Th17 cells | -0.170 | < 0.001 | -0.110 | 0.033 | |
| Eosinophils | 0.077 | 0.135 | 0.106 | 0.041 | |
| Macrophages | 0.096 | 0.063 | 0.071 | 0.171 | |
| Th1 cells | 0.090 | 0.081 | 0.064 | 0.214 | |
| iDCs | -0.034 | 0.507 | -0.061 | 0.241 | |
| Mast cells | -0.053 | 0.309 | -0.060 | 0.247 | |
| CD8 T cells | -0.047 | 0.368 | -0.058 | 0.260 | |
| T cells | -0.013 | 0.796 | -0.033 | 0.522 | |
| Tem cells | 0.085 | 0.100 | 0.020 | 0.704 | |
| B cells | 0.033 | 0.525 | 0.017 | 0.744 | |
| NK cells | 0.035 | 0.494 | -0.012 | 0.810 | |
| NK CD56dim cells | 0.020 | 0.699 | -0.001 | 0.979 |
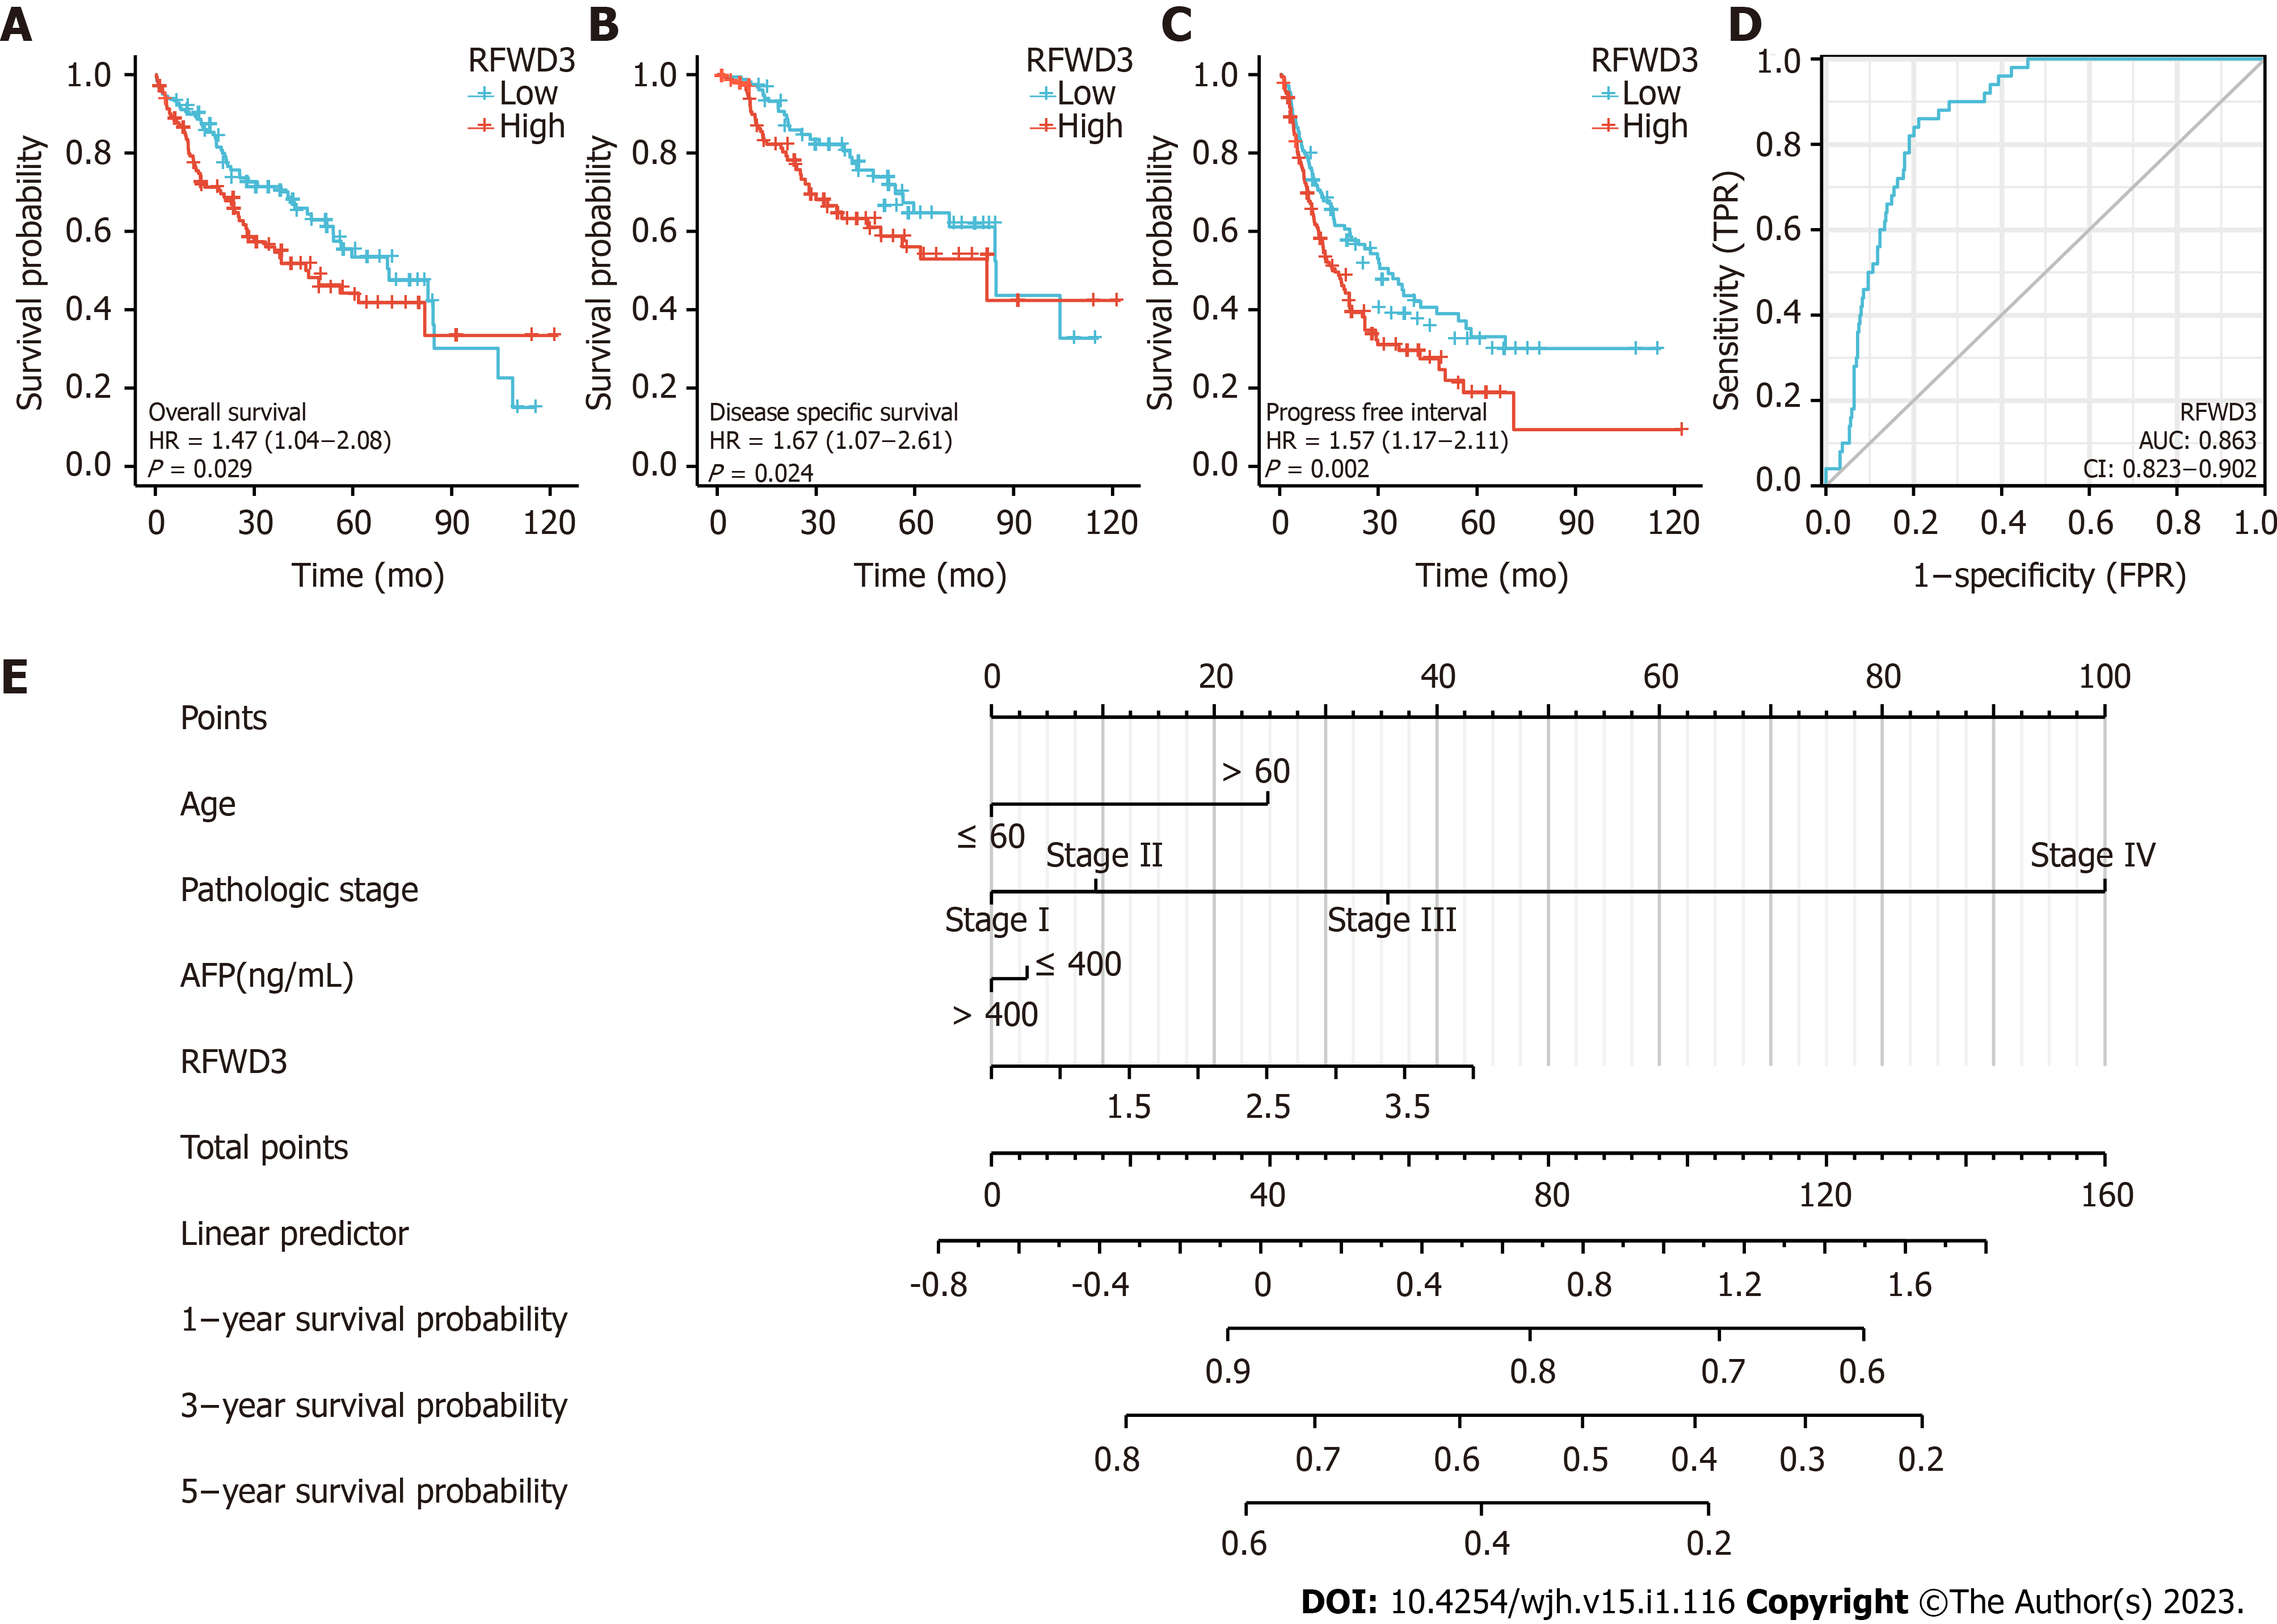
Importantly, we agree with the finding of Liang et al[1] that indicates higher RFWD3 expression is related to worse overall survival (OS) in HCC. We have found that OS, disease-free survival, and progression-free interval were prominently shorter in HCC patient tissues with high RFWD3 expression than in those with low RFWD3 expression (all P < 0.05; Figure 3A-C). Our further statistical analysis via univariate Cox regression identified RFWD3 as an independent prognostic element for HCC (Table 3). Generation of the receiver operating characteristic curve showed that RFWD3 has the ability to accurately predict prognosis in HCC (area under the curve of 0.863). Finally, we generated prognostic nomograms for probabilities of 1-, 3- and 5-year OS in HCC via integrating the factors of age, pathologic stage, alpha-fetoprotein level, and RFWD3 expression; each element was assigned a score according to its contribution to survival (Figure 3E).
| Characteristics | Total, n | Univariate analysis | |
| Hazard ratio (95%CI) | P value | ||
| Pathologic stage | 349 | ||
| I | 173 | ||
| II | 86 | 1.417 (0.868-2.312) | 0.164 |
| III | 85 | 2.734 (1.792-4.172) | < 0.001 |
| IV | 5 | 5.597 (1.726-18.148) | 0.004 |
| Child-Pugh grade | 240 | ||
| A | 218 | ||
| B | 21 | 1.595 (0.757-3.361) | 0.219 |
| C | 1 | 2.138 (0.294-15.544) | 0.453 |
| Fibrosis Ishak score | 214 | ||
| 0 | 75 | ||
| 1/2 | 31 | 0.935 (0.437-2.002) | 0.864 |
| 3/4 | 28 | 0.698 (0.288-1.695) | 0.428 |
| 5/6 | 80 | 0.737 (0.410-1.325) | 0.308 |
| Histologic grade | 368 | ||
| G1 | 55 | ||
| G2 | 178 | 1.162 (0.686-1.969) | 0.576 |
| G3 | 123 | 1.185 (0.683-2.057) | 0.545 |
| G4 | 12 | 1.681 (0.621-4.549) | 0.307 |
| RFWD3 | 373 | 1.557 (1.148-2.110) | 0.004 |
Ultimately, our new findings highlight that the research of Liang et al[1] is worthy of attention and that subsequent efforts to build upon it, such as our related discoveries, may promote the next generation of effective and safe therapeutics, such as immunotherapies.
R statistical software (version 4.1.2; R Foundation for Statistical Computing, Vienna, Austria; https://www.R-project.org/) was used for all statistical analyses. Wilcoxon rank-sum test was used to perform the differential expression analysis of RFWD3 between HCC samples and corresponding normal samples, with results demonstrated by the “ggplot2” R package[10]. Survival analysis was carried out by log-rank test and univariate Cox regression. The association between RFWD3 expression and immune cell infiltration were performed by Spearman and Pearson analysis. Positive values of correlation coefficient indicate positive correlation, negative values indicate negative correlation.
Provenance and peer review: Unsolicited article; Externally peer reviewed.
Peer-review model: Single blind
Specialty type: Oncology
Country/Territory of origin: China
Peer-review report’s scientific quality classification
Grade A (Excellent): A
Grade B (Very good): 0
Grade C (Good): 0
Grade D (Fair): D
Grade E (Poor): 0
P-Reviewer: Ding Y, China; Papadopoulos N, Greece S-Editor: Xing YX L-Editor: Filipodia P-Editor: Xing YX
| 1. | Liang RP, Zhang XX, Zhao J, Lu QW, Zhu RT, Wang WJ, Li J, Bo K, Zhang CX, Sun YL. RING finger and WD repeat domain 3 regulates proliferation and metastasis through the Wnt/β-catenin signalling pathways in hepatocellular carcinoma. World J Gastroenterol. 2022;28:3435-3454. [RCA] [PubMed] [DOI] [Full Text] [Full Text (PDF)] [Cited by in CrossRef: 2] [Cited by in RCA: 5] [Article Influence: 1.3] [Reference Citation Analysis (0)] |
| 2. | Vivian J, Rao AA, Nothaft FA, Ketchum C, Armstrong J, Novak A, Pfeil J, Narkizian J, Deran AD, Musselman-Brown A, Schmidt H, Amstutz P, Craft B, Goldman M, Rosenbloom K, Cline M, O'Connor B, Hanna M, Birger C, Kent WJ, Patterson DA, Joseph AD, Zhu J, Zaranek S, Getz G, Haussler D, Paten B. Toil enables reproducible, open source, big biomedical data analyses. Nat Biotechnol. 2017;35:314-316. [RCA] [PubMed] [DOI] [Full Text] [Cited by in Crossref: 819] [Cited by in RCA: 938] [Article Influence: 104.2] [Reference Citation Analysis (1)] |
| 3. | Hanahan D. Hallmarks of Cancer: New Dimensions. Cancer Discov. 2022;12:31-46. [RCA] [PubMed] [DOI] [Full Text] [Cited by in Crossref: 664] [Cited by in RCA: 5905] [Article Influence: 1476.3] [Reference Citation Analysis (2)] |
| 4. | Hanahan D, Weinberg RA. Hallmarks of cancer: the next generation. Cell. 2011;144:646-674. [RCA] [PubMed] [DOI] [Full Text] [Cited by in Crossref: 51728] [Cited by in RCA: 48611] [Article Influence: 3240.7] [Reference Citation Analysis (11)] |
| 5. | Wu Q, Zhou L, Lv D, Zhu X, Tang H. Exosome-mediated communication in the tumor microenvironment contributes to hepatocellular carcinoma development and progression. J Hematol Oncol. 2019;12:53. [RCA] [PubMed] [DOI] [Full Text] [Full Text (PDF)] [Cited by in Crossref: 113] [Cited by in RCA: 218] [Article Influence: 31.1] [Reference Citation Analysis (0)] |
| 6. | Yost KE, Satpathy AT, Wells DK, Qi Y, Wang C, Kageyama R, McNamara KL, Granja JM, Sarin KY, Brown RA, Gupta RK, Curtis C, Bucktrout SL, Davis MM, Chang ALS, Chang HY. Clonal replacement of tumor-specific T cells following PD-1 blockade. Nat Med. 2019;25:1251-1259. [RCA] [PubMed] [DOI] [Full Text] [Full Text (PDF)] [Cited by in Crossref: 1020] [Cited by in RCA: 1136] [Article Influence: 162.3] [Reference Citation Analysis (0)] |
| 7. | Hao X, Sun G, Zhang Y, Kong X, Rong D, Song J, Tang W, Wang X. Targeting Immune Cells in the Tumor Microenvironment of HCC: New Opportunities and Challenges. Front Cell Dev Biol. 2021;9:775462. [RCA] [PubMed] [DOI] [Full Text] [Full Text (PDF)] [Cited by in Crossref: 13] [Cited by in RCA: 115] [Article Influence: 23.0] [Reference Citation Analysis (0)] |
| 8. | Hänzelmann S, Castelo R, Guinney J. GSVA: gene set variation analysis for microarray and RNA-seq data. BMC Bioinformatics. 2013;14:7. [RCA] [PubMed] [DOI] [Full Text] [Full Text (PDF)] [Cited by in Crossref: 7222] [Cited by in RCA: 10357] [Article Influence: 796.7] [Reference Citation Analysis (3)] |
| 9. | Miao Y, Wang J, Li Q, Quan W, Wang Y, Li C, Wu J, Mi D. Prognostic value and immunological role of PDCD1 gene in pan-cancer. Int Immunopharmacol. 2020;89:107080. [RCA] [PubMed] [DOI] [Full Text] [Cited by in Crossref: 63] [Cited by in RCA: 63] [Article Influence: 10.5] [Reference Citation Analysis (0)] |
| 10. | Walter W, Sánchez-Cabo F, Ricote M. GOplot: an R package for visually combining expression data with functional analysis. Bioinformatics. 2015;31:2912-2914. [RCA] [PubMed] [DOI] [Full Text] [Cited by in Crossref: 792] [Cited by in RCA: 1233] [Article Influence: 112.1] [Reference Citation Analysis (0)] |


