Copyright
©The Author(s) 2017.
World J Hepatol. Dec 28, 2017; 9(36): 1315-1321
Published online Dec 28, 2017. doi: 10.4254/wjh.v9.i36.1315
Published online Dec 28, 2017. doi: 10.4254/wjh.v9.i36.1315
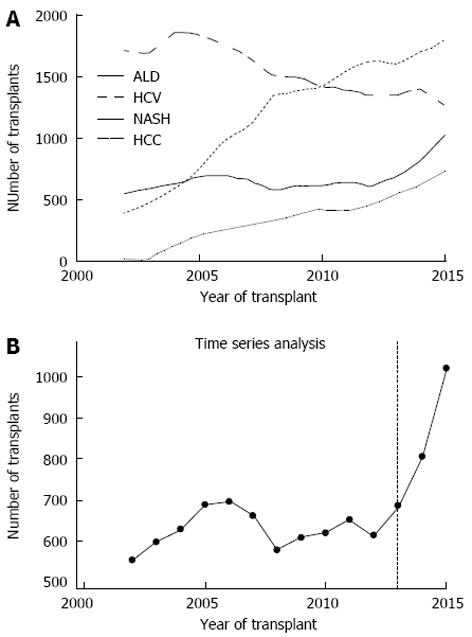
Figure 1 Time series analysis demonstrated a significant increase in the number of transplants for alcoholic liver disease starting in 2013.
A: Number of transplants per year by etiology of liver disease; B: Time series analysis of alcoholic liver disease liver transplant recipients demonstrating a significant change in the number of transplants starting in 2013 (P = 0.03). ALD: Alcoholic liver disease; HCV: Hepatitis C virus; NASH: Non-alcoholic steatohepatitis; HCC: Hepatocellular carcinoma.
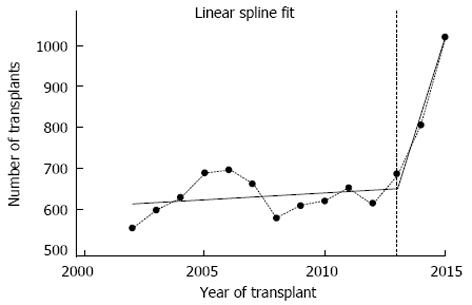
Figure 2 Linear spline fit for number of transplants for year for alcoholic liver disease in the before and after eras.
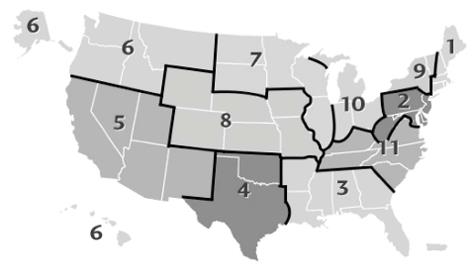
Figure 3 UNOS regions in the United States[29].
- Citation: Kling CE, Perkins JD, Carithers RL, Donovan DM, Sibulesky L. Recent trends in liver transplantation for alcoholic liver disease in the United States. World J Hepatol 2017; 9(36): 1315-1321
- URL: https://www.wjgnet.com/1948-5182/full/v9/i36/1315.htm
- DOI: https://dx.doi.org/10.4254/wjh.v9.i36.1315


