Copyright
©The Author(s) 2017.
World J Hepatol. Jul 18, 2017; 9(20): 896-904
Published online Jul 18, 2017. doi: 10.4254/wjh.v9.i20.896
Published online Jul 18, 2017. doi: 10.4254/wjh.v9.i20.896
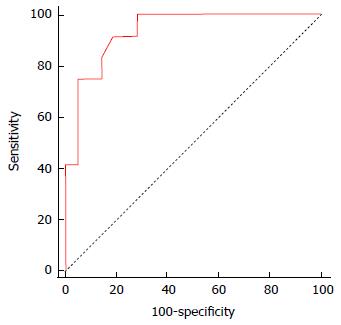
Figure 1 Receiver-operating characteristic curve derived from the multivariate binary logistic regression model for prediction of the occurrence of repeated episodes of infection.
AUC = 0.935 (95%CI: 79.1%-99.1%; P < 0.0001); sensitivity: 91.7% (95%CI: 61.5%-99.8%); specificity: 81.0% (95%CI: 58.1%-94.6%); PPV: 73.3% (95%CI: 43.8%-92.7%); NPV: 94.4% (95%CI: 72.7%-99.9%). AUC: Area under ROC curve; PPV: Positive predictive value; NPV: Negative predictive value.
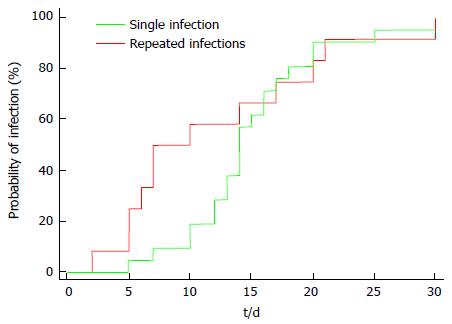
Figure 2 Kaplan-Meier curves for the time-to-infection in patients who suffered from single and repeated episodes of infection.
HR = 1.16 (95%CI: 56%-92.4%; P = 0.647).
- Citation: Montasser MF, Abdelkader NA, Abdelhakam SM, Dabbous H, Montasser IF, Massoud YM, Abdelmoaty W, Saleh SA, Bahaa M, Said H, El-Meteini M. Bacterial infections post-living-donor liver transplantation in Egyptian hepatitis C virus-cirrhotic patients: A single-center study. World J Hepatol 2017; 9(20): 896-904
- URL: https://www.wjgnet.com/1948-5182/full/v9/i20/896.htm
- DOI: https://dx.doi.org/10.4254/wjh.v9.i20.896


