Copyright
©The Author(s) 2017.
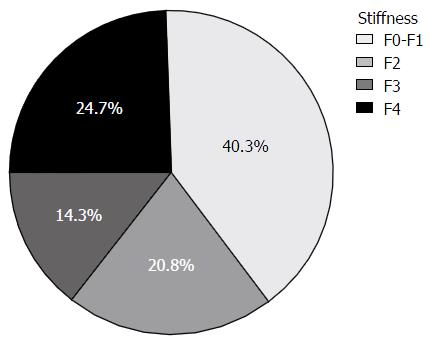
Figure 1 Distribution of liver stiffness levels according to Fibroscan.
Figure 2 Dose response relationship of the combined categories of body mass index of 40 and above (grade 3 obesity) and male gender with fibrosis level.
Women + BMI < 40; n = 14, men or BMI ≥ 40; n = 42, men + BMI ≥ 40; n = 21). BMI: Body mass index.
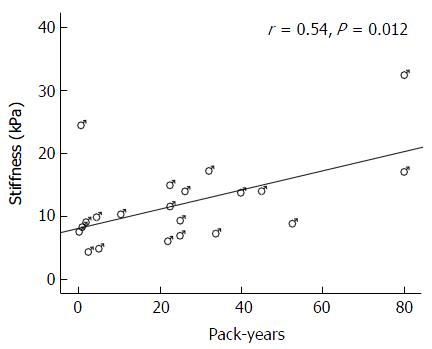
Figure 3 Correlation between pack-years and liver stiffness among ever smoking men (n = 21).
- Citation: Zelber-Sagi S, Shoham D, Zvibel I, Abu-Abeid S, Shibolet O, Fishman S. Predictors for advanced fibrosis in morbidly obese non-alcoholic fatty liver patients. World J Hepatol 2017; 9(2): 91-98
- URL: https://www.wjgnet.com/1948-5182/full/v9/i2/91.htm
- DOI: https://dx.doi.org/10.4254/wjh.v9.i2.91


