Copyright
©The Author(s) 2017.
World J Hepatol. Apr 18, 2017; 9(11): 562-566
Published online Apr 18, 2017. doi: 10.4254/wjh.v9.i11.562
Published online Apr 18, 2017. doi: 10.4254/wjh.v9.i11.562
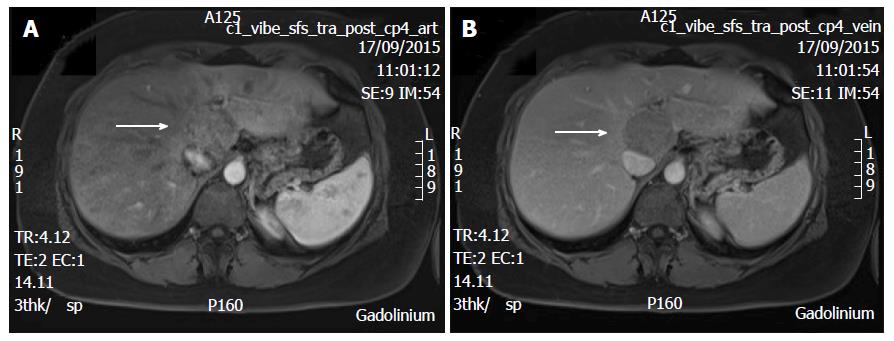
Figure 1 T1 weighted magnetic resonance imaging with gadolinium injection, showing a 50-mm tumor in segment 1 (arrow).
A: Arterial phase; B: Portal venous phase.
Figure 2 Positron emission tomography computed tomography using 18-fluoro-deoxyglucose showing the 18-fluoro-deoxyglucose avidity of the segment 1 tumor.
A: PET; B: CT; C: PET-CT fusion. PET: Positron emission tomography; 18FDG: 18-fluoro-deoxyglucose; CT: Computed tomography.
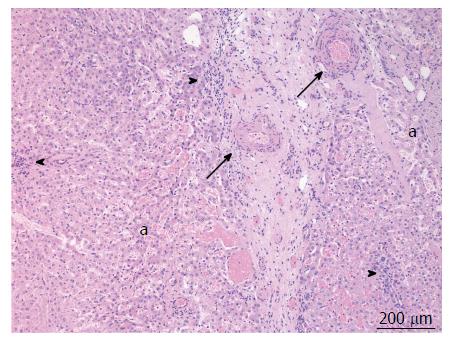
Figure 3 Pathology of the tumor that contains thickened arteries (arrows), inflammatory infiltrate (arrowheads), sinusoidal dilatation (a) (hematoxylin-eosin stain).
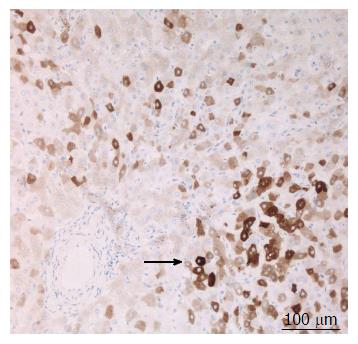
Figure 4 Immunohistochemistry with anti-C reactive protein antibodies, positive in the adenomatous hepatocytes (arrow), confirming inflammatory hepatocellular adenoma.
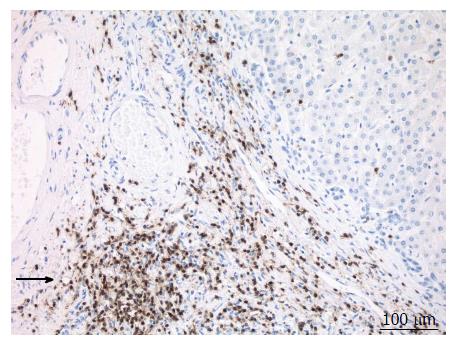
Figure 5 Immunohistochemistry with anti-CD3 antibodies, positive in the inflammatory cells (arrow).
- Citation: Liu W, Delwaide J, Bletard N, Delvenne P, Meunier P, Hustinx R, Detry O. 18-Fluoro-deoxyglucose uptake in inflammatory hepatic adenoma: A case report. World J Hepatol 2017; 9(11): 562-566
- URL: https://www.wjgnet.com/1948-5182/full/v9/i11/562.htm
- DOI: https://dx.doi.org/10.4254/wjh.v9.i11.562


