Copyright
©The Author(s) 2017.
World J Hepatol. Apr 8, 2017; 9(10): 510-518
Published online Apr 8, 2017. doi: 10.4254/wjh.v9.i10.510
Published online Apr 8, 2017. doi: 10.4254/wjh.v9.i10.510
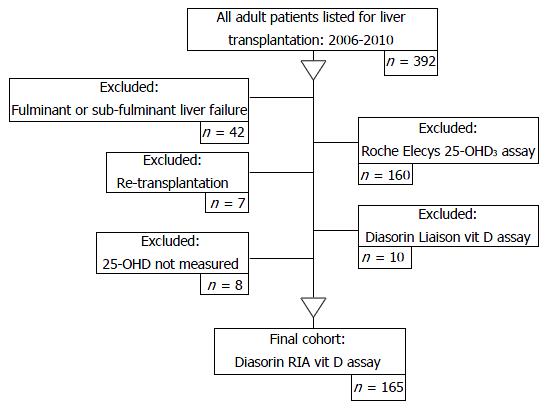
Figure 1 Study design.
The selection and application of inclusion/exclusion criteria for inclusion in the final analysis. 25-OHD: 25-hydroxyvitamin D; RIA: Radioimmunoassay.
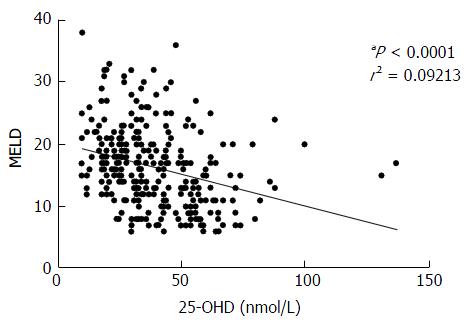
Figure 2 Vitamin D and severity of liver disease.
25-OHD levels fall with worsening liver disease. 25-OHD: 25-hydroxyvitamin D; MELD: Model for end stage liver disease.
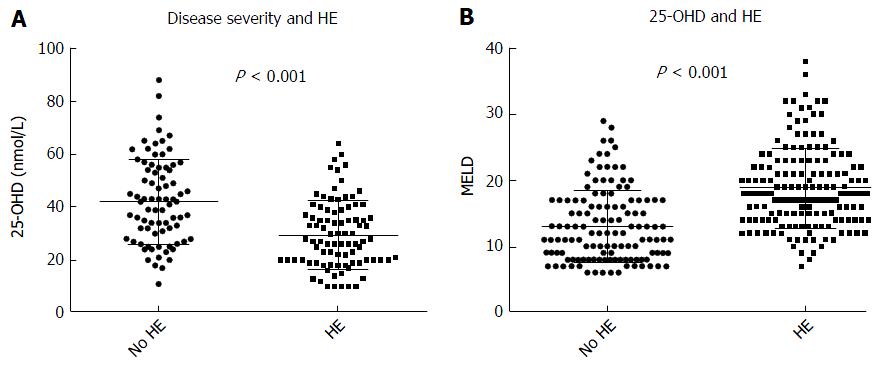
Figure 3 Disease severity, overt hepatic encephalopathy and vitamin D levels.
A: Patients with overt HE have significantly higher MELD than patients without overt HE; B: 25-OHD levels measured by Diasorin-RIA and HE. Patients with overt HE have significantly lower 25-OHD levels than those without overt HE. 25-OHD: 25-hydroxyvitamin D; HE: Hepatic encephalopathy; MELD: Model for end stage liver disease.
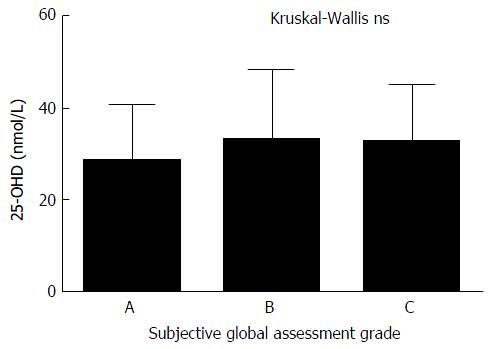
Figure 4 25-hydroxyvitamin D and nutritional status.
25-OHD levels are independent of nutritional status. 25-OHD: 25-hydroxyvitamin D; ns: Not significant.
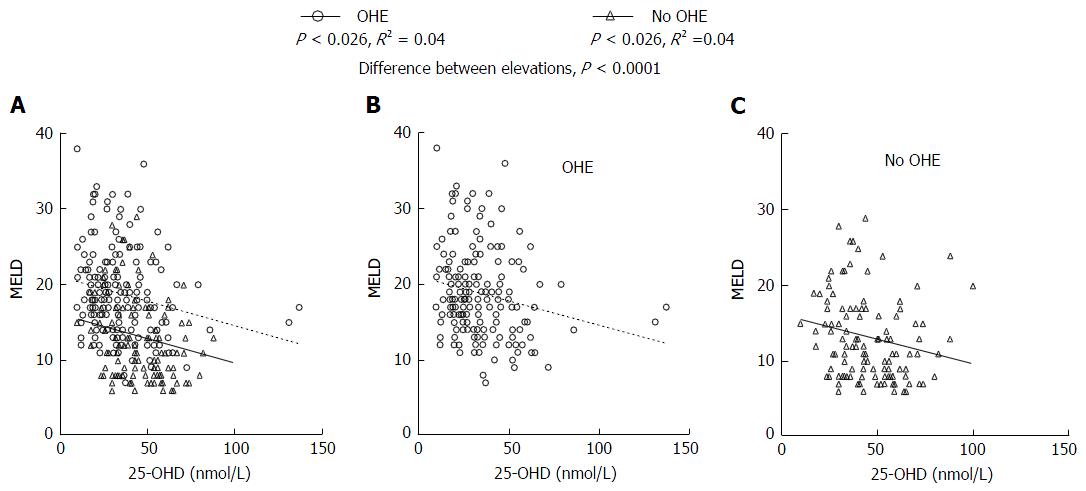
Figure 5 Overt hepatic encephalopathy, disease severity and 25-hydroxyvitamin D.
Patients were stratified into those who had overt HE and those who did not. The combined data is presented in (A) and the sub groups of patients with OHE (B) and those without OHE (C). Vitamin D deficiency correlates with MELD score in both patients with and without OHE. Across the range of MELD scores from 10-30 patients with OHE (B) had significantly lower levels of 25-OHD than those who did not (C). 25-OHD: 25-hydroxyvitamin D; OHE: Overt hepatic encephalopathy; MELD: Model for end stage liver disease.
- Citation: Vidot H, Potter A, Cheng R, Allman-Farinelli M, Shackel N. Serum 25-hydroxyvitamin D deficiency and hepatic encephalopathy in chronic liver disease. World J Hepatol 2017; 9(10): 510-518
- URL: https://www.wjgnet.com/1948-5182/full/v9/i10/510.htm
- DOI: https://dx.doi.org/10.4254/wjh.v9.i10.510


