Copyright
©The Author(s) 2017.
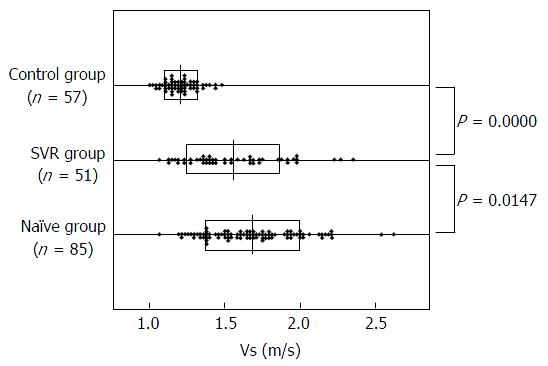
Figure 1 Velocity based on shear wave elastography is shown for each group.
Vs is 1.23 ± 0.14 m/s in the control group, 1.56 ± 0.32 m/s in the sustained virological response (SVR) group, and 1.69 ± 0.31 m/s in the naïve group. Significant differences are seen between the control group and the SVR group (P = 0.0000) and between the SVR group and the naïve group (P = 0.01417). Vs: Velocity.
- Citation: Suda T, Okawa O, Masaoka R, Gyotoku Y, Tokutomi N, Katayama Y, Tamano M. Shear wave elastography in hepatitis C patients before and after antiviral therapy. World J Hepatol 2017; 9(1): 64-68
- URL: https://www.wjgnet.com/1948-5182/full/v9/i1/64.htm
- DOI: https://dx.doi.org/10.4254/wjh.v9.i1.64


