Copyright
©The Author(s) 2017.
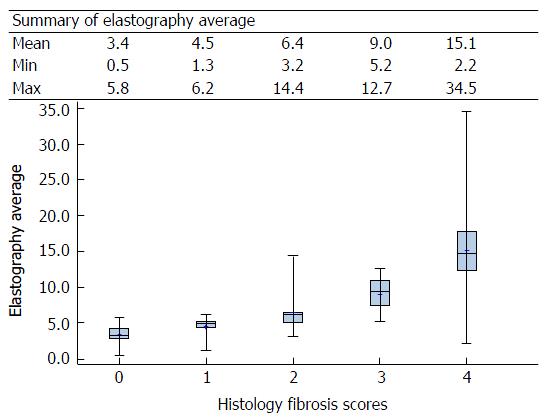
Figure 1 Elastography average vs histology fibrosis score (Box Plot).
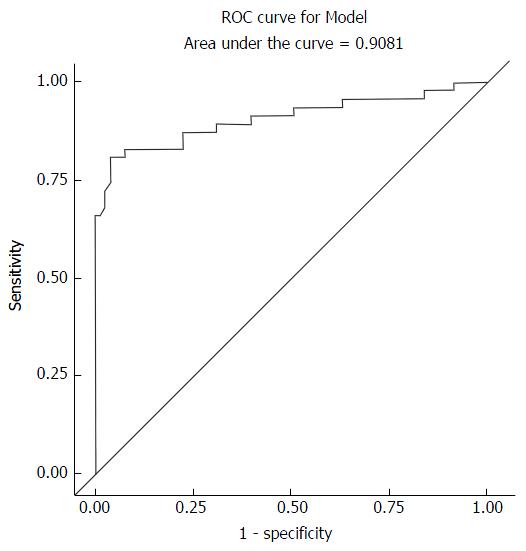
Figure 2 Prediction of histology fibrosis score (Grouping: F0-F1 vs F2-F4) using elastography median.
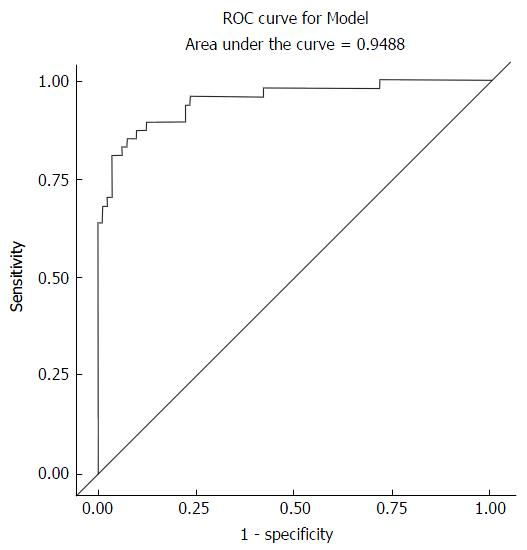
ROC: Receiver operating characteristic.
Figure 3 Prediction of histology fibrosis score (Grouping: F0-1 vs F2-4) using elastography median, aminotransferase platelet ratio index score, age categor, sex and steatosis.
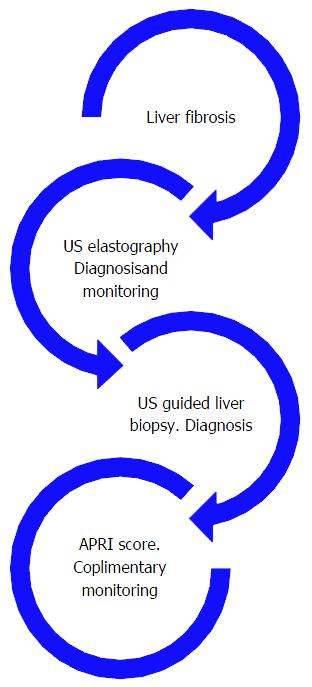
Figure 4 Link between diagnostic tests used in the evaluation of liver fibrosis.
US: Ultrasound; APRI: Aminotransferase platelet ratio index.
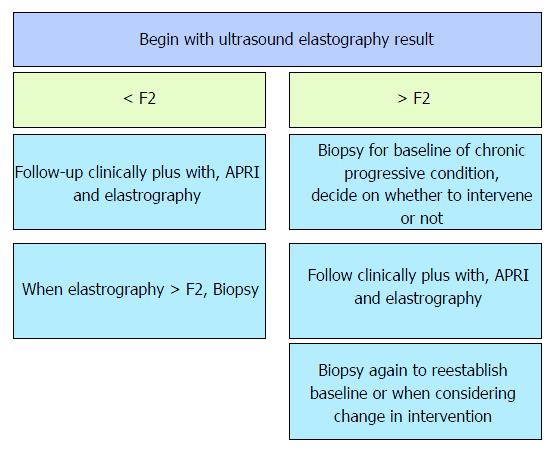
Figure 5 Flow chart depicting use of diagnostic tests in liver fibrosis.
Begin with US SWE result. US: Ultrasound; SWE: Shear wave elastography; APRI: Aminotransferase platelet ratio index.
- Citation: Sande JA, Verjee S, Vinayak S, Amersi F, Ghesani M. Ultrasound shear wave elastography and liver fibrosis: A Prospective Multicenter Study. World J Hepatol 2017; 9(1): 38-47
- URL: https://www.wjgnet.com/1948-5182/full/v9/i1/38.htm
- DOI: https://dx.doi.org/10.4254/wjh.v9.i1.38


