Copyright
©The Author(s) 2016.
World J Hepatol. Sep 8, 2016; 8(25): 1047-1060
Published online Sep 8, 2016. doi: 10.4254/wjh.v8.i25.1047
Published online Sep 8, 2016. doi: 10.4254/wjh.v8.i25.1047
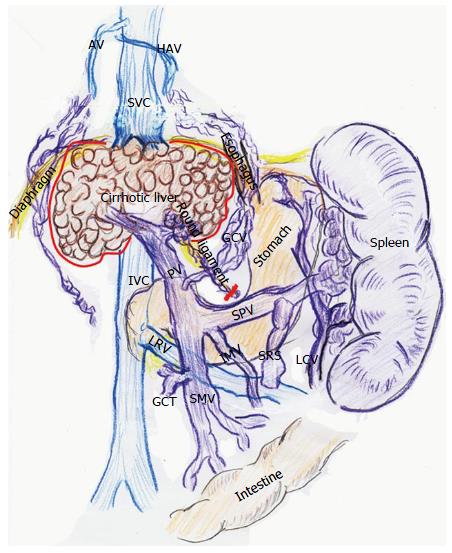
Figure 1 Vascular alterations in advanced liver cirrhosis.
Collaterals along the round ligament are removed with native liver (red line). Collaterals developed around the native liver are also ligated (red line). AV: Azygos vein; GCT: Gastro-colic trunk; GCV: Gastric coronary vein; HAV: Hemi-azygos vein; IMV: Inferior mesenteric vein; IVC: Inferior vena cava; LCV: Left colic vein; LRV: Left renal vein; PV: Portal vein; SMV: Superior mesenteric vein; SPV: Splenic vein; SRS: Splenorenal shunt; SVC: Superior vena cava.
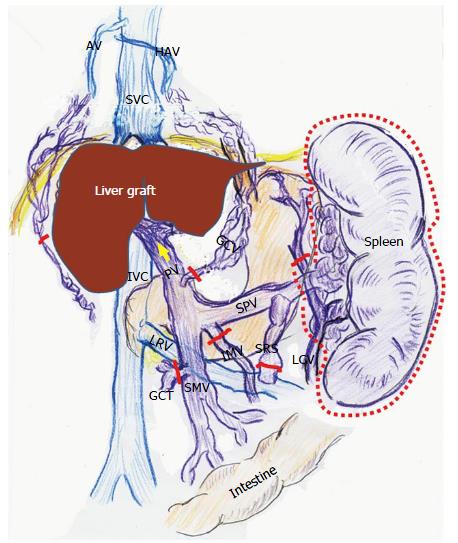
Figure 2 Intentional modulation of portal venous pressure during living-donor liver transplantation.
Splenectomy is chosen to reduce PVP (red dotted line). Ligations (red lines) of vessels (GCV, IMV, and GCT), collaterals (along LCV and around the native liver) and shunt (SRS) prevent a steal of PVF, and thereafter, PVF will increase (yellow arrow). AV: Azygos vein; GCT: Gastro-colic trunk; GCV: Gastric coronary vein; HAV: Hemi-azygos vein; IMV: Inferior mesenteric vein; IVC: Inferior vena cava; LCV: Left colic vein; LRV: Left renal vein; PV: Portal vein; SMV: Superior mesenteric vein; SPV: Splenic vein; SRS: Splenorenal shunt; SVC: Superior vena cava.
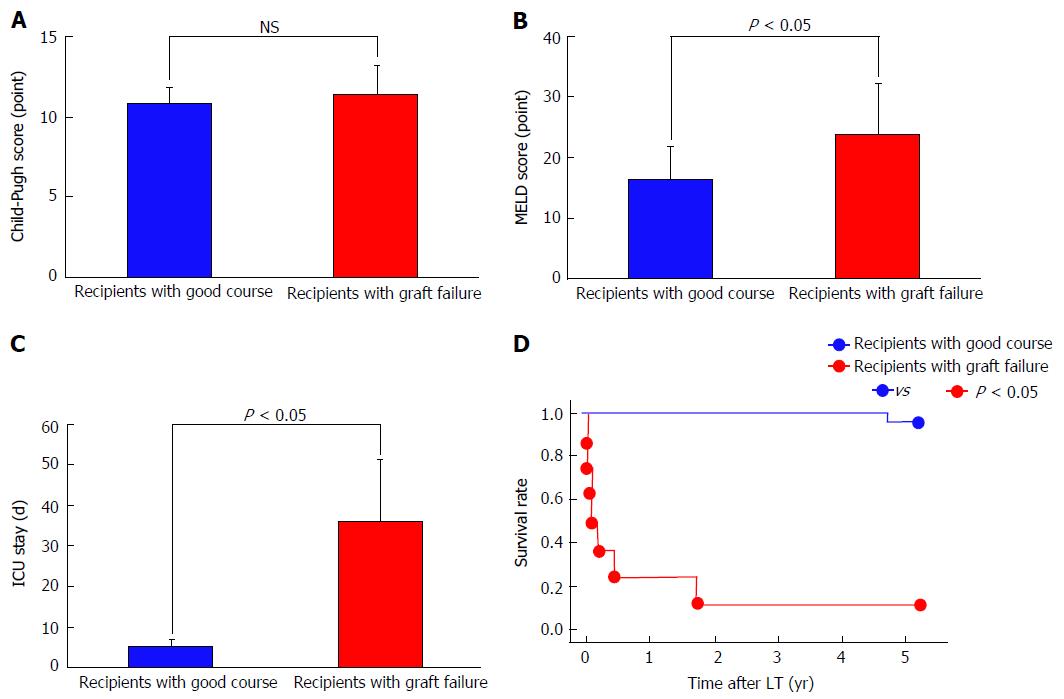
Figure 3 Pre-transplant factors and post-transplant course.
A: Child-Pugh score; B: MELD score; C: Duration of ICU stay; D: Survival rate. ICU: Intensive care unit; LT: Liver transplantation; MELD: Model for end-stage liver disease; NS: Not significant.
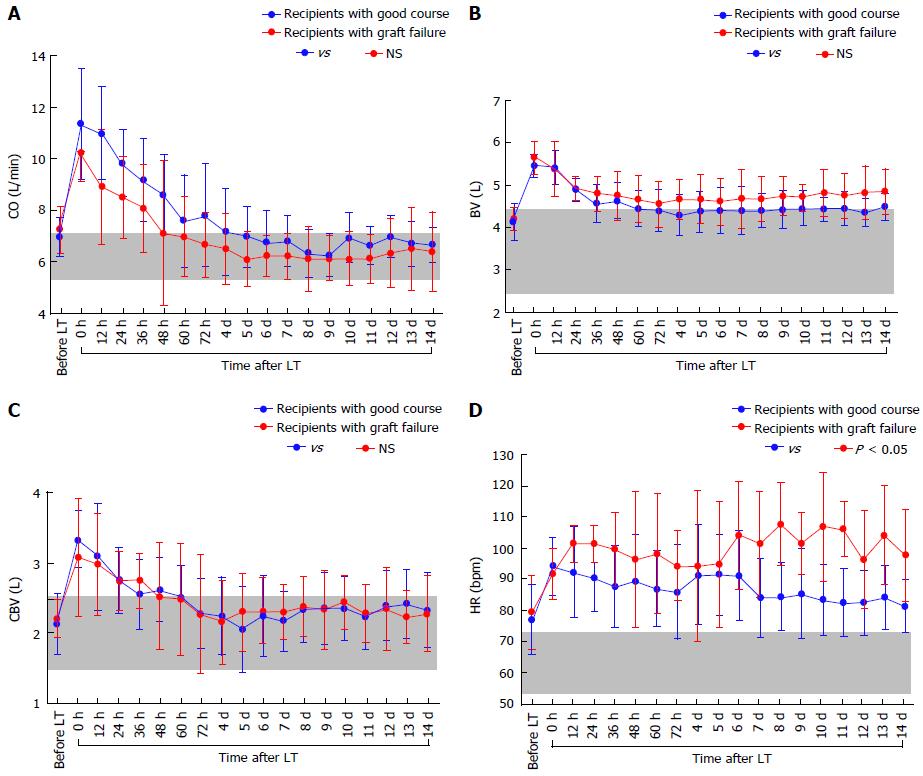
Figure 4 Actual changes in systemic hemodynamic parameters.
A: CO; B: BV; C: CBV; D: HR. Gray zones represent normal ranges. BV: Blood volume; CBV: Central blood volume; CO: Cardiac output; HR: Heart rate; LT: Liver transplantation; NS: Not significant.
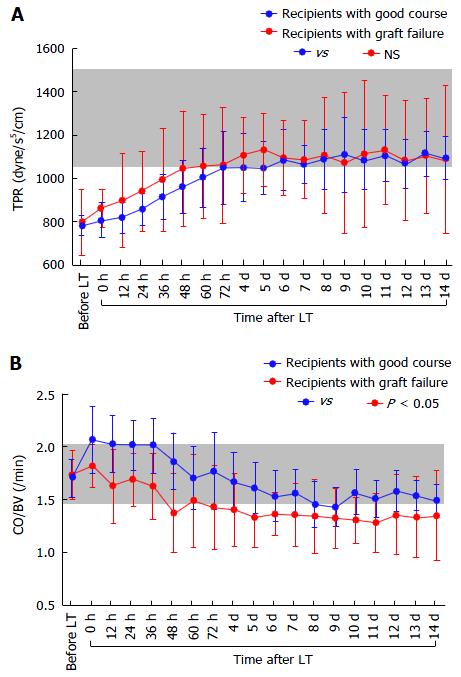
Figure 5 Actual changes in systemic hemodynamic parameters.
A: TPR; B: CO/BV. Gray zones represent normal ranges. BV: Blood volume; CO: Cardiac output; LT: Liver transplantation; NS: Not significant; TPR: Total peripheral resistance.
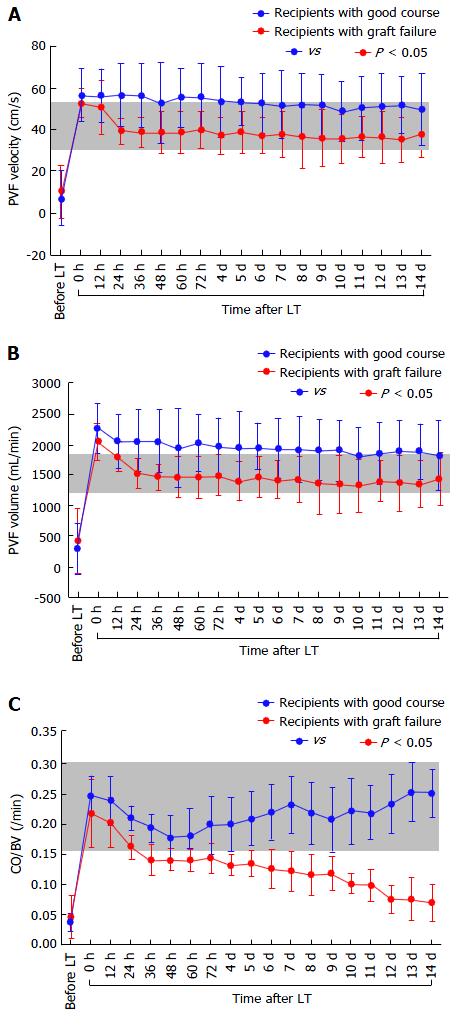
Figure 6 Actual changes in portal venous flow and indocyanine green elimination constant.
A: PVF velocity; B: PVF volume; C: kICG. Gray zones represent normal ranges. ICG: Indocyanine green; kICG: Indocyanine green elimination constant; LT: Liver transplantation; PVF: Portal venous flow.
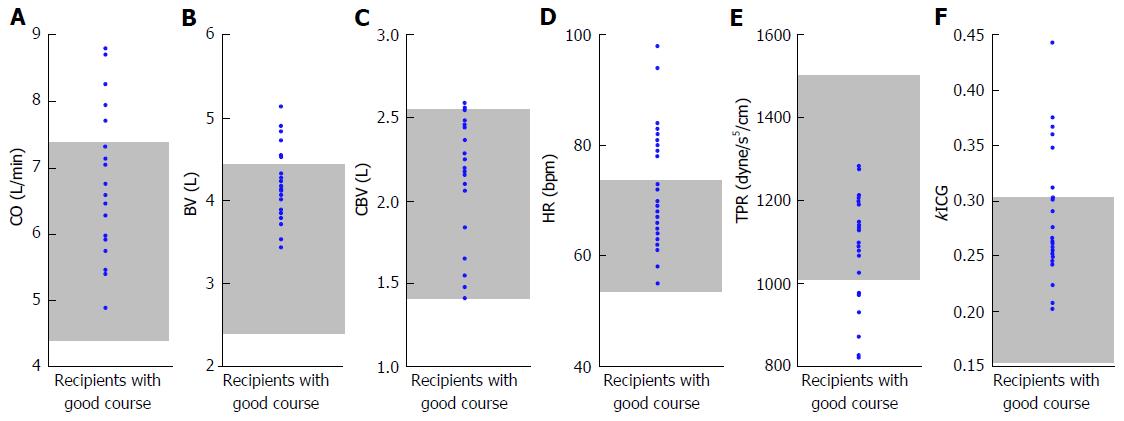
Figure 7 Systemic hemodynamic parameters 3 mo after liver transplantation.
A-F: CO, BV, CBV, HR, TPR, and kICG in patients who survived are shown. Gray zones represent normal ranges. BV: Blood volume; CBV: Central blood volume; CO: Cardiac output; HR: Heart rate; ICG: Indocyanine green; kICG: Indocyanine green elimination constant; LT: Liver transplantation; TPR: Total peripheral resistance.
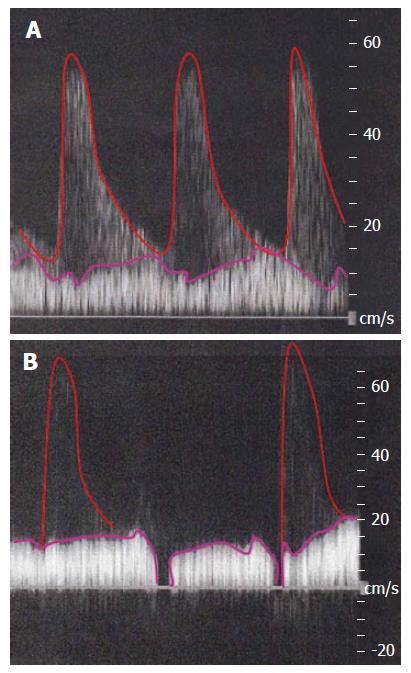
Figure 8 Decreased portal venous flow due to unstable systemic hyperdynamic state (A and B).
Even a subtle instability of systemic hyperdynamic state (i.e., an imbalance of CO and BV in the lower TPR) results in a decreased PVF. During the PVF measurement by Doppler ultrasound, HA waveform (Red line) blends into the background of a decreased PVF (purple lines). BV: Blood volume; CO: Cardiac output; HA: Hepatic artery; PVF: Portal venous flow; TPR: Total peripheral resistance.
- Citation: Hori T, Ogura Y, Onishi Y, Kamei H, Kurata N, Kainuma M, Takahashi H, Suzuki S, Ichikawa T, Mizuno S, Aoyama T, Ishida Y, Hirai T, Hayashi T, Hasegawa K, Takeichi H, Ota A, Kodera Y, Sugimoto H, Iida T, Yagi S, Taniguchi K, Uemoto S. Systemic hemodynamics in advanced cirrhosis: Concerns during perioperative period of liver transplantation. World J Hepatol 2016; 8(25): 1047-1060
- URL: https://www.wjgnet.com/1948-5182/full/v8/i25/1047.htm
- DOI: https://dx.doi.org/10.4254/wjh.v8.i25.1047


