Copyright
©The Author(s) 2016.
World J Hepatol. May 28, 2016; 8(15): 649-658
Published online May 28, 2016. doi: 10.4254/wjh.v8.i15.649
Published online May 28, 2016. doi: 10.4254/wjh.v8.i15.649
Figure 1 The flow of the hepatitis C virus disease progression model.
HCC: Hepatocellular carcinoma.
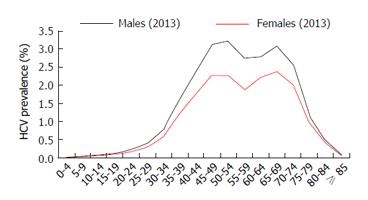
Figure 2 Age and gender distribution of anti-hepatitis C virus prevalence, Argentina, 2013.
HCV: Hepatitis C virus.
Figure 3 Model inputs for scenarios 1 and 2.
SVR: Sustained virologic response; G1: Genotype 1.
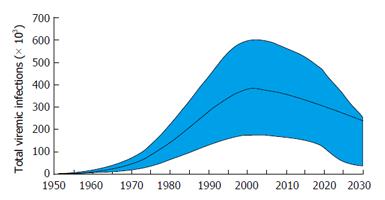
Figure 4 Total number of viremic hepatitis C virus cases (with uncertainty intervals) according to year, 1950 to 2030.
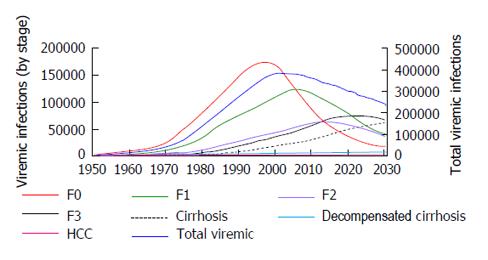
Figure 5 Number of viremic hepatitis C virus cases, in total and according to disease stage.
F: Fibrosis stage; HCC: Hepatocellular carcinoma.
Figure 6 Proportion of all viremic hepatitis C virus cases according to disease stage, 1950 to 2030.
Decomp: Decompensated; F: Fibrosis stage; HCC: Hepatocellular carcinoma; HCV: Hepatitis C virus.
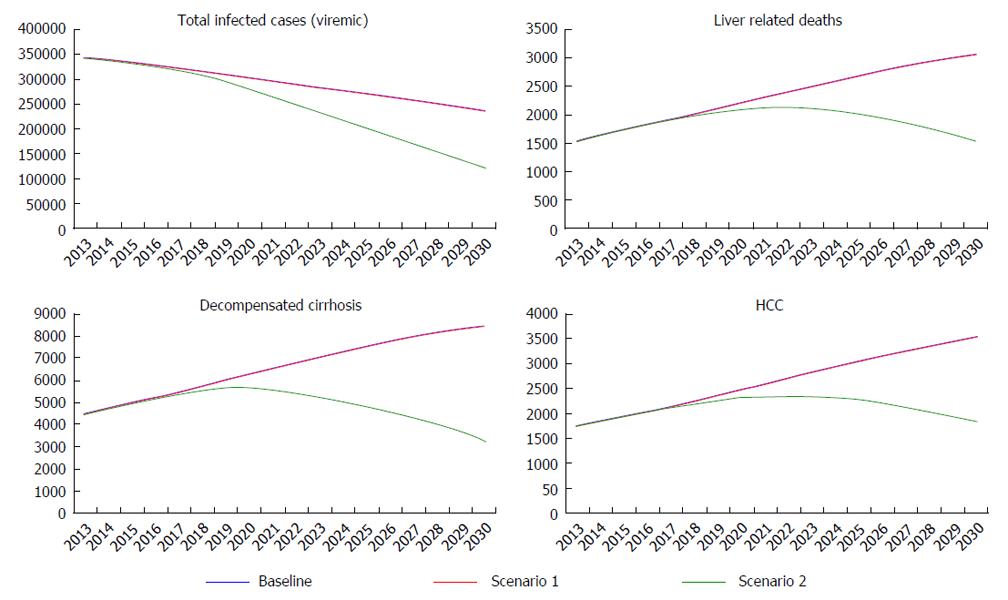
Figure 7 Selected hepatitis C virus-related outcomes by scenario - Argentina, 2013-2030.
Scenario 1: Increased treatment efficacy; Scenario 2: Increased treatment efficacy and increased annual diagnosed/treated populations; HCC: Hepatocellular carcinoma.
- Citation: Ridruejo E, Bessone F, Daruich JR, Estes C, Gadano AC, Razavi H, Villamil FG, Silva MO. Hepatitis C virus infection in Argentina: Burden of chronic disease. World J Hepatol 2016; 8(15): 649-658
- URL: https://www.wjgnet.com/1948-5182/full/v8/i15/649.htm
- DOI: https://dx.doi.org/10.4254/wjh.v8.i15.649


