©The Author(s) 2015.
World J Hepatol. Apr 28, 2015; 7(6): 846-858
Published online Apr 28, 2015. doi: 10.4254/wjh.v7.i6.846
Published online Apr 28, 2015. doi: 10.4254/wjh.v7.i6.846
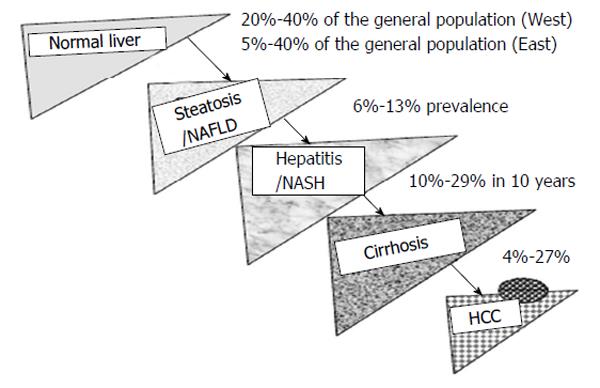
Figure 1 Natural history of nonalcoholic fatty liver disease.
Data adapted from Hsu et al[59]. NAFLD: Non-alcoholic fatty liver disease; HCC: Hepatocellular carcinoma; NASH: Non-alcoholic steatohepatitis.
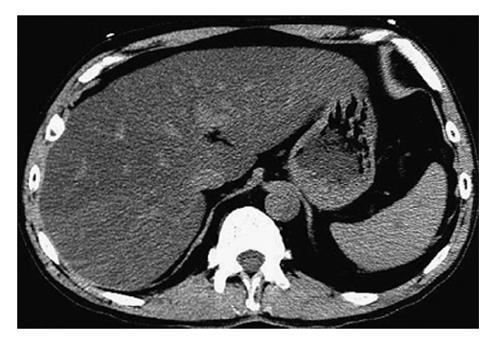
Figure 2 Axial unenhanced computed tomography scan reveals diffuse liver steatosis.
Data adapted from Charatcharoenwitthaya et al[76].
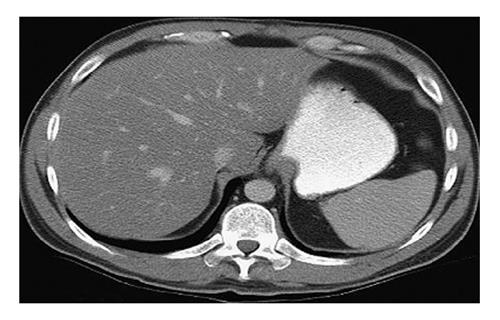
Figure 3 Axial enhanced computed tomography scan reveals diffuse liver steatosis.
Data adapted from Rofsky et al[75].
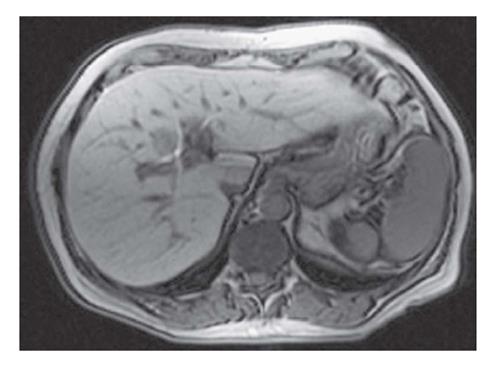
Figure 4 T1-weighted magnetic resonance imaging of fatty liver, demonstrating a bright liver.
Data adapted from Mazhar et al[74].
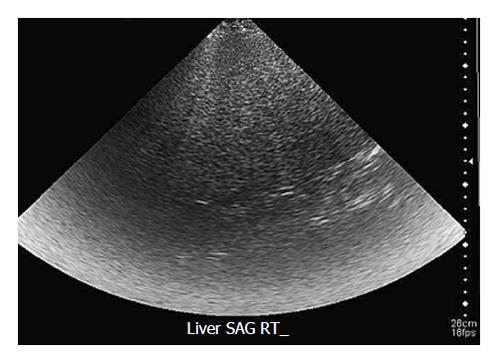
Figure 5 Sagittal ultrasound image of the liver shows diffuse liver steatosis.
Data adapted from Yokoo et al[79].
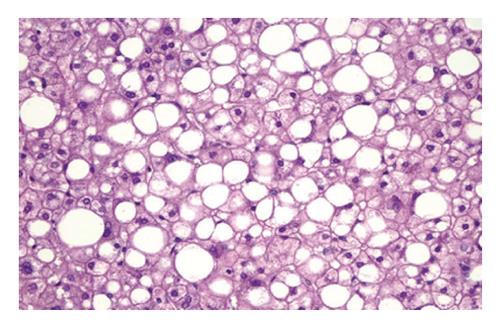
Figure 6 Histologic features of simple steatosis (fatty liver).
Data adapted from Feldman et al[69].
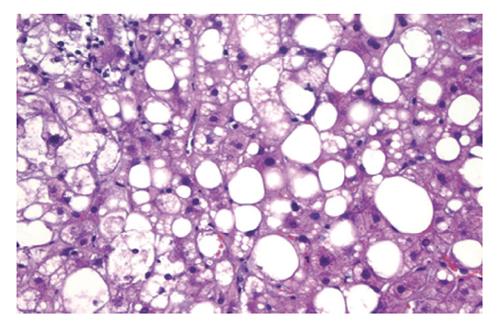
Figure 7 Histologic features of nonalcoholic steatohepatitis.
Data adapted from Cortez-Pinto et al[83].
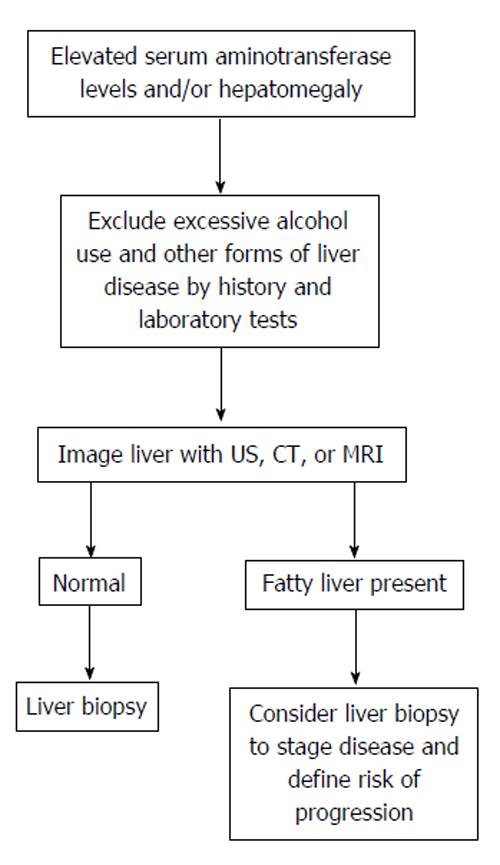
Figure 8 Diagnostic approach to patients with suspected nonalcoholic fatty liver disease.
Data adapted from Feldman et al[69]. CT: Computed tomography; MRI: Magnetic resonance imaging; US: Ultrasound.
- Citation: Abd El-Kader SM, El-Den Ashmawy EMS. Non-alcoholic fatty liver disease: The diagnosis and management. World J Hepatol 2015; 7(6): 846-858
- URL: https://www.wjgnet.com/1948-5182/full/v7/i6/846.htm
- DOI: https://dx.doi.org/10.4254/wjh.v7.i6.846


