©The Author(s) 2015.
World J Hepatol. Jun 18, 2015; 7(11): 1509-1520
Published online Jun 18, 2015. doi: 10.4254/wjh.v7.i11.1509
Published online Jun 18, 2015. doi: 10.4254/wjh.v7.i11.1509
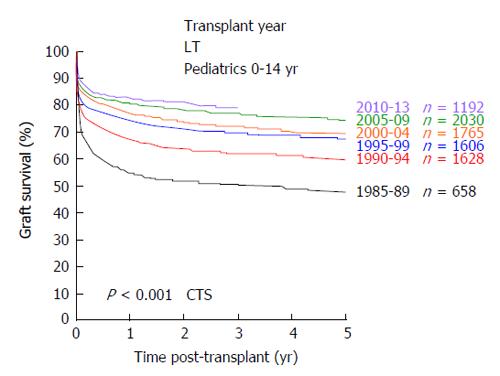
Figure 1 Development of graft survival after pediatric liver transplantation from 1985 until 2013 (collaborative transplant study data).
CTS: Collaborative transplant study; LT: Liver transplants.
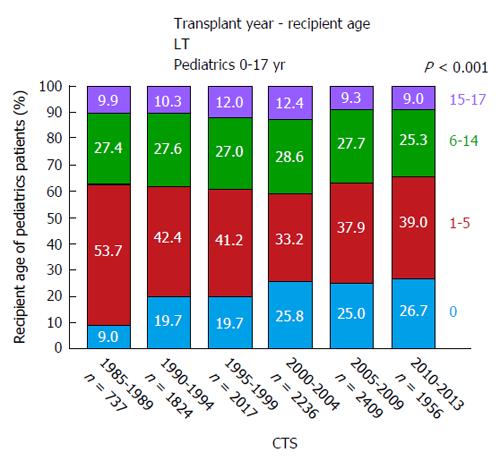
Figure 2 Age distribution of pediatric liver transplantation recipients from 1985 until 2013 (collaborative transplant study data).
CTS: Collaborative transplant study; LT: Liver transplants.
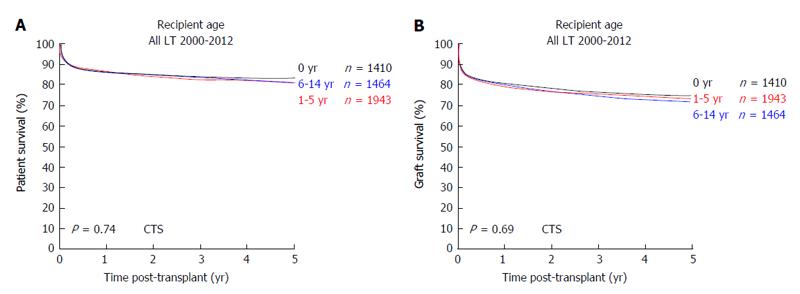
Figure 3 Outcome after pediatric liver transplantation in relation to the recipients age.
A: Patient survival; B: Graft survival (collaborative transplant study data). CTS: Collaborative transplant study; LT: Liver transplants.
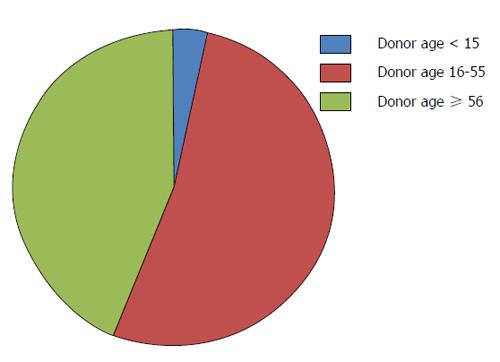
Figure 4 Donor age within the Eurotransplant network in 2013.
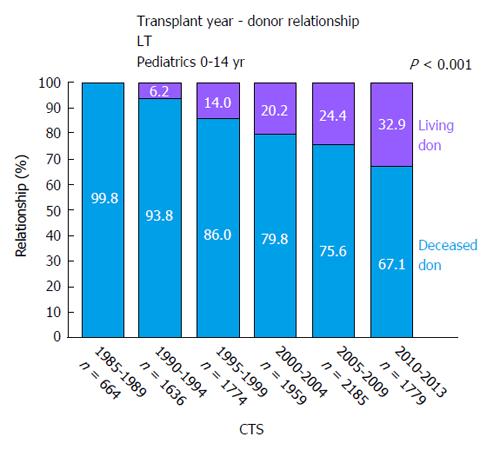
Figure 5 Relation of living (purple) vs deceased (blue) donors in pediatric liver transplantation from 1985 until 2013 (collaborative transplant study data).
CTS: Collaborative transplant study; LT: Liver transplants.
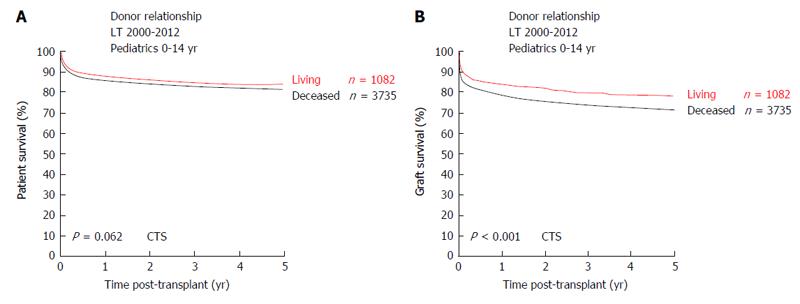
Figure 6 Outcome after living vs deceased donor pediatric liver transplantation.
A: Patient survival; B: Graft survival (collaborative transplant study data). CTS: Collaborative transplant study; LT: Liver transplants.
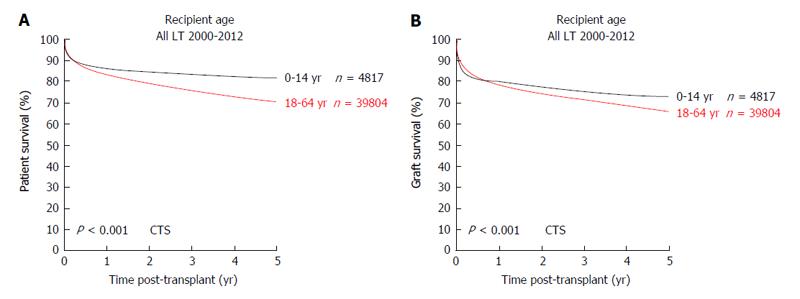
Figure 7 Outcome of liver transplantation in pediatric vs adult recipients.
A: Patient survival; B: Graft survival (collaborative transplant study data). CTS: Collaborative transplant study; LT: Liver transplants.
- Citation: Hackl C, Schlitt HJ, Melter M, Knoppke B, Loss M. Current developments in pediatric liver transplantation. World J Hepatol 2015; 7(11): 1509-1520
- URL: https://www.wjgnet.com/1948-5182/full/v7/i11/1509.htm
- DOI: https://dx.doi.org/10.4254/wjh.v7.i11.1509


