Copyright
©2010 Baishideng.
World J Hepatol. Mar 27, 2010; 2(3): 127-135
Published online Mar 27, 2010. doi: 10.4254/wjh.v2.i3.127
Published online Mar 27, 2010. doi: 10.4254/wjh.v2.i3.127
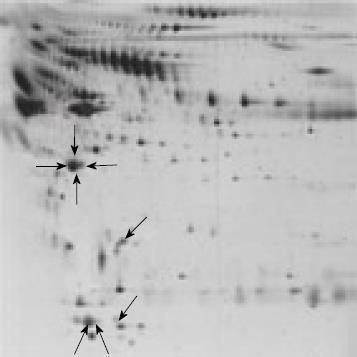
Figure 1 Eight spots were differentially expressed when HCC samples were compared with non-HCC samples by proteomics analysis.
Figure 2 Plasma levels of Apo-A1, Apo-A4 and Apo-E in controls and HCC patients.
Apo-A4 was significantly higher in patients without HCC than in patients with HCC (2.1 ± 0.4 vs 1.4 ± 0.5; bP < 0.01).
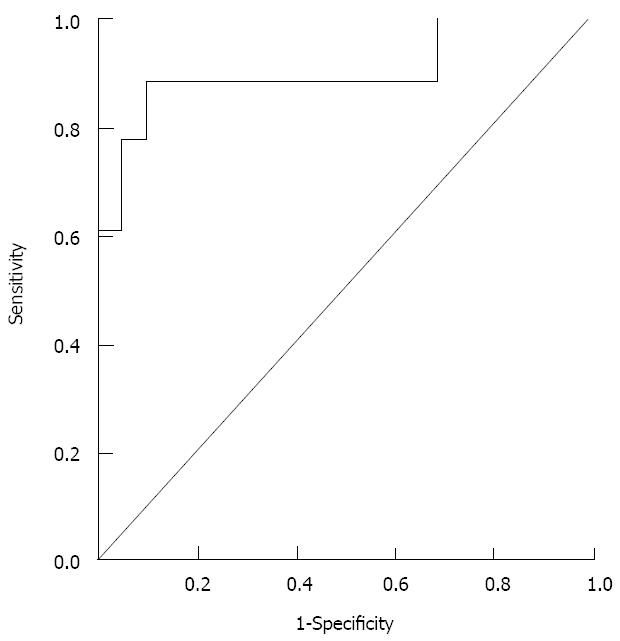
Figure 3 ROC curve from the logistic equation.
The AUROC is 0.91 with a cut-off level of 0.35; with an 89% sensitivity and a 91% specificity for diagnosis of HCC.
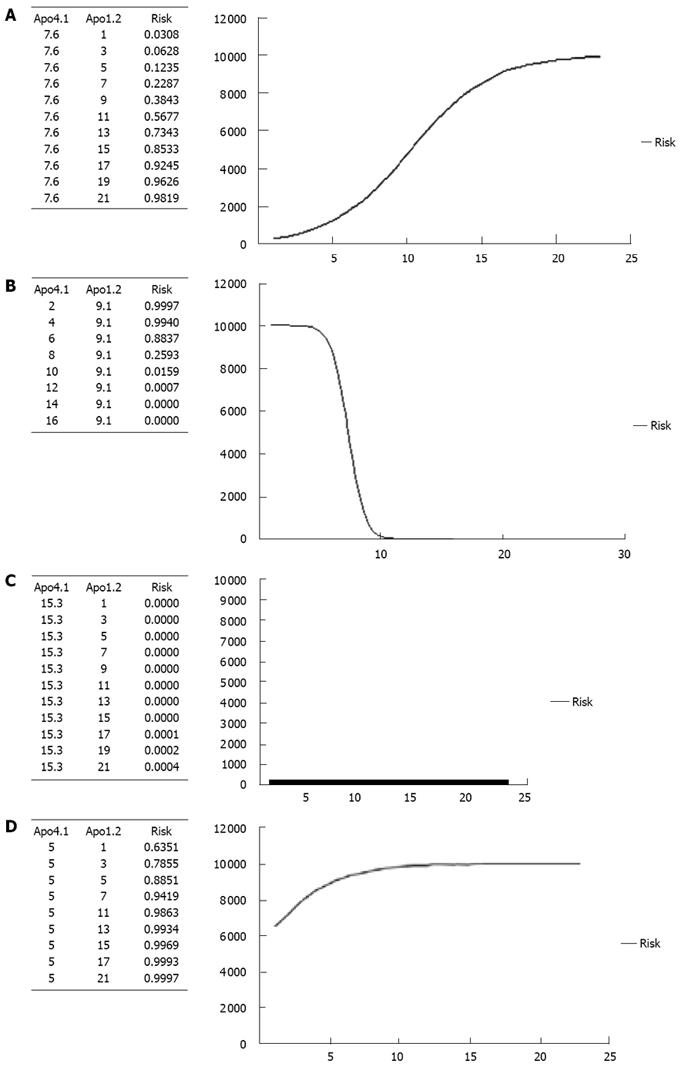
Figure 4 Risk curve of hepatocellular carcinoma for different values of one apolipoprotein and a fixed level of the other apolipoproteins.
A: Risk of HCC for different Apo-A1 levels and fixed Apo-A4 level (mean); B: Risk of HCC for different Apo-A4 levels and fixed Apo-A1 level (mean); C: Risk of HCC for different Apo-A1 levels and fixed Apo-A4 level (maximum); D: Risk of HCC for different Apo-A1 levels and fixed Apo-A4 level (minimum).
- Citation: Pleguezuelo M, Lopez-Sanchez LM, Rodriguez-Ariza A, Montero JL, Briceno J, Ciria R, Muntane J, Mata ML. Proteomic analysis for developing new biomarkers of hepatocellular carcinoma. World J Hepatol 2010; 2(3): 127-135
- URL: https://www.wjgnet.com/1948-5182/full/v2/i3/127.htm
- DOI: https://dx.doi.org/10.4254/wjh.v2.i3.127


