
















Copyright: ©Author(s) 2026.
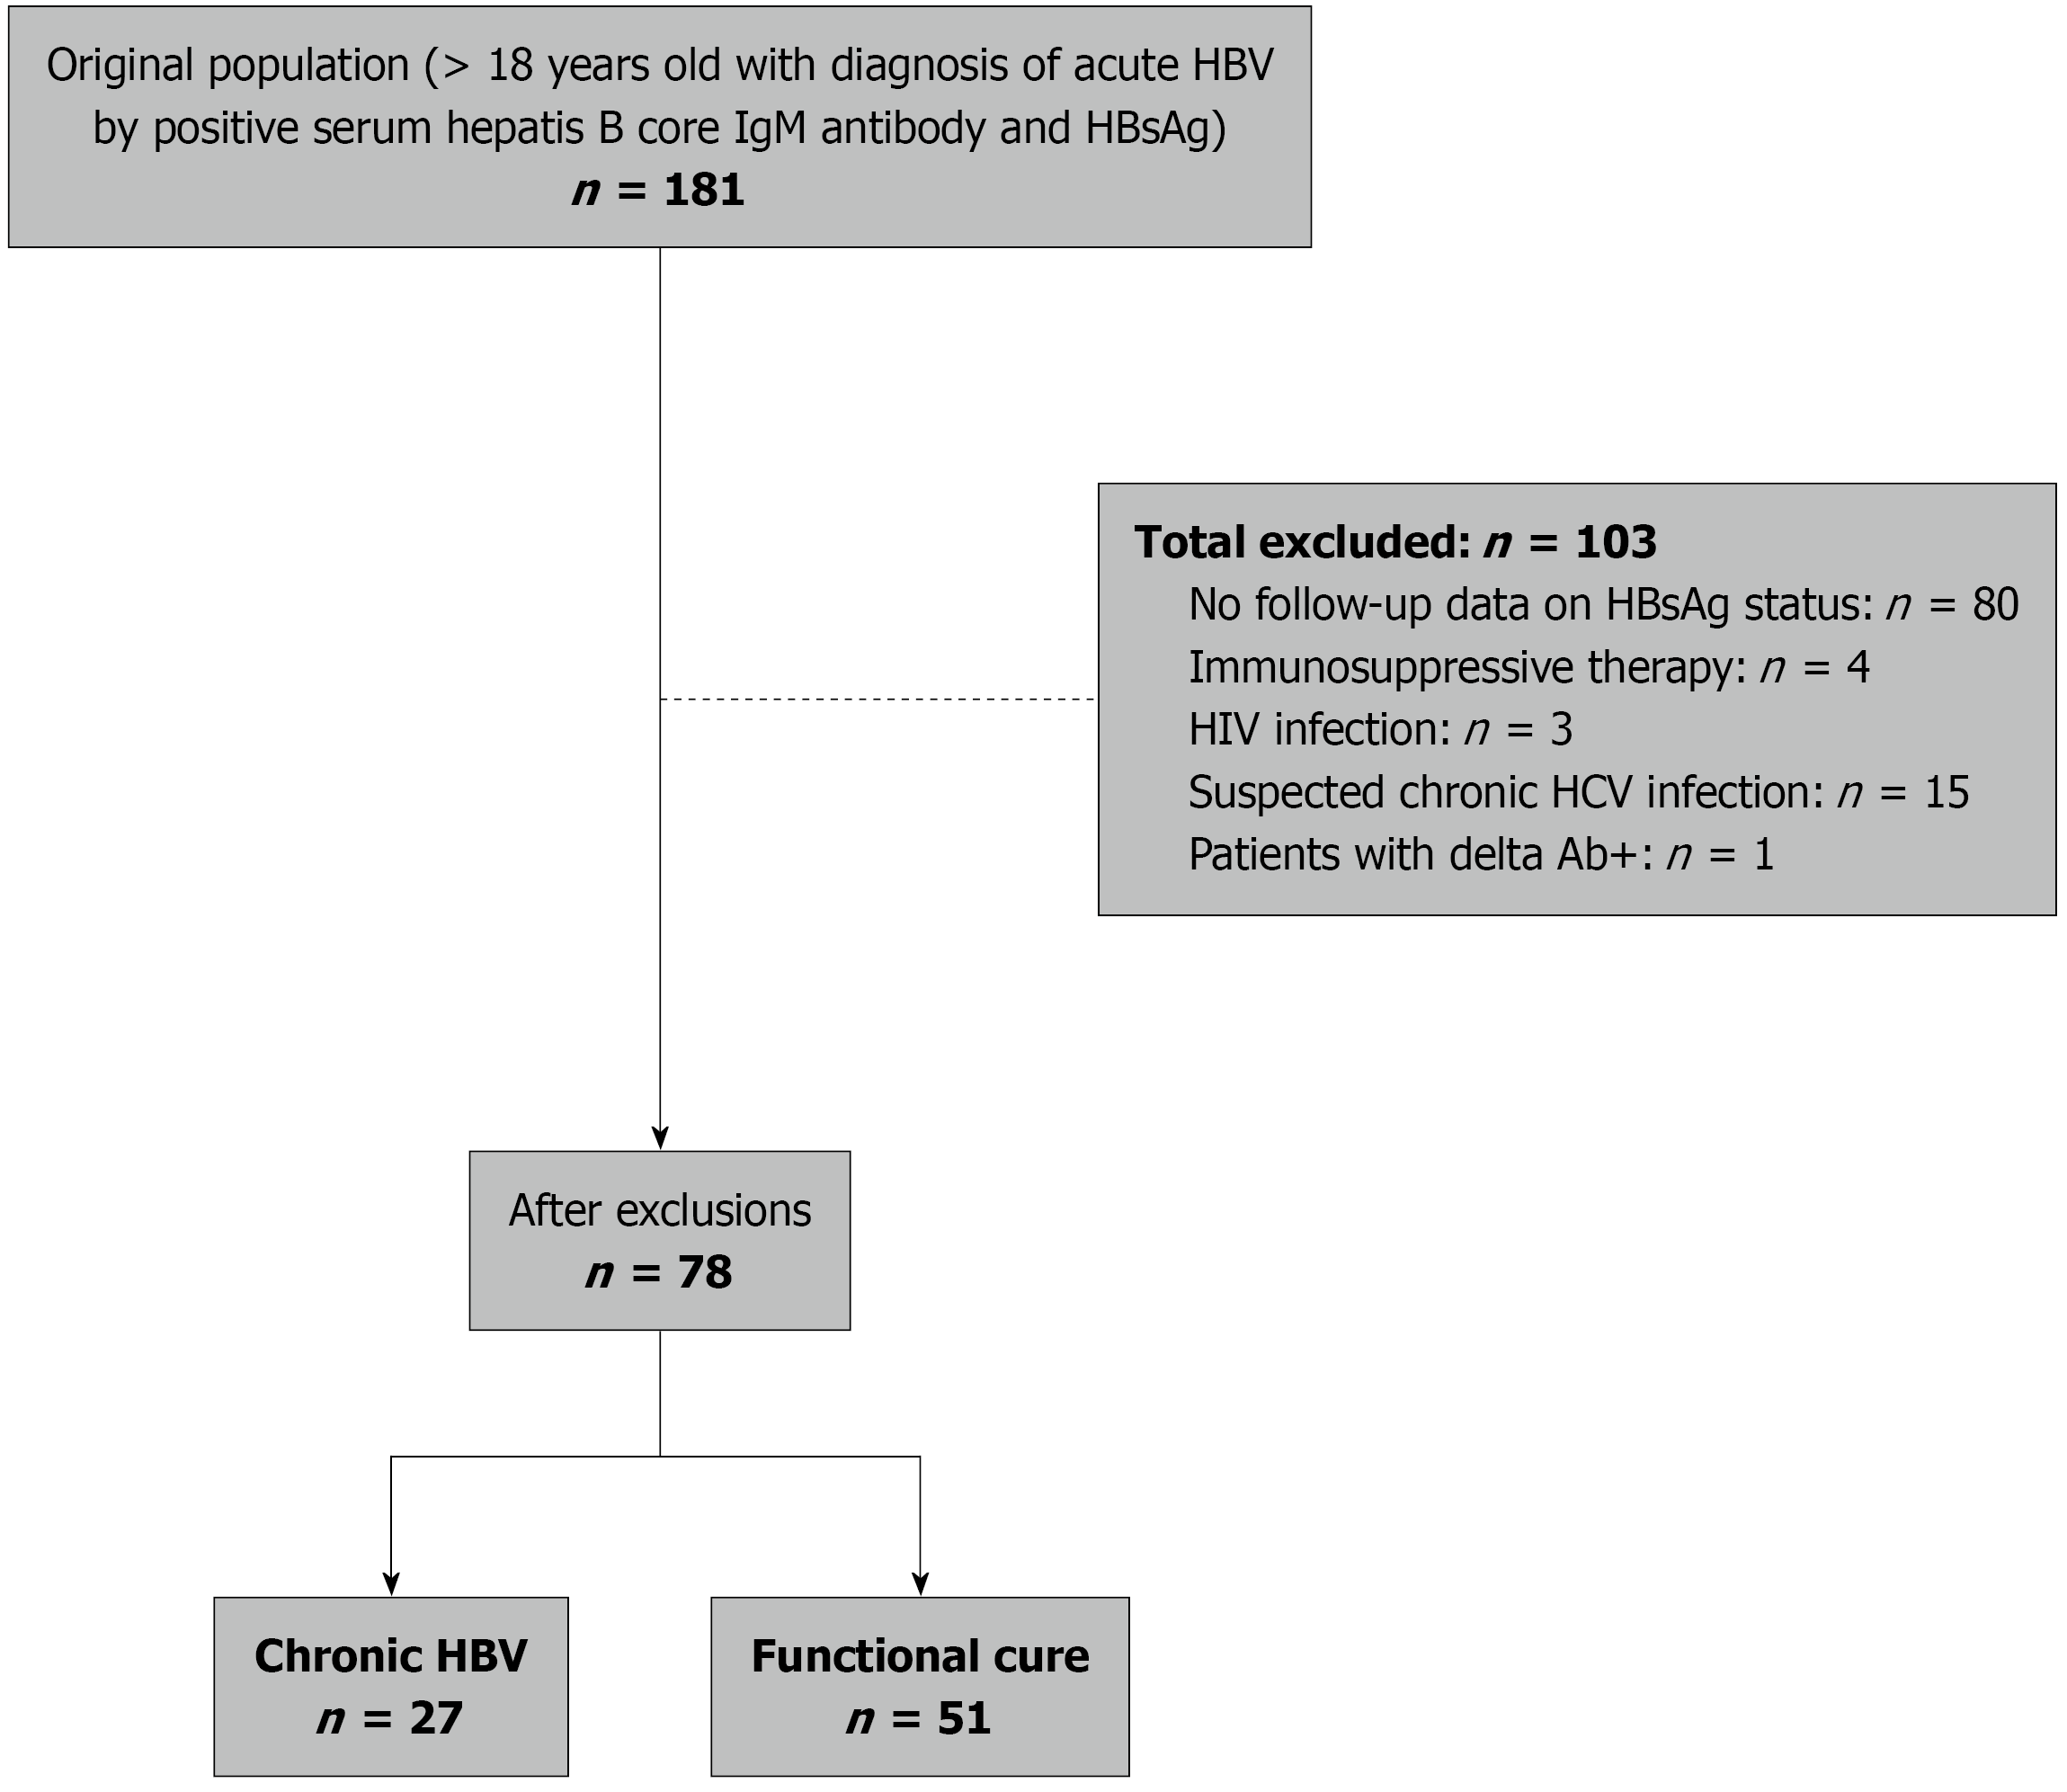
Figure 1 Study population flow chart.
HBV: Hepatitis B virus; HBsAg: Hepatitis B surface antigen; HCV: Hepatitis C virus; HIV: Human immunodeficiency virus.
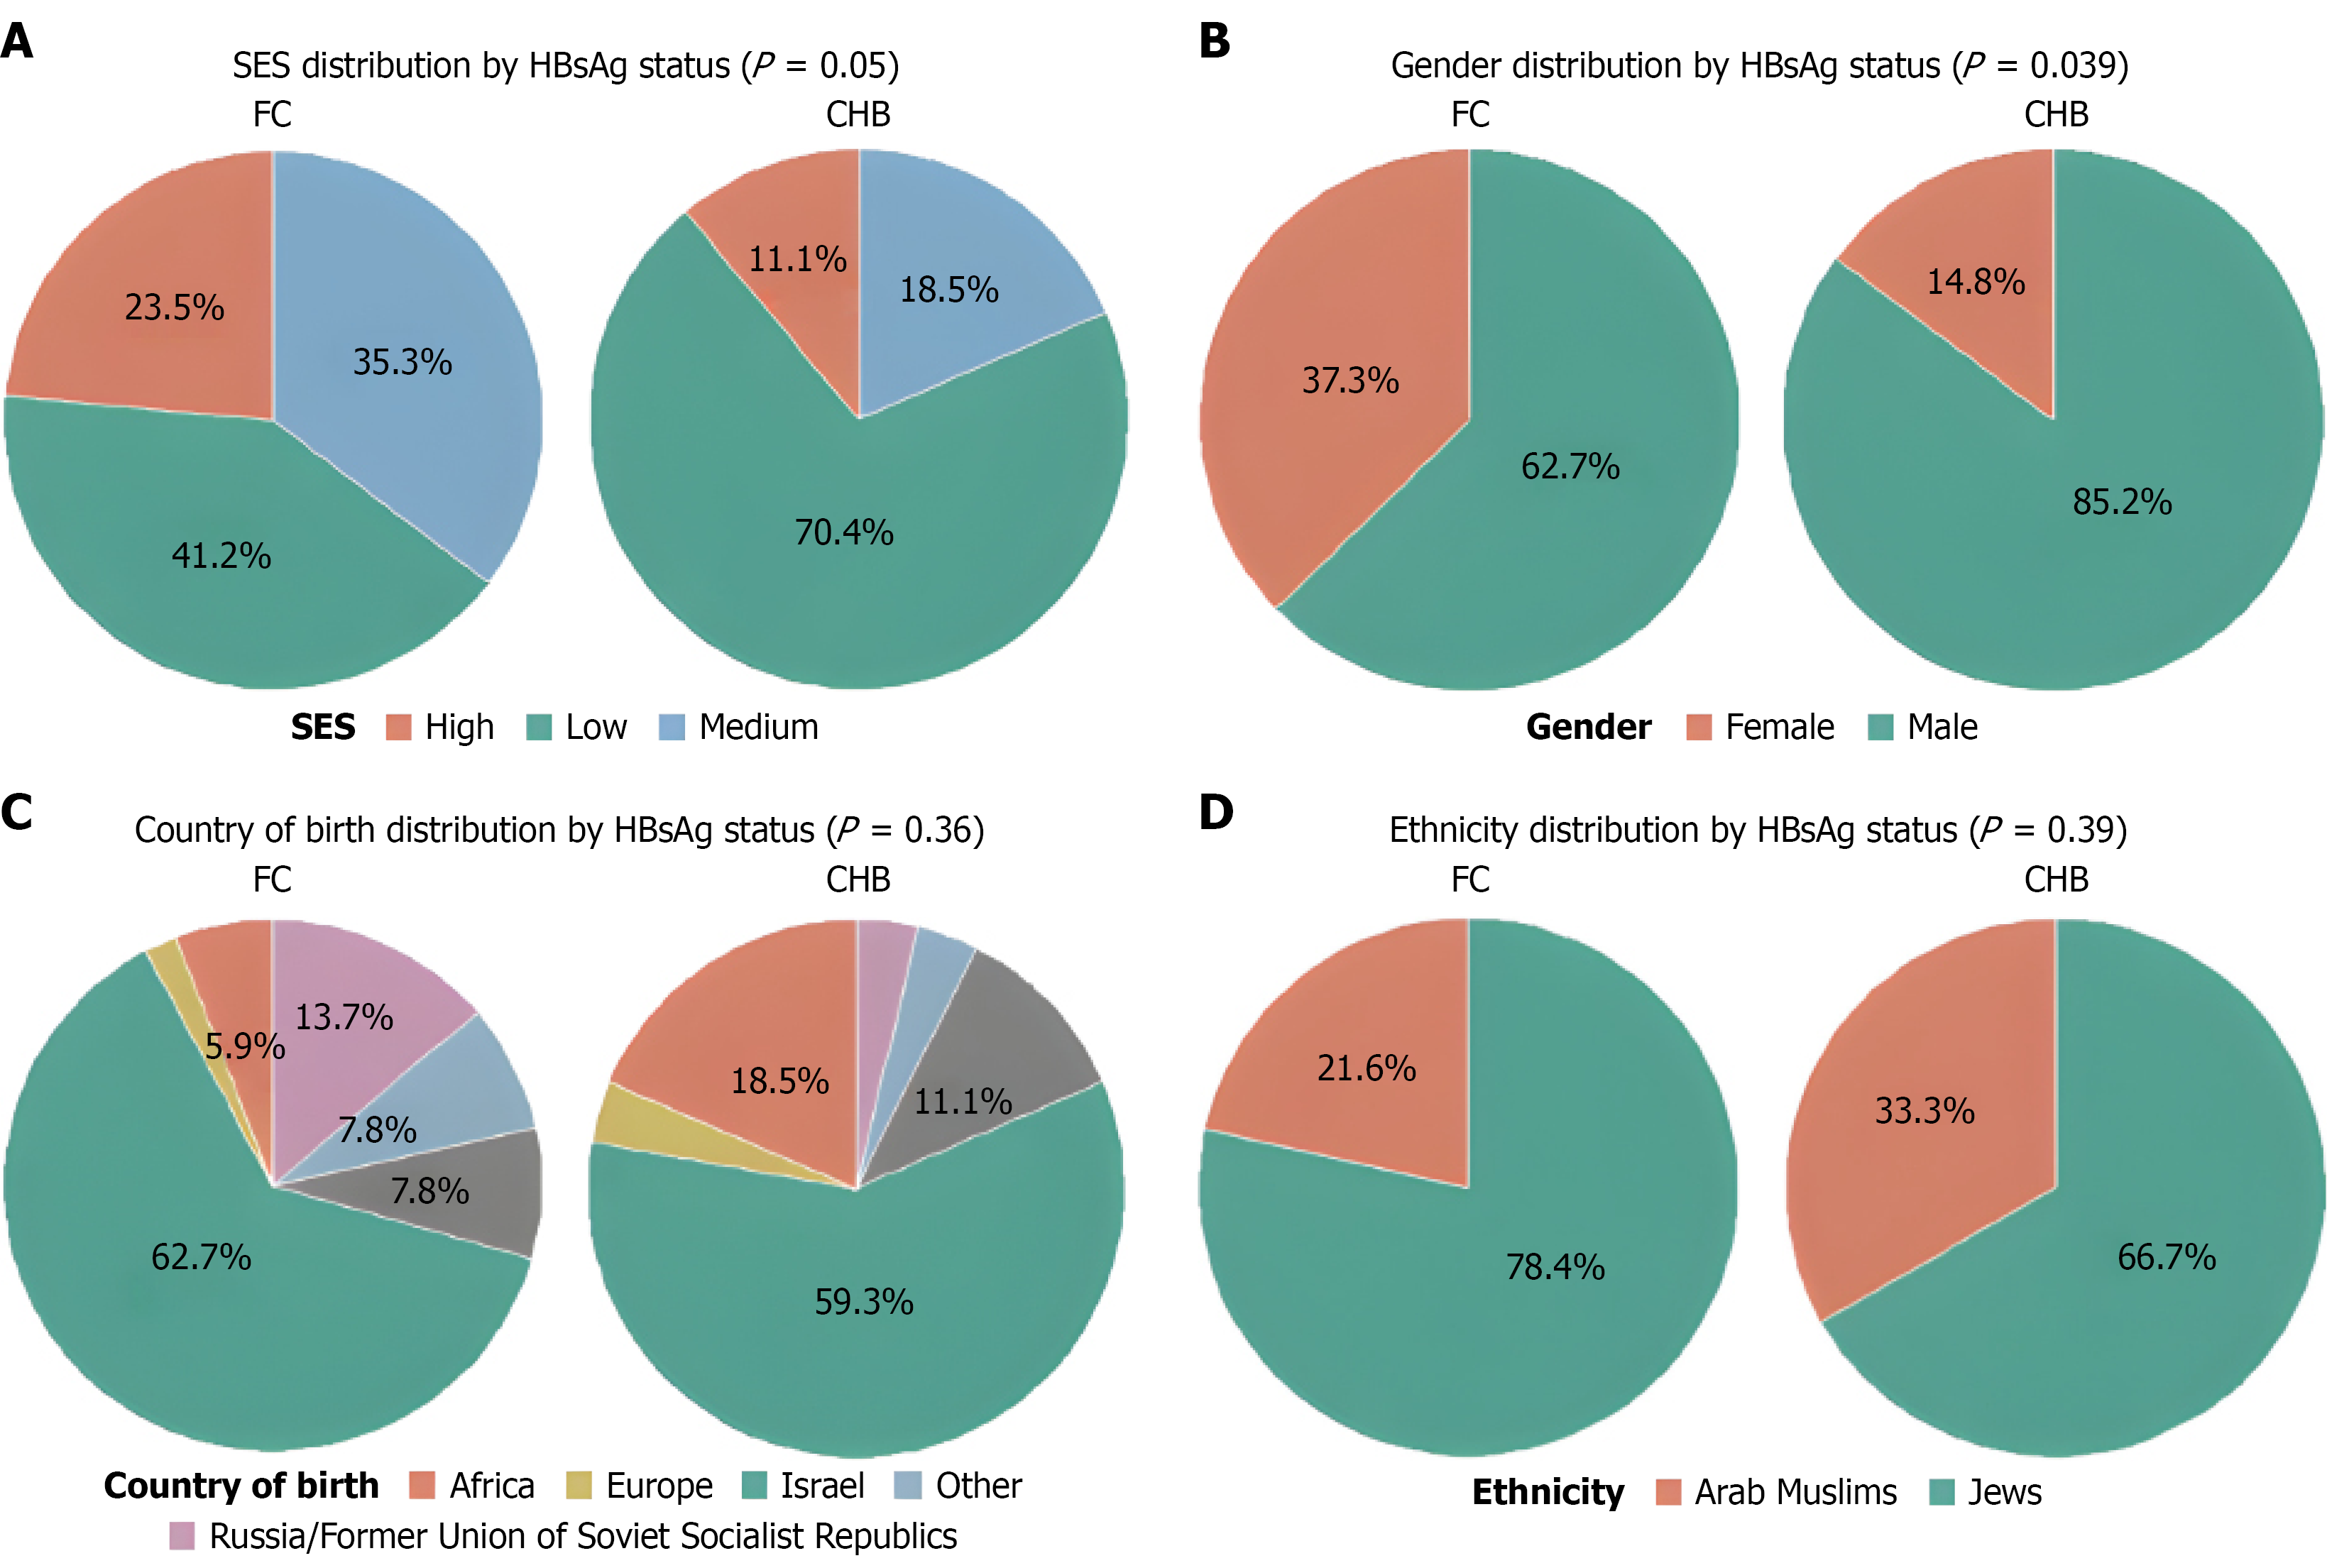
Figure 2 Distribution of patients within the functional cure and chronic hepatitis B virus groups according to socioeconomic status, country of birth, gender and ethnicity.
A: Socioeconomic status distribution by hepatitis B surface antigen (HBsAg) status; B: Gender distribution by HBsAg status; C: Country of birth distribution by HBsAg status; D: Ethnicity distribution by HBsAg status. HBsAg: Hepatitis B surface antigen; SES: Socioeconomic status; FC: Functional cure; CHB: Chronic hepatitis B virus.
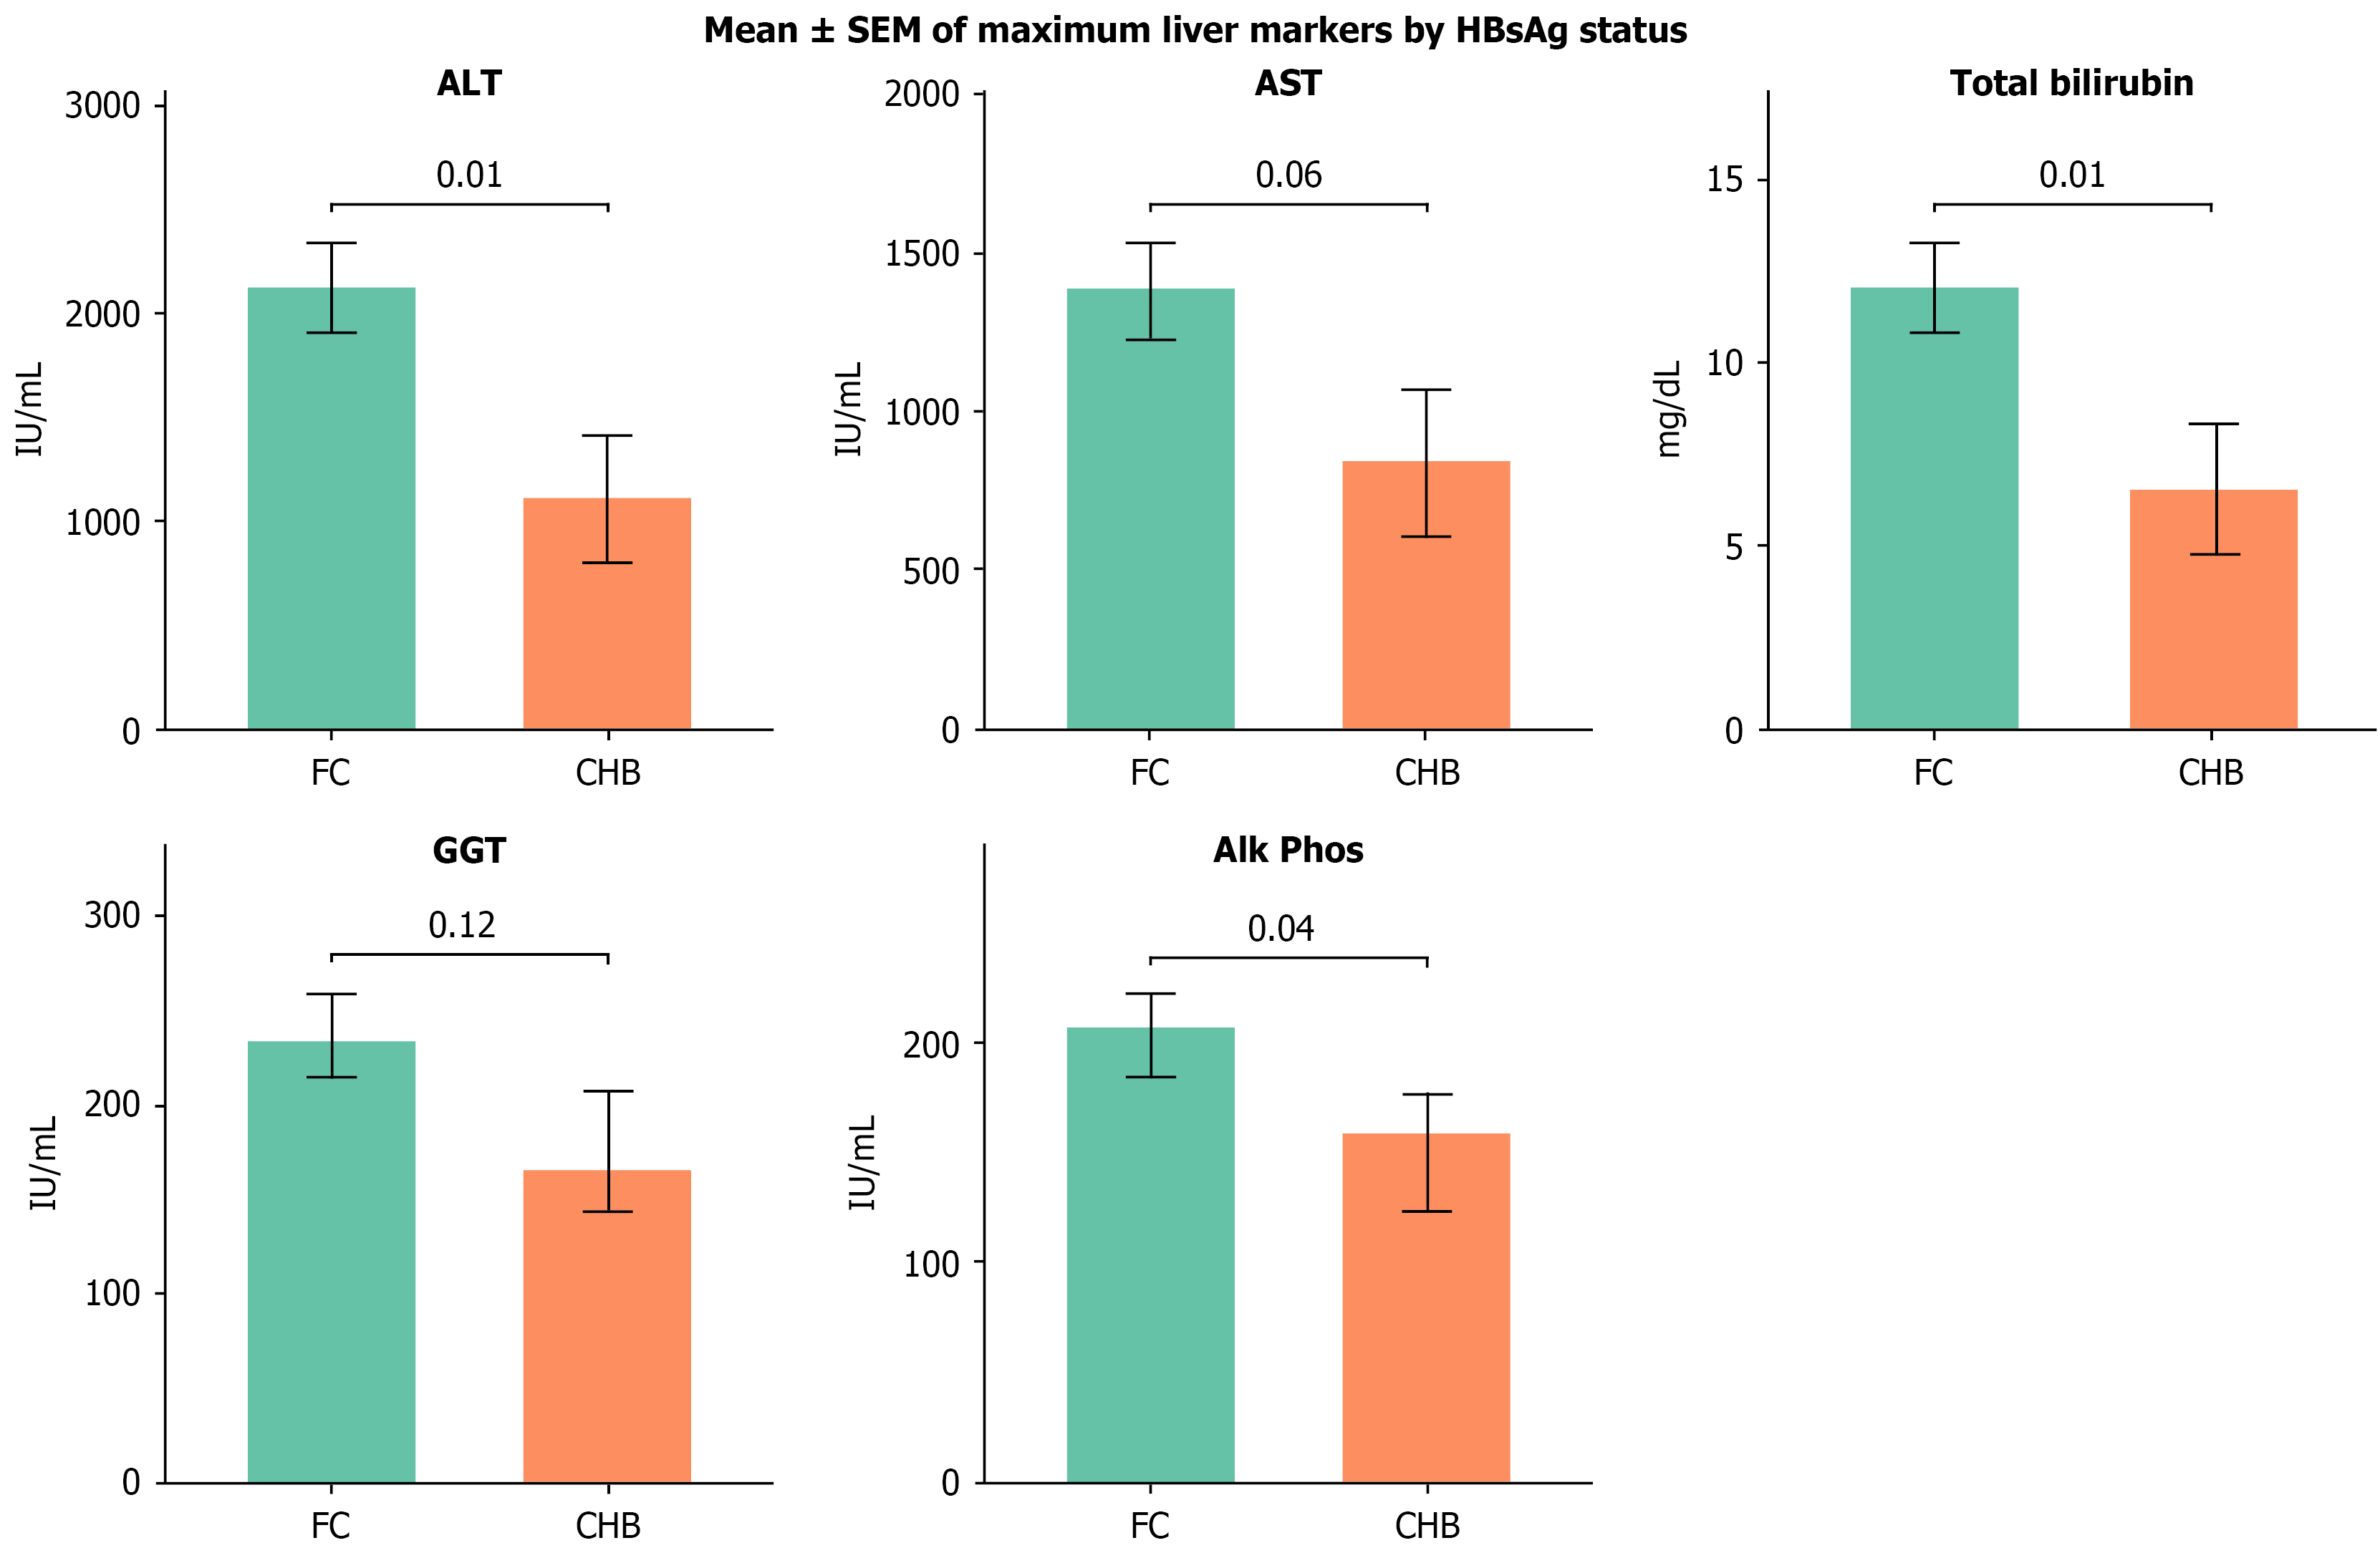
Figure 3 Comparison of liver enzymes and total bilirubin during acute hepatitis B virus presentation in patients who achieved functional cure and patients with chronic hepatitis B virus.
HBsAg: Hepatitis B surface antigen; ALT: Alanine aminotransferase; AST: Aspartate aminotransferase; GGT: Gamma glutamyl transferase; Alk Phos: Alkaline phosphatase; FC: Functional cure; CHB: Chronic hepatitis B virus.
- Citation: Yardeni D, Gershbaum Tobin J, Itkowitz B, Lipnizkiy I, Abu Juma’a A, Abu-Freha N, Keren-Naus A, Turgeman M, Nevo-Shor A, Gish RG, Etzion O. Acute hepatitis B in the vaccination era: Predictors of functional cure and chronicity. World J Hepatol 2026; 18(8): 124108
- URL: https://www.wjgnet.com/1948-5182/full/v18/i8/124108.htm
- DOI: https://dx.doi.org/10.4254/wjh.124108