
















Copyright: ©Author(s) 2026.
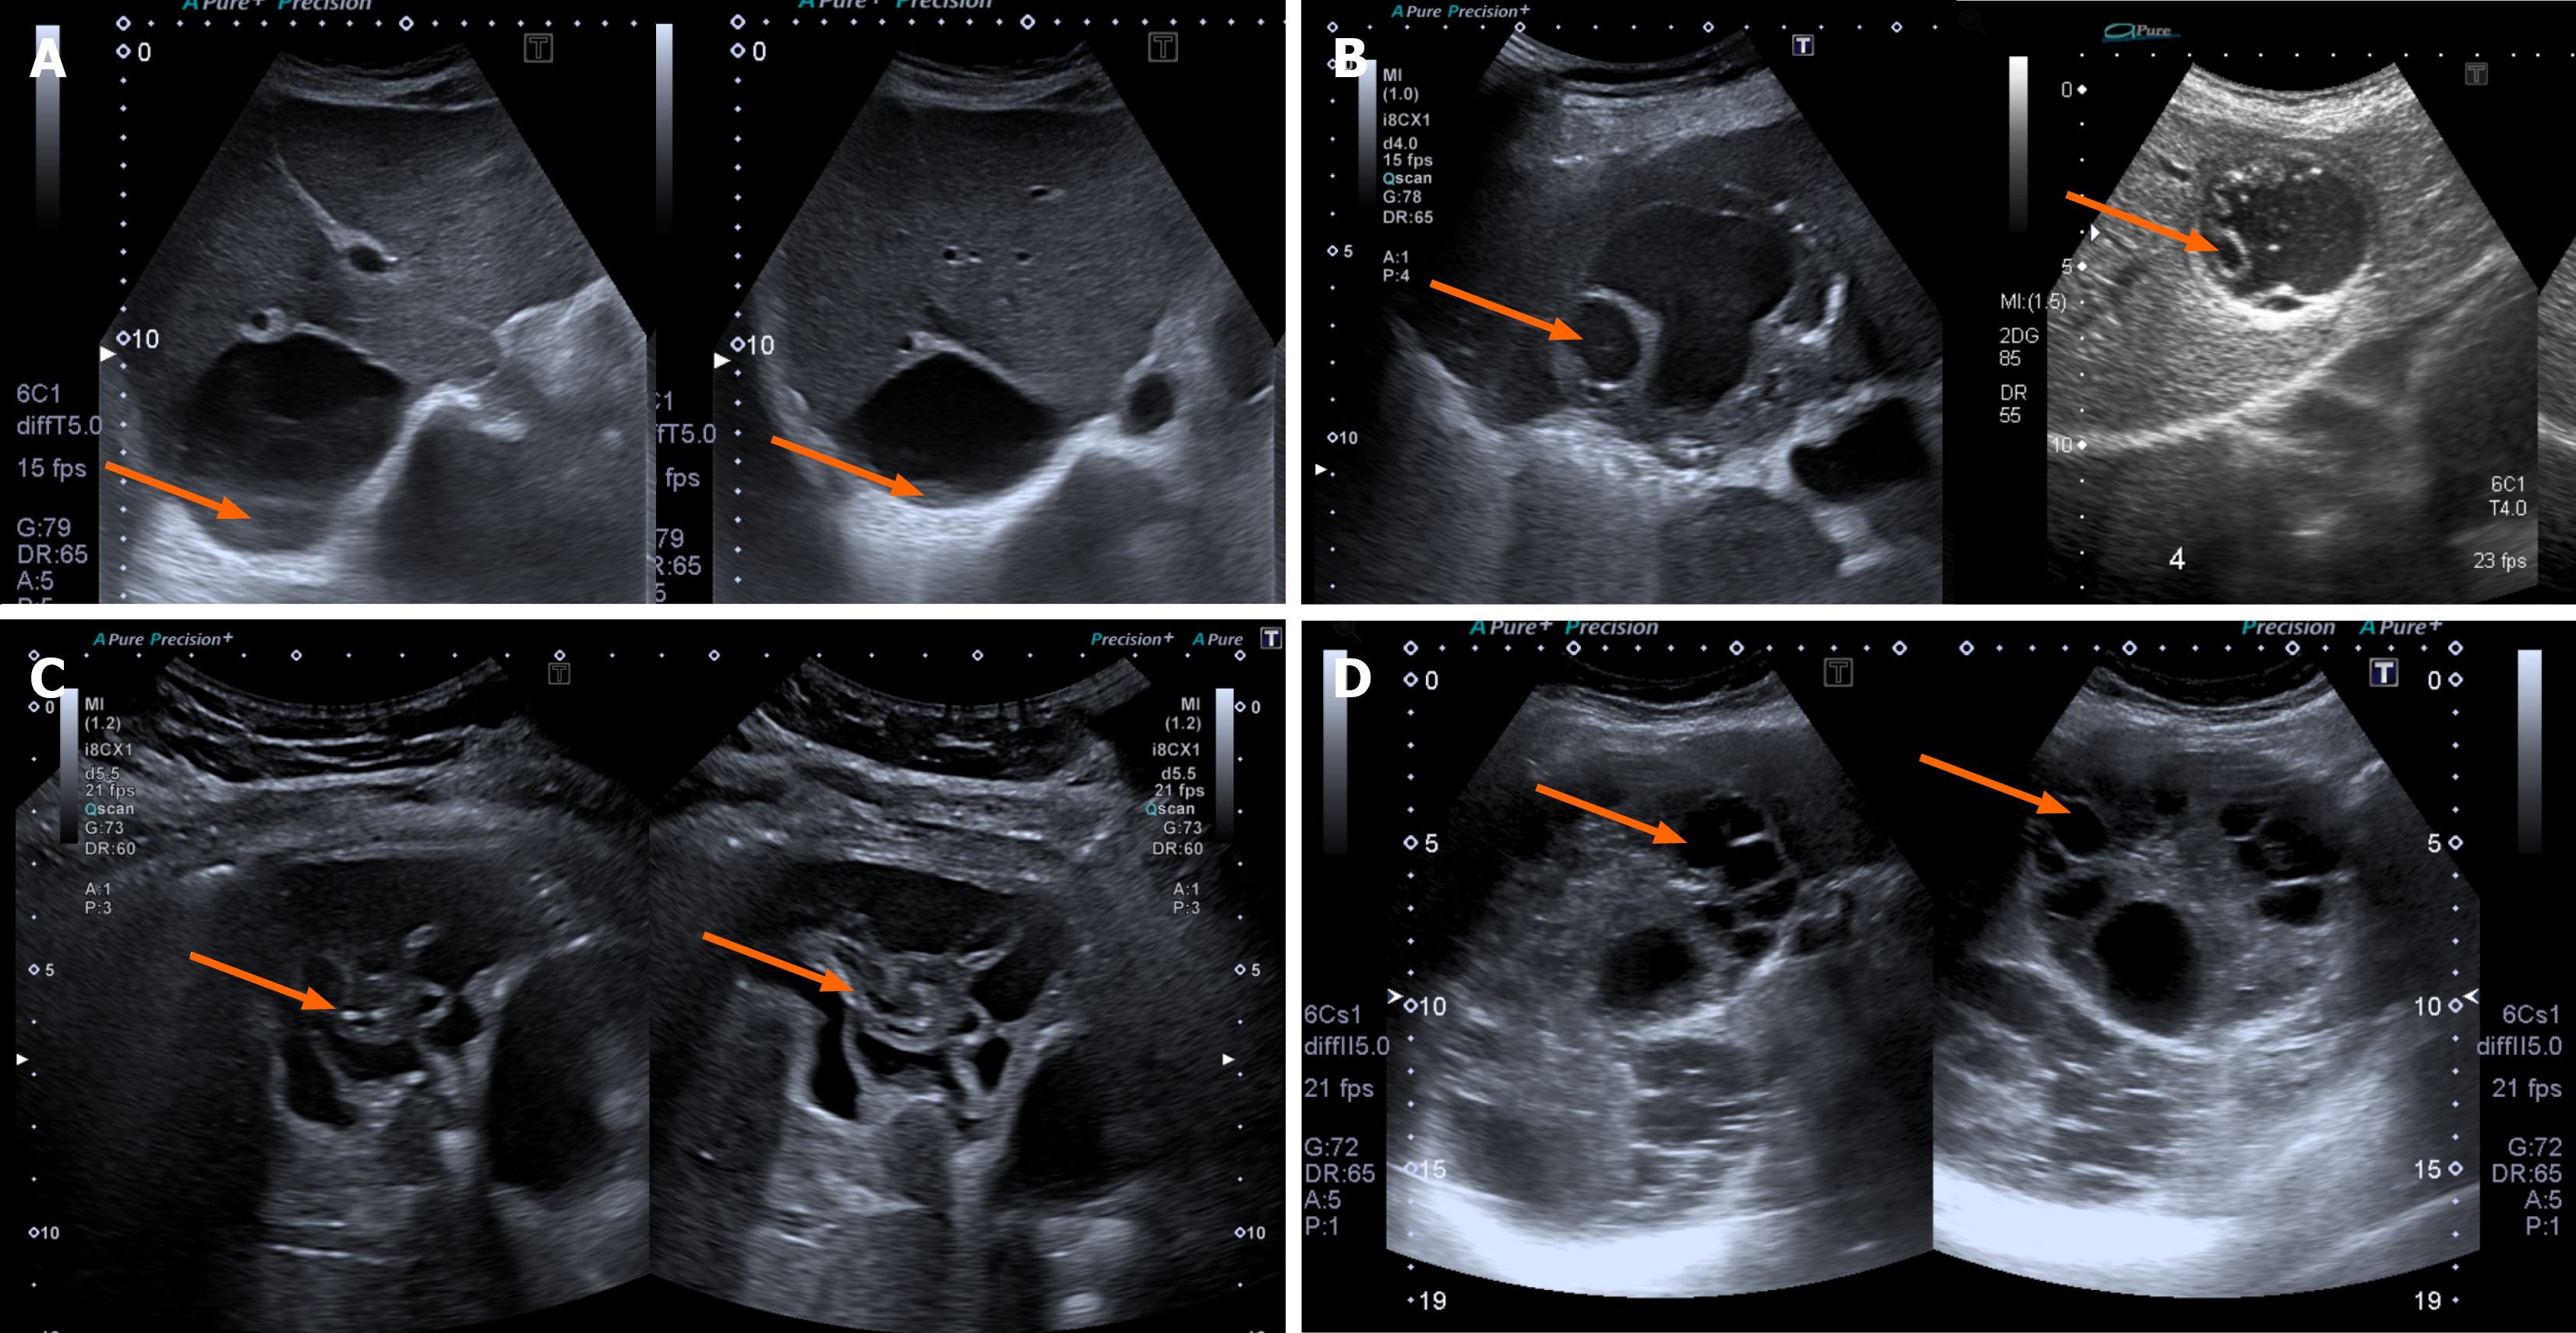
Figure 1 Ultrasound images showing the World Health Organization–Informal Working Group on Echinococcosis classification of hydatid cysts (cystic echinococcosis 1-3).
A: Cystic echinococcosis (CE) 1 hydatid cyst with the presence of echogenic fine “hydatid sand” (arrows); B: CE2 hydatid cysts with the presence of peripheral daughter cysts (arrows); C: Internal detached membranes within a CE3a-type cyst (arrows); D: CE3b hydatid cysts with internal membranes, daughter cysts and a central solid maternal matrix (arrows).
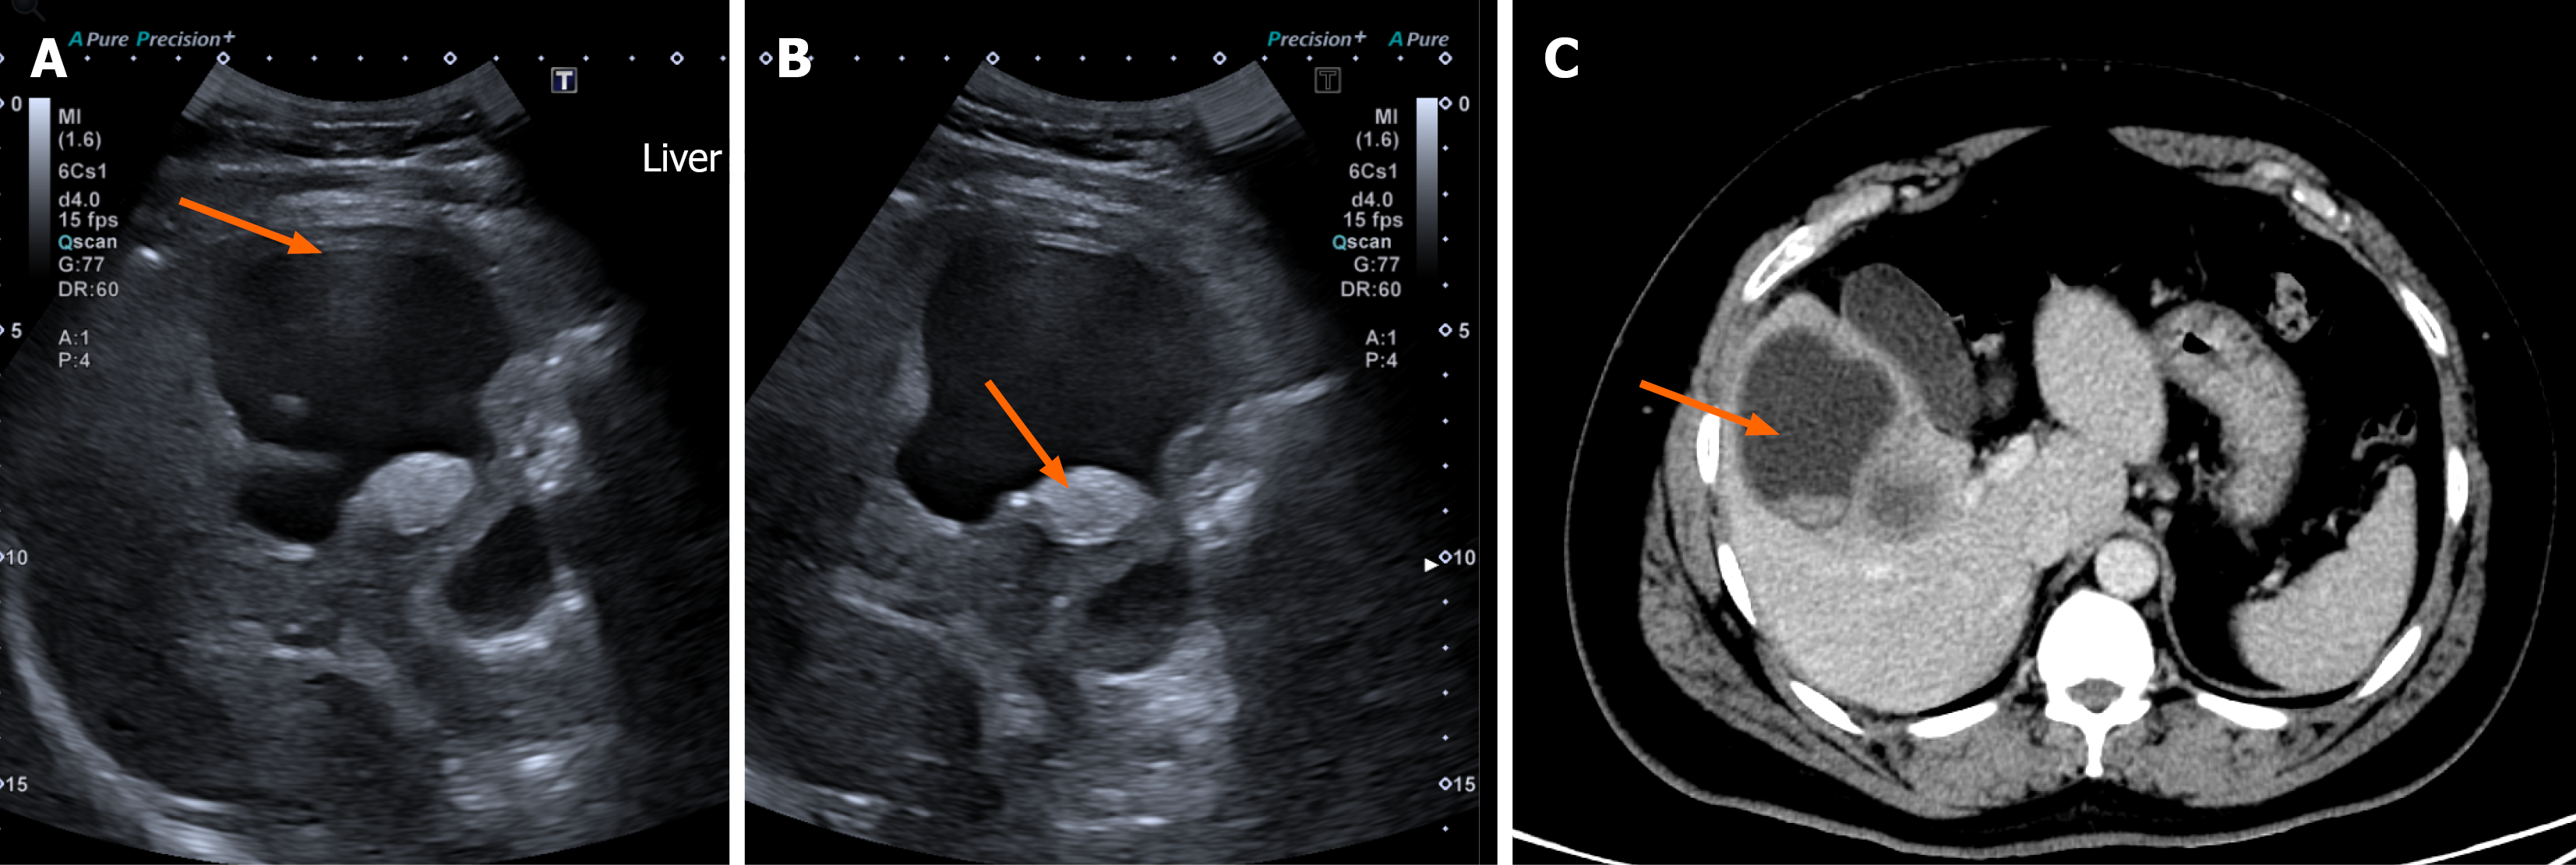
Figure 2 Cystic echinococcosis 1 hydatid cyst.
A and B: Ultrasound and images showing a lobulated cystic lesion in the right lobe of the liver with a well-defined wall (arrow in A) and an echogenic nodule at its base (arrow in B), most likely corresponding to cystic echinococcosis 1 with hydatid sand; C: Axial computed tomography image depicts a non-specific low-attenuation cyst (arrow) with subtle pseudo-enhancement, highlighting the superior sensitivity of ultrasound for characterization of early-stage disease.
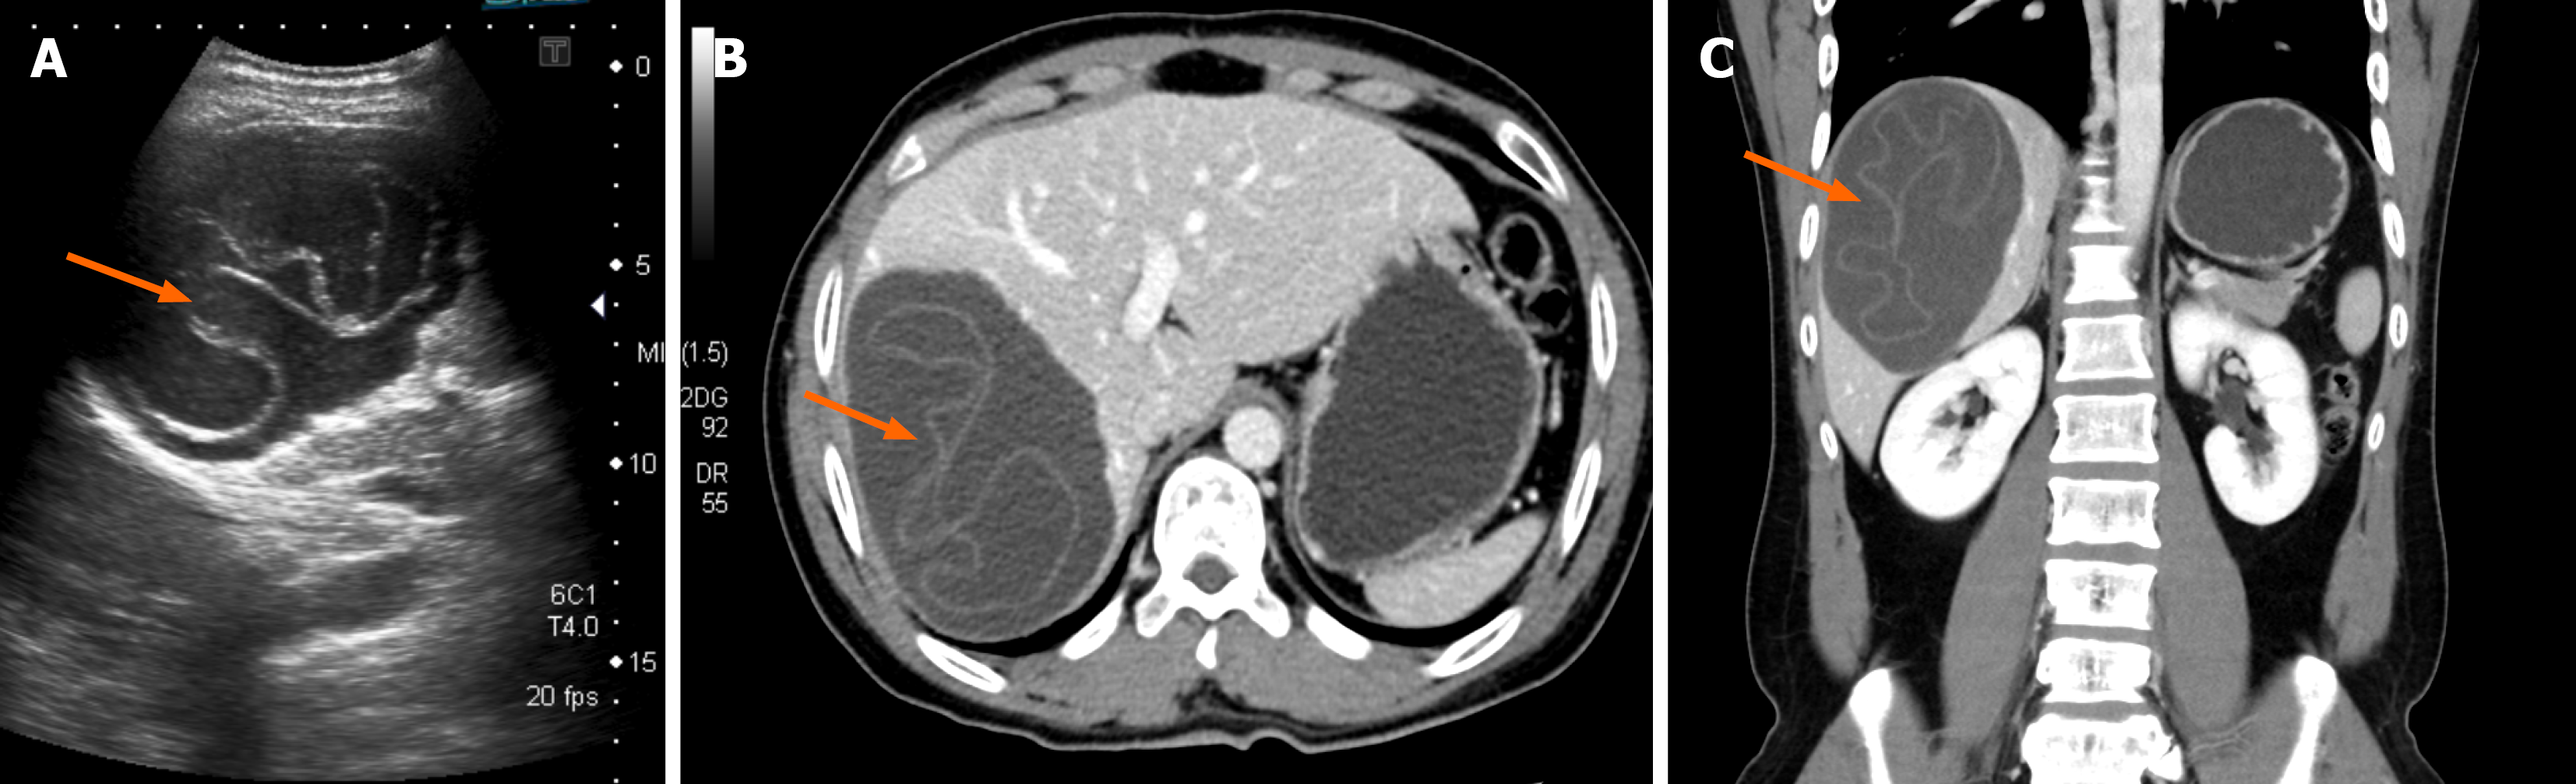
Figure 3 Cystic echinococcosis 3a hydatid cyst.
A-C: Ultrasound image, and axial and coronal computed tomography images revealing the characteristic water lily sign indicative of detached membranes of a cystic echinococcosis 3a hydatid cyst (arrows).
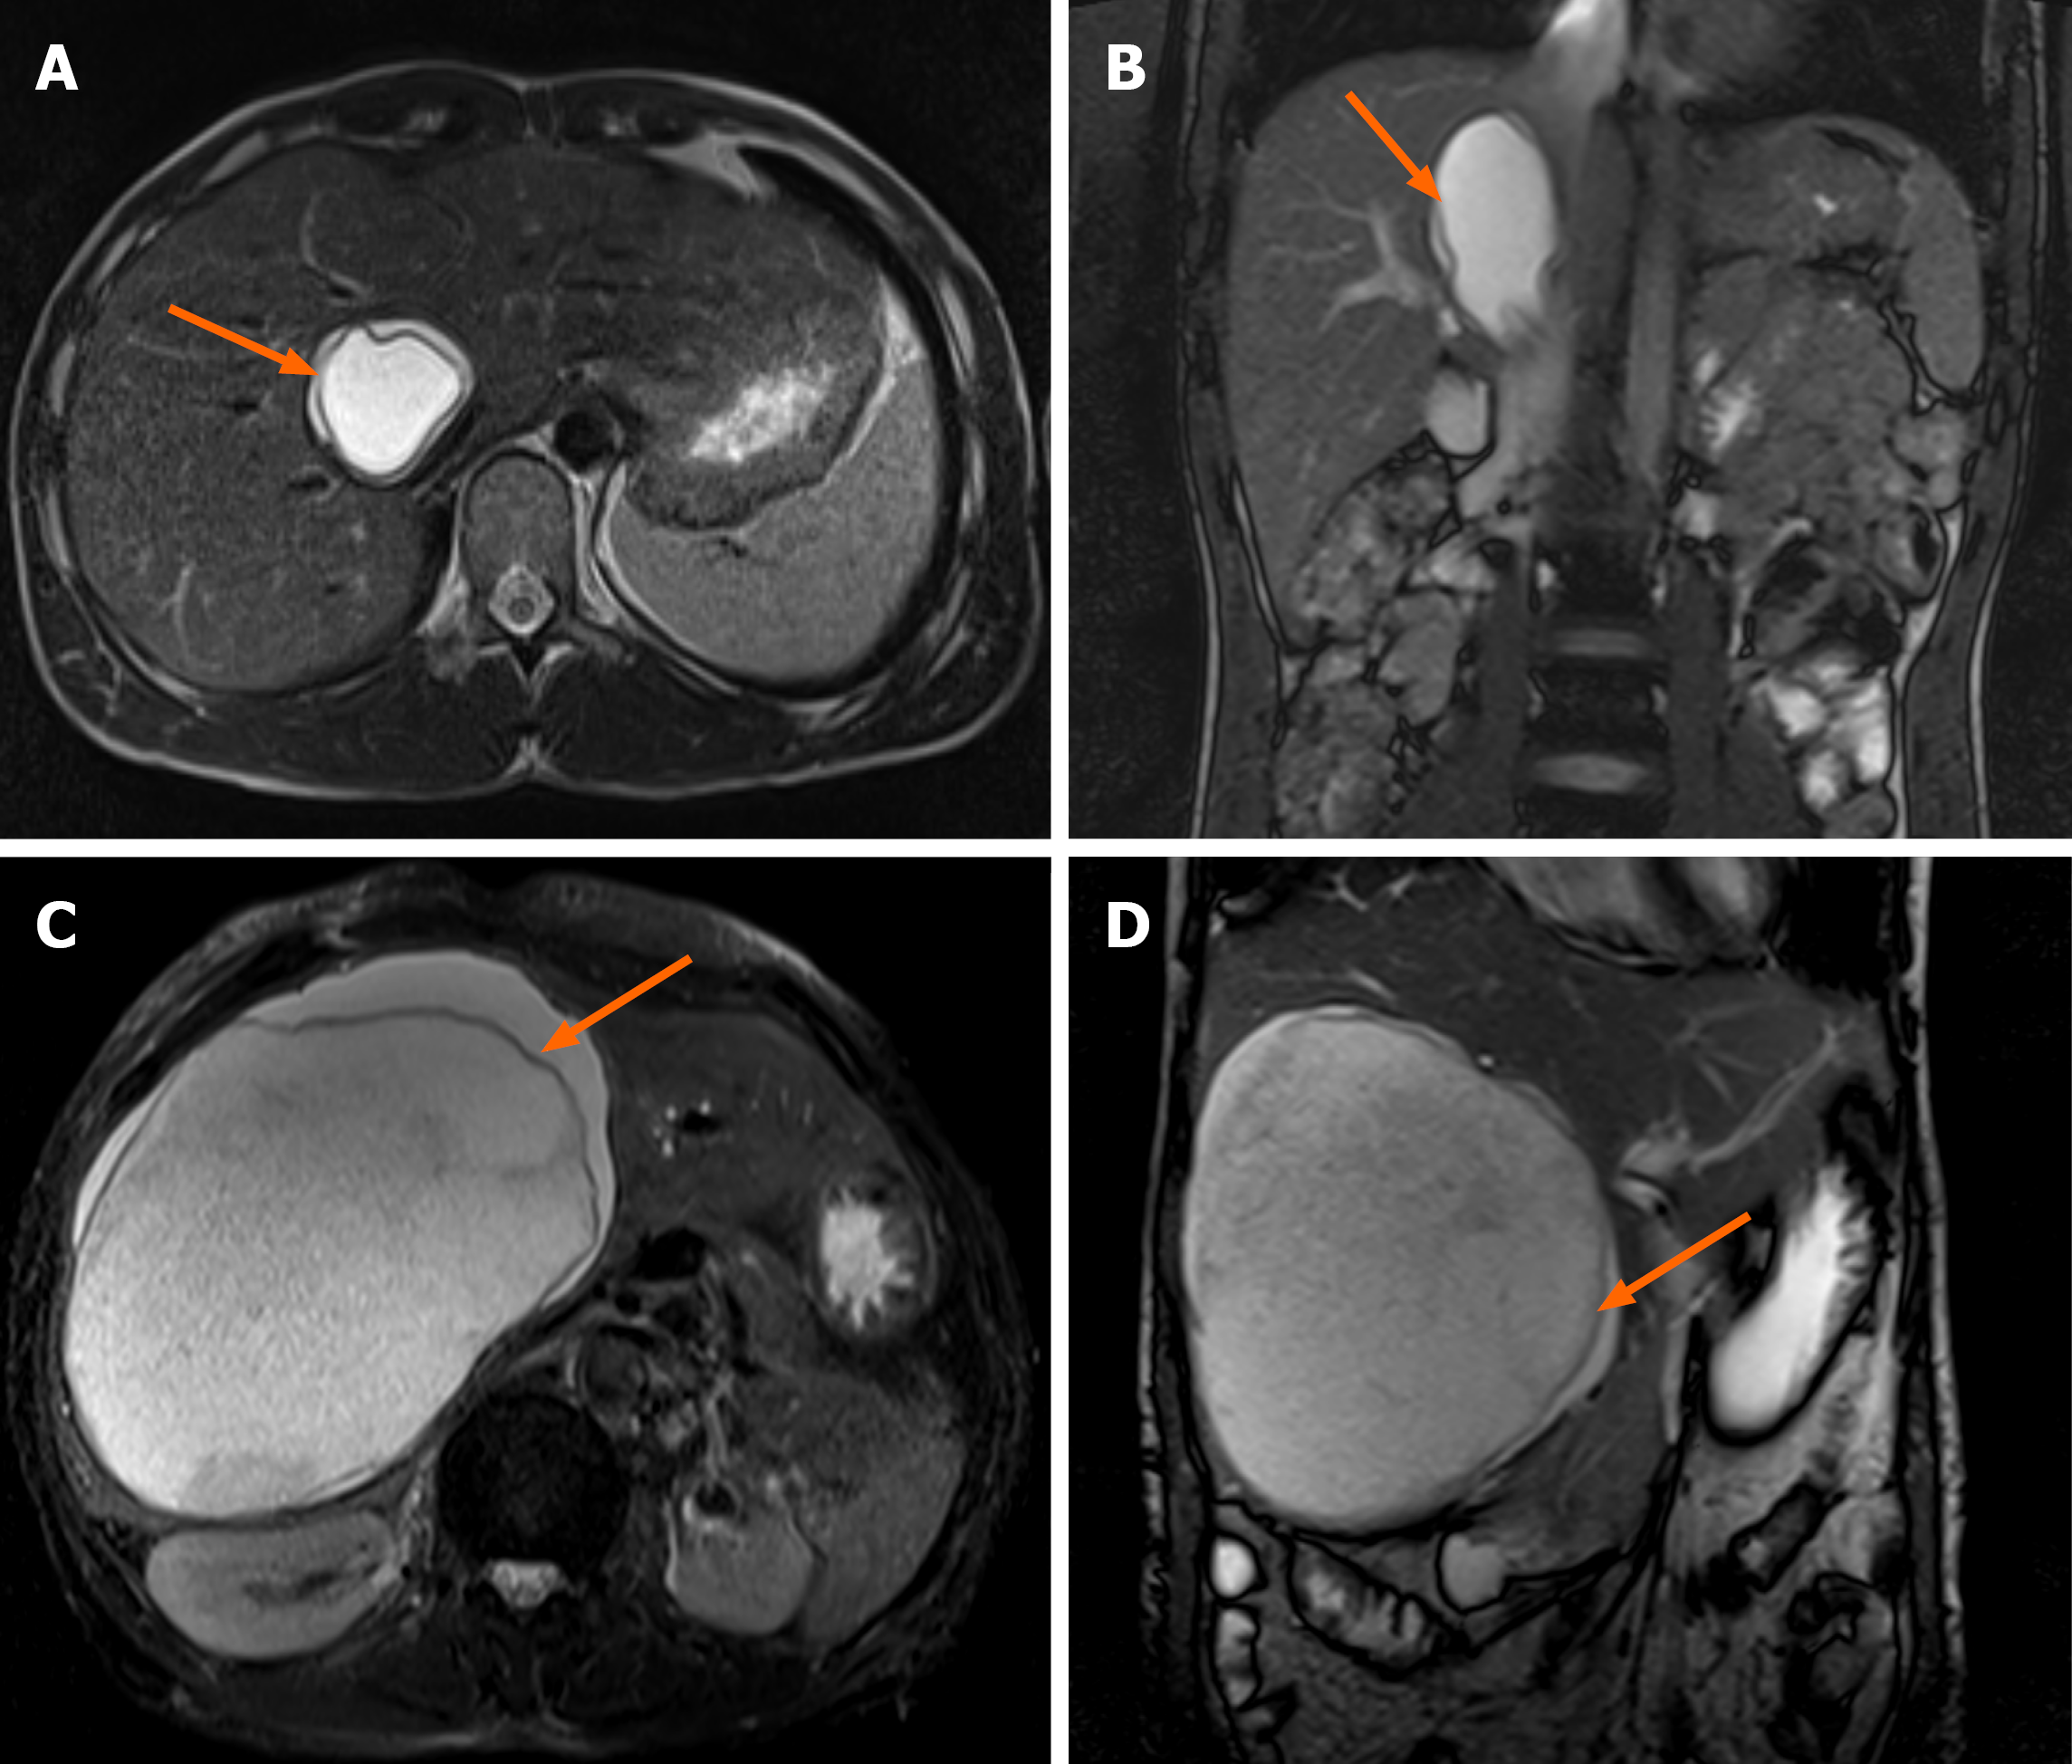
Figure 4 Magnetic resonance images of two patients with hepatic hydatid cysts.
A and B: Axial T2-weighted (A) and coronal T2-weighted (B) images showing the T2 hypointense endocyst (arrows) giving a “double line” sign; C and D: Axial T2-weighted (C) and coronal T2-weighted image (D) from another patient with a large hydatid cyst in the right lobe of the liver showing the double line sign (arrows) and heterogeneous central T2 signal intensity.
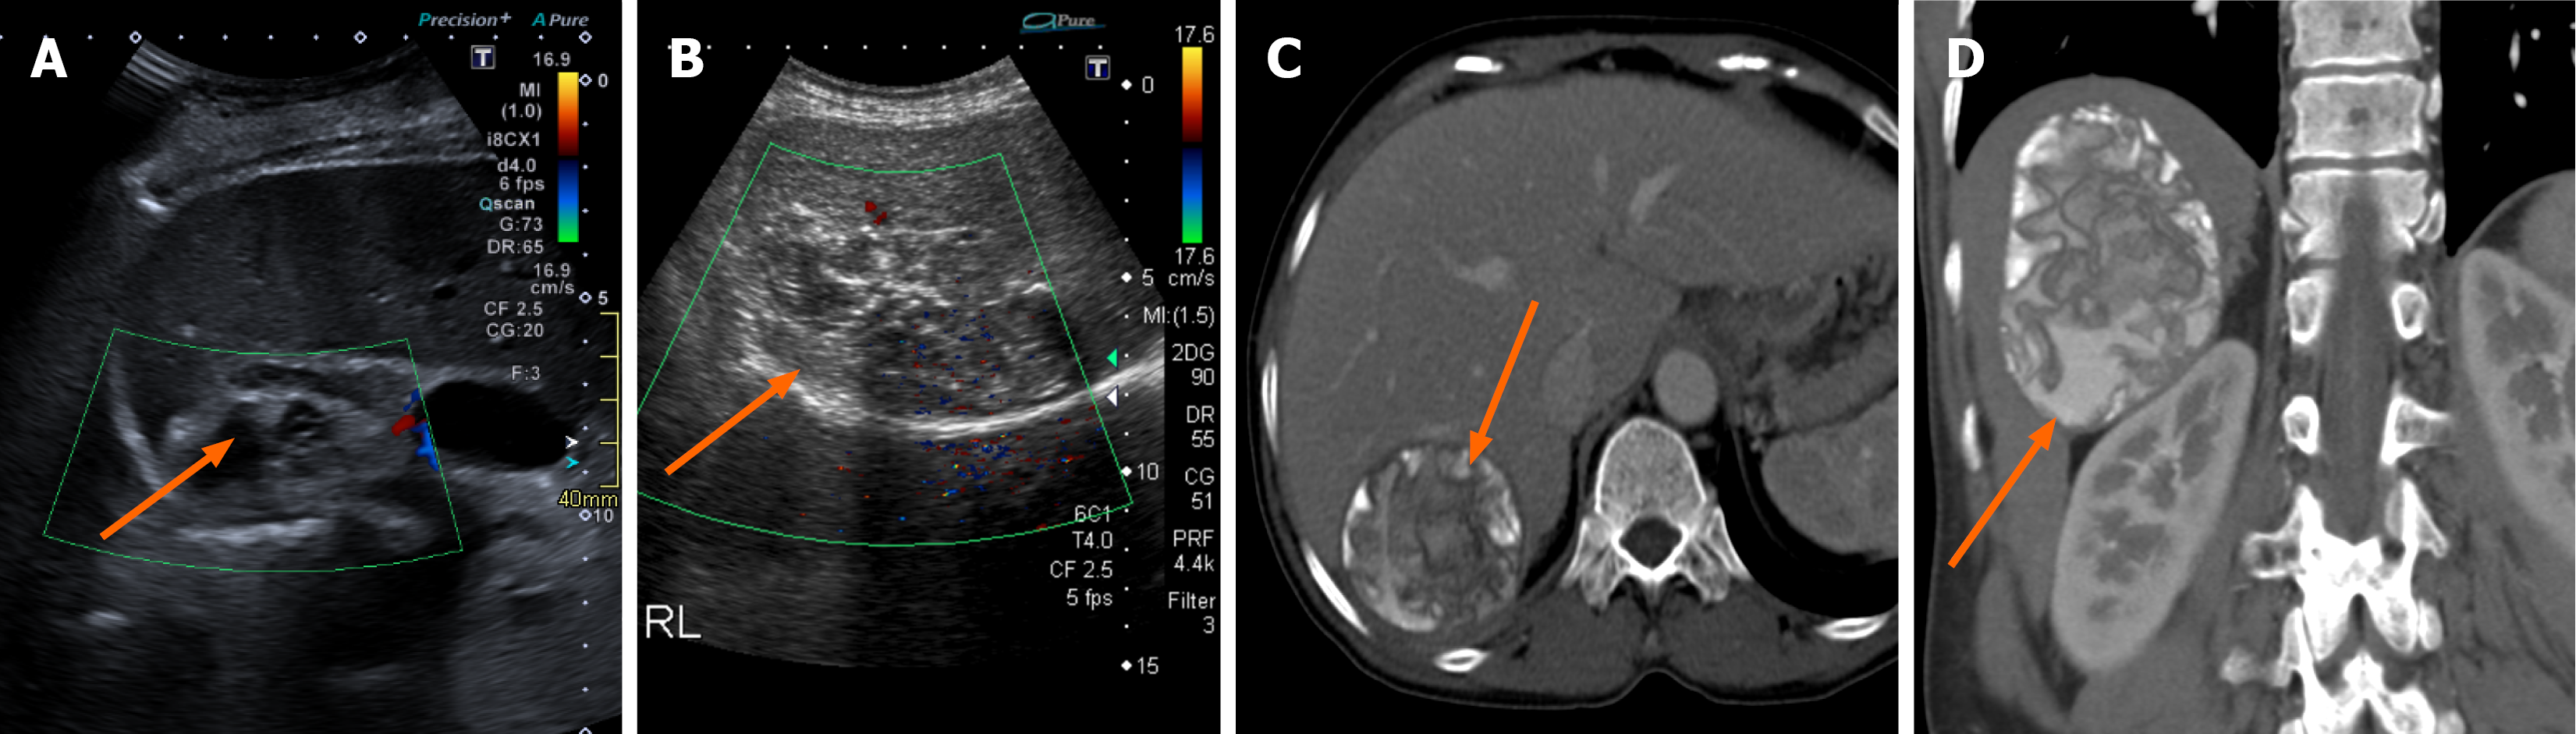
Figure 5 Cystic echinococcosis 4 hydatid cysts.
A and B: Ultrasound images from two different patients showing a cystic echinococcosis 4 degenerative hydatid cyst in the right lobe of the liver (arrows) with a heterogeneous appearance on ultrasound with mixed echoes and no definite daughter vesicles; C and D: Axial (C) and coronal (D) images reveal the characteristic cystic echinococcosis 4 hydatid cyst with crumpled membranes and calcifications (arrows).
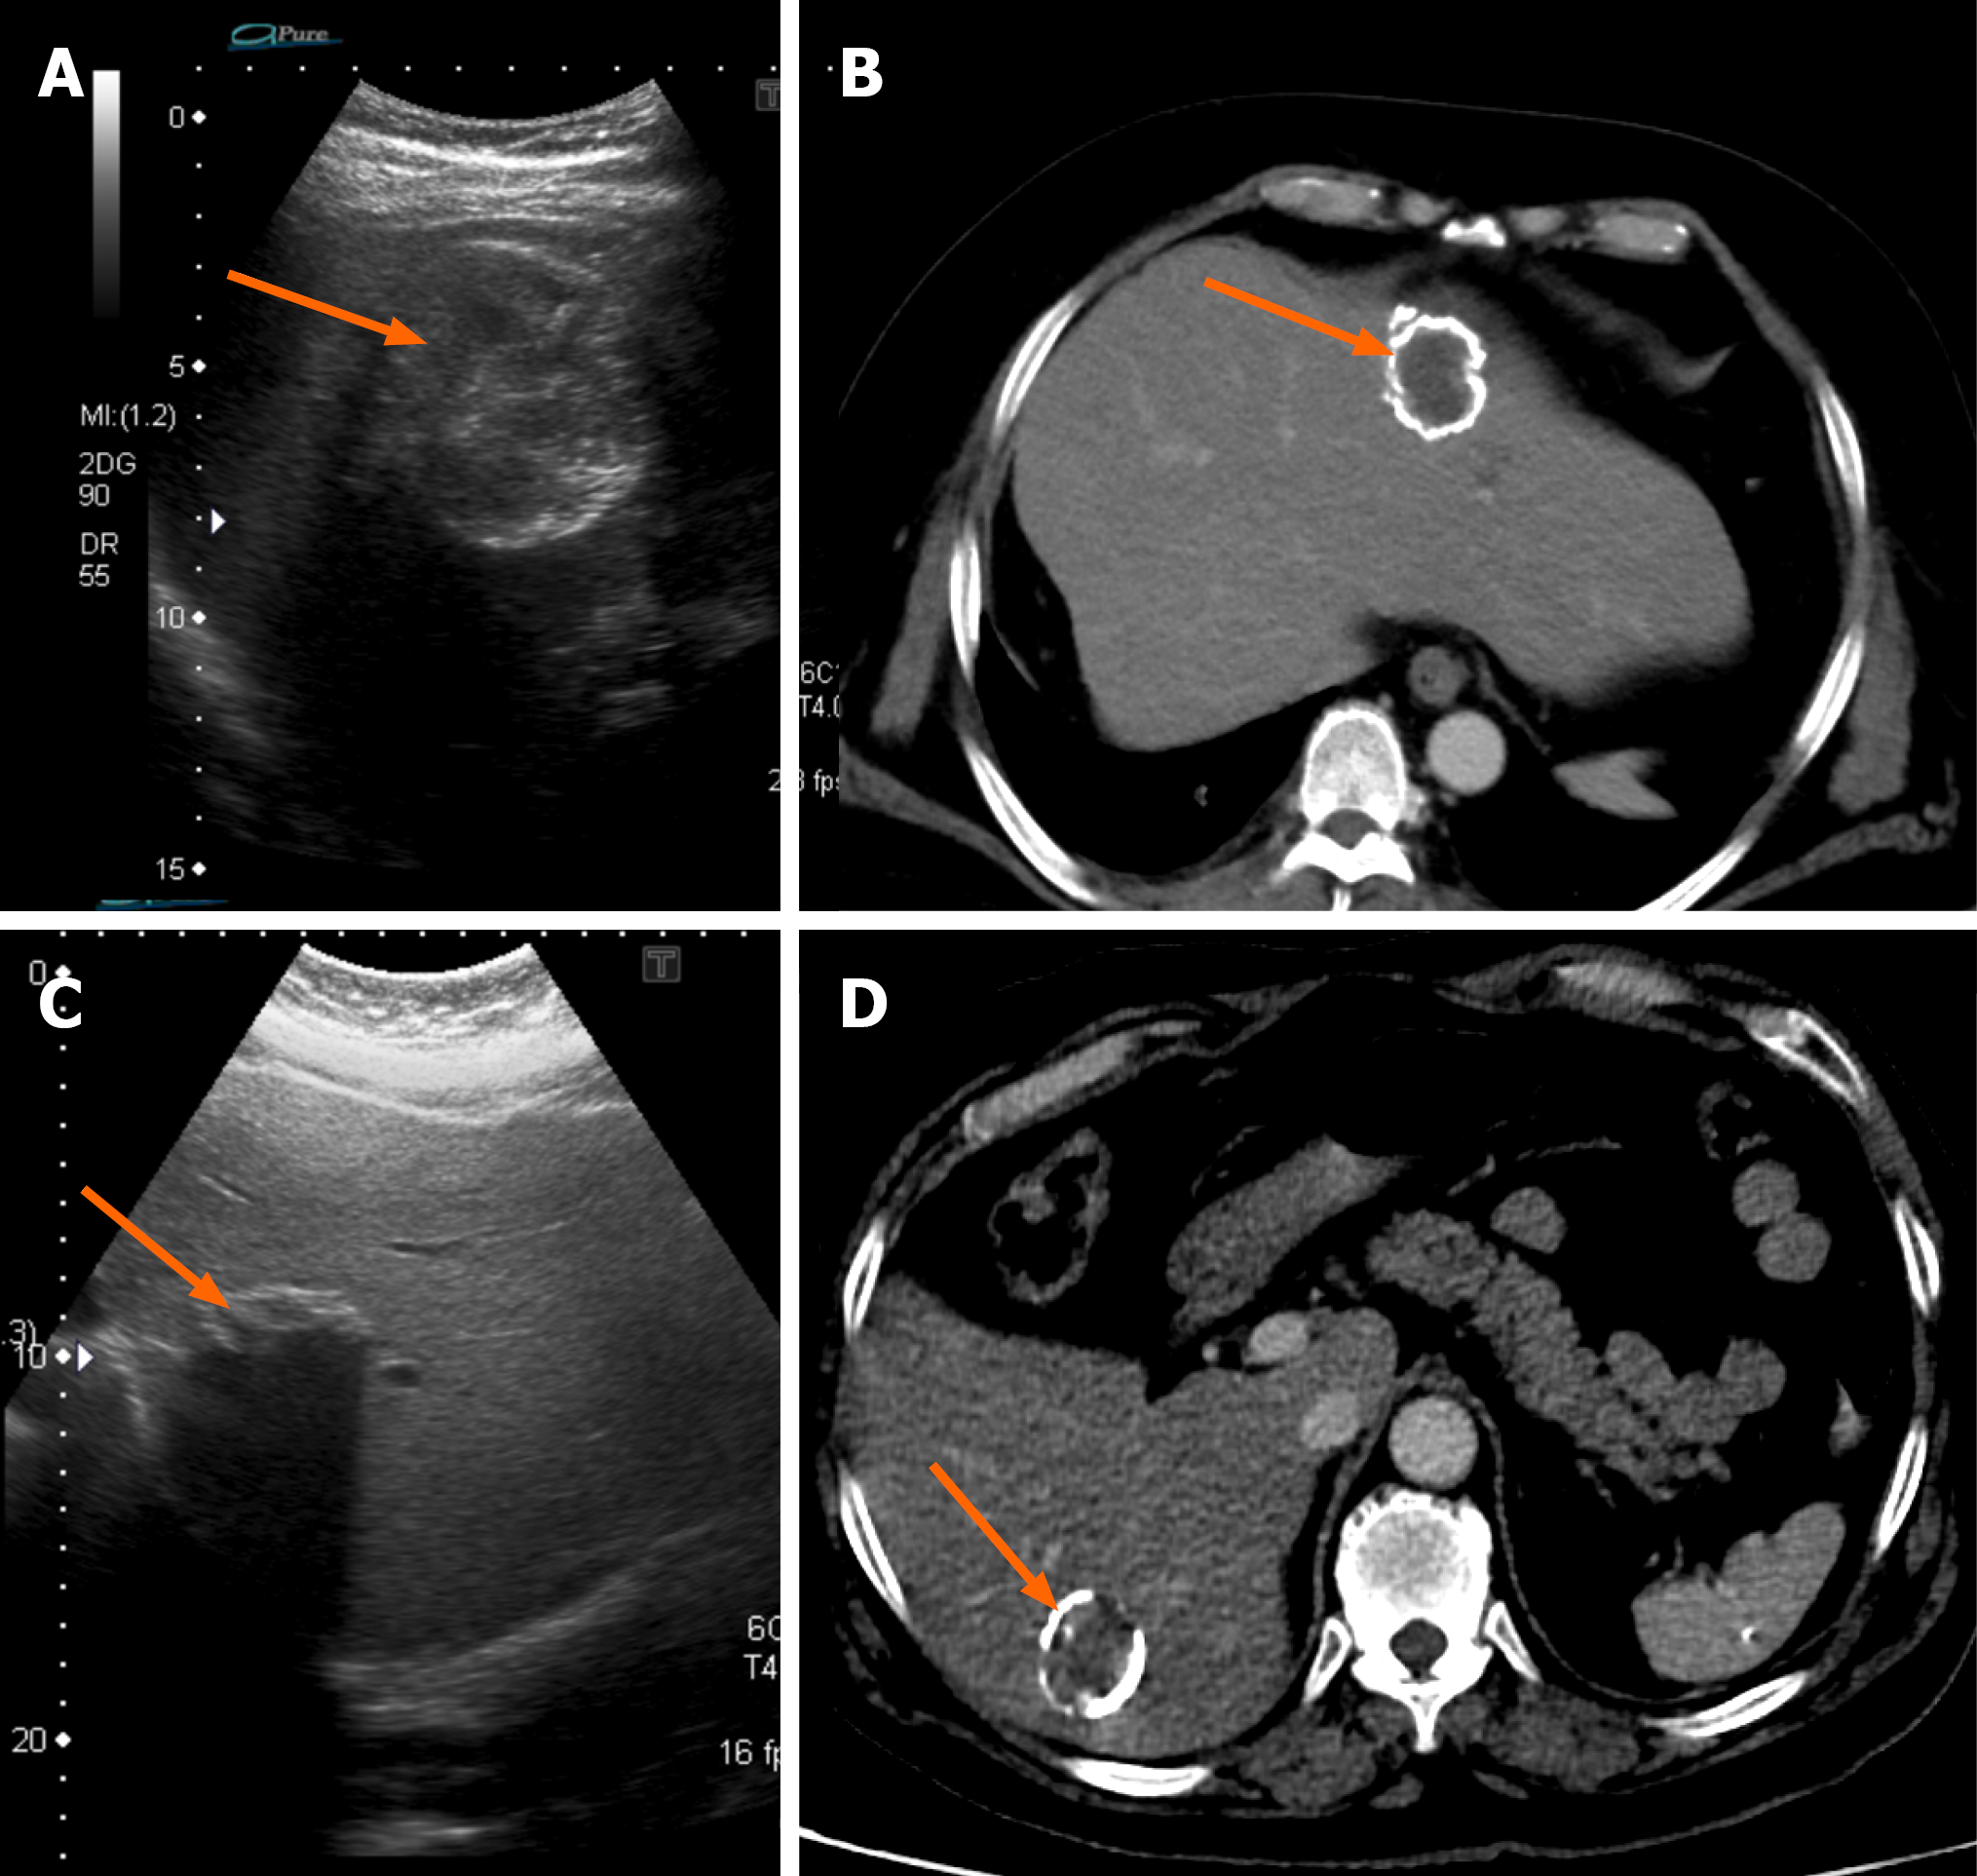
Figure 6 Cystic echinococcosis 5 hydatid cyst disease.
A: Ultrasound image showing a cystic echinococcosis 5 hydatid cyst with dense peripheral calci
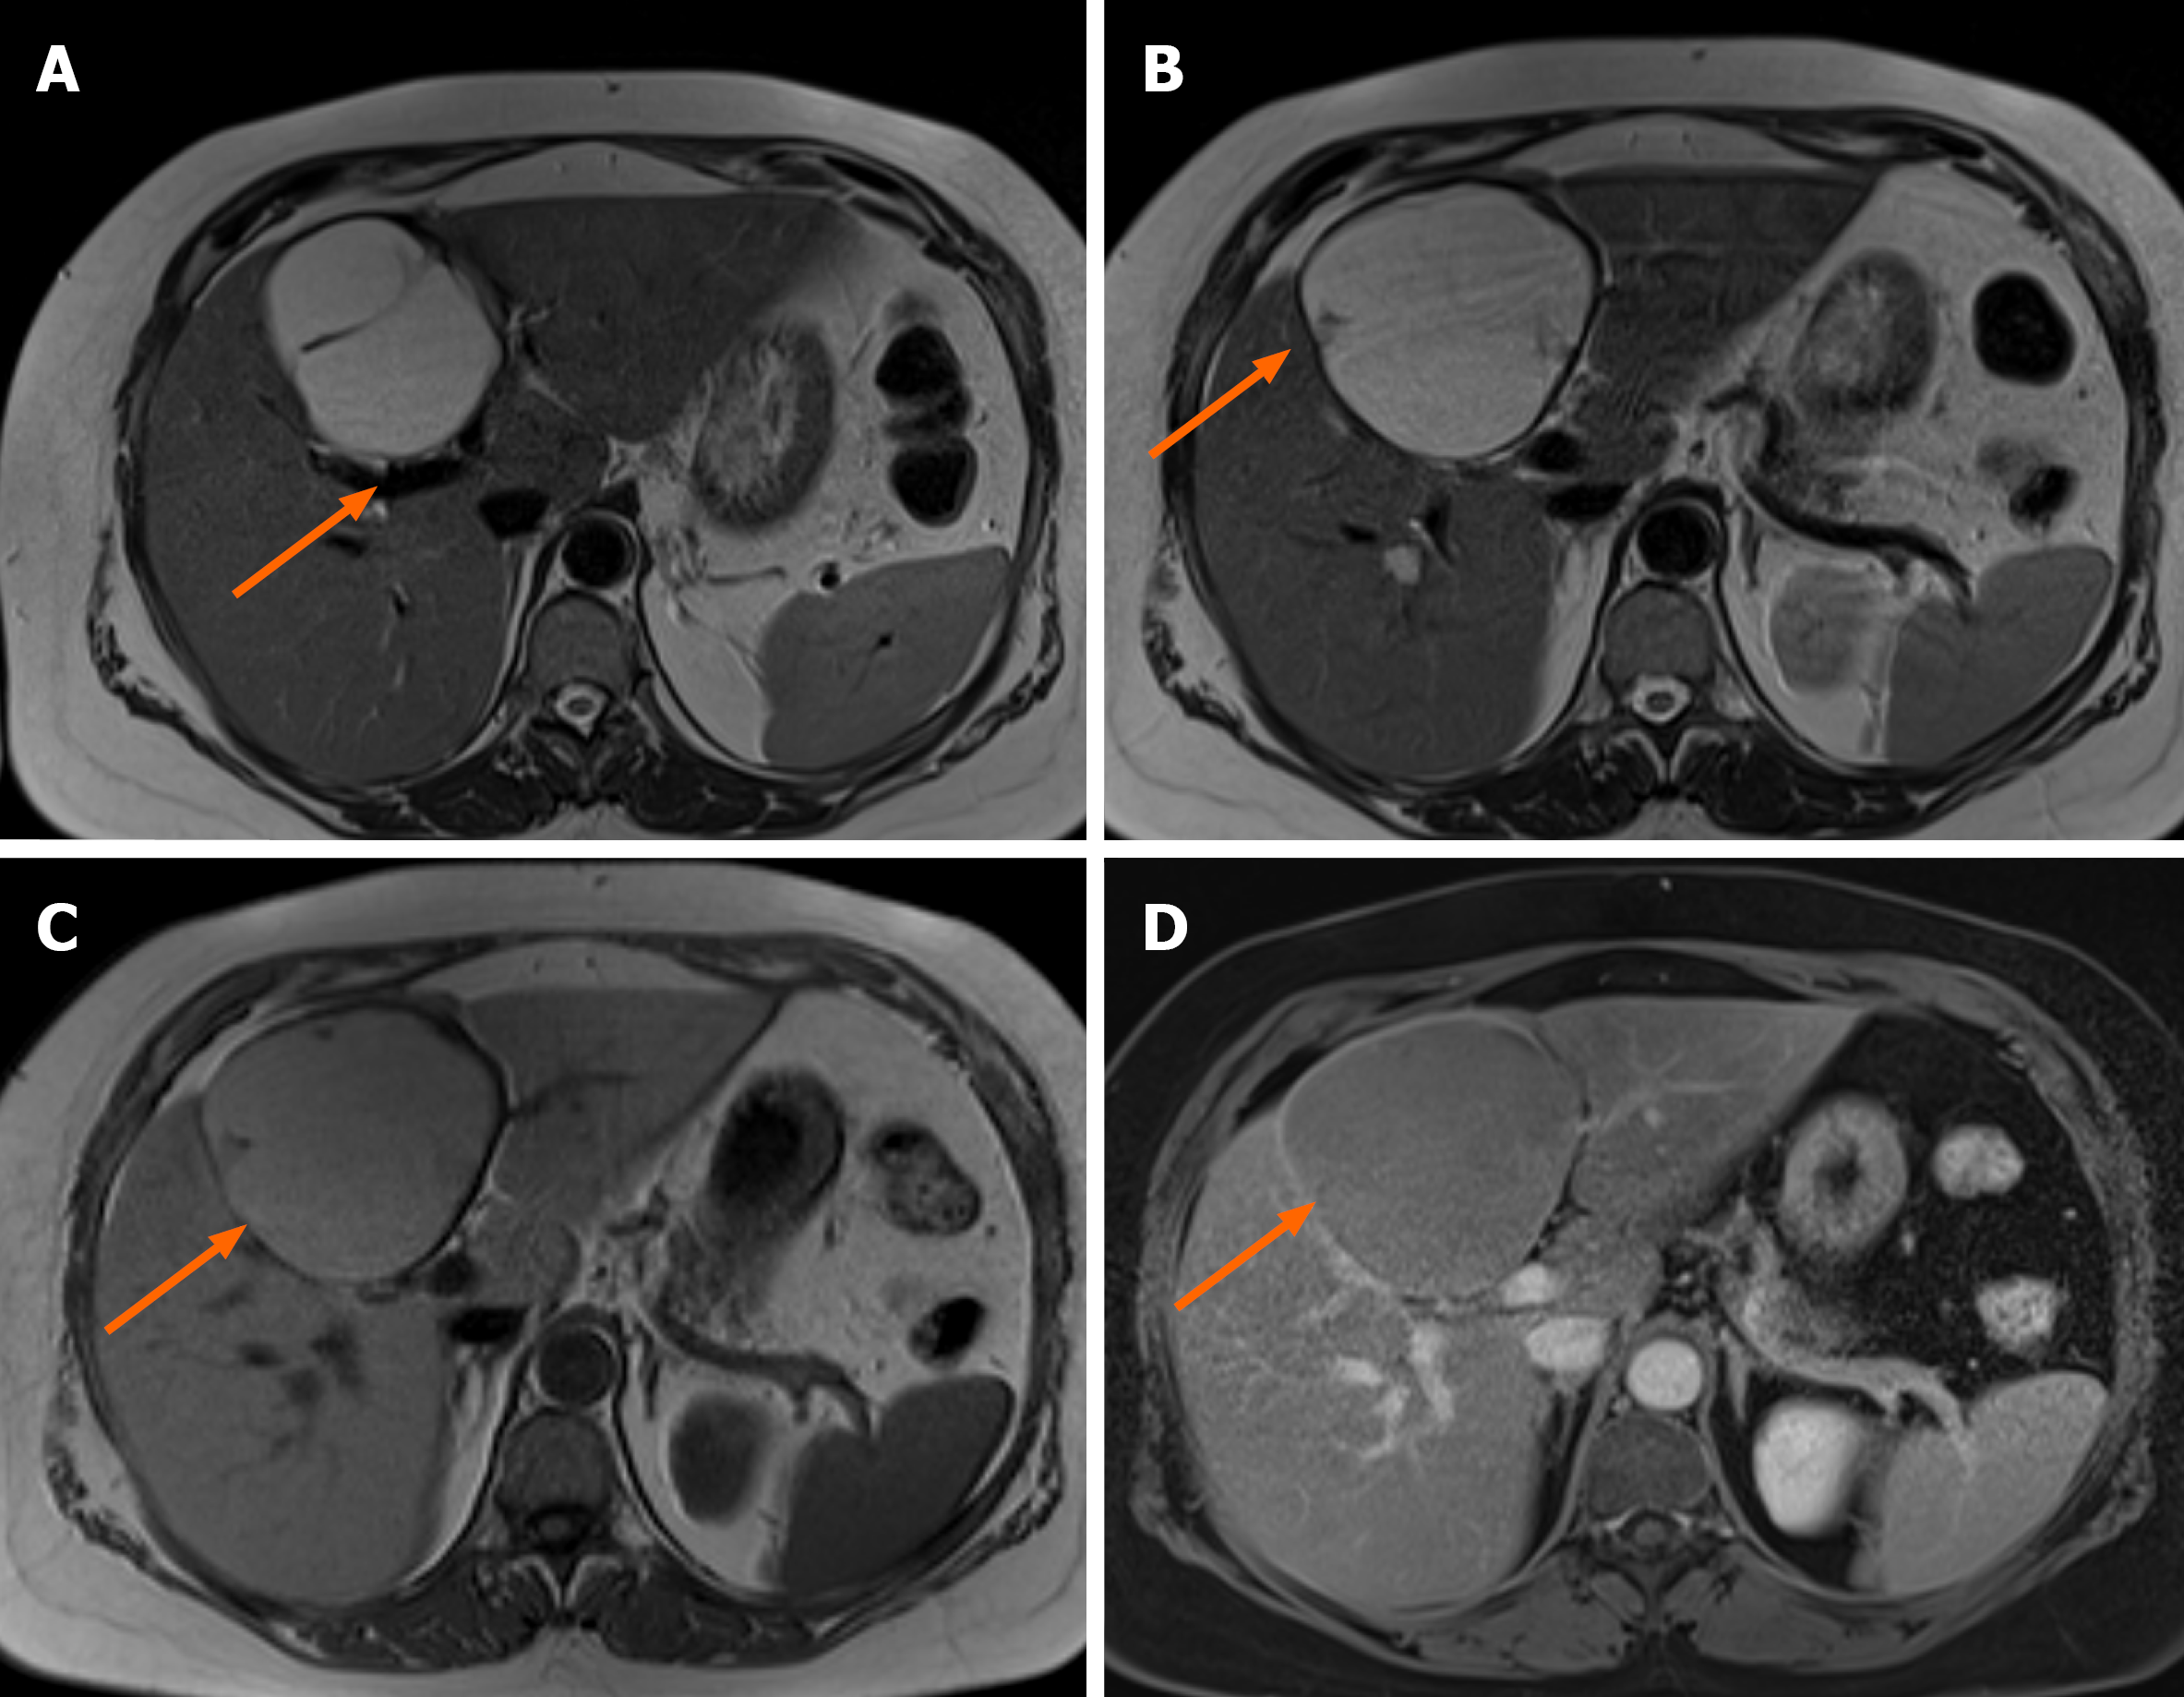
Figure 7 Magnetic resonance images showing mass effect of a hydatid cyst on the portal vein.
A and B: Axial T2-weighted images showing a cystic lesion in the liver compressing the bifurcation of the intrahepatic portal vein (arrow in A). The cyst has a T2 hypointense rim (arrow in B); C and D: Axial T1 pre-contrast (C) and axial T1 post-contrast (D) images show some T1 hyperintensity within the cyst (arrow in C) with mild pericystic enhancement (arrow in D).
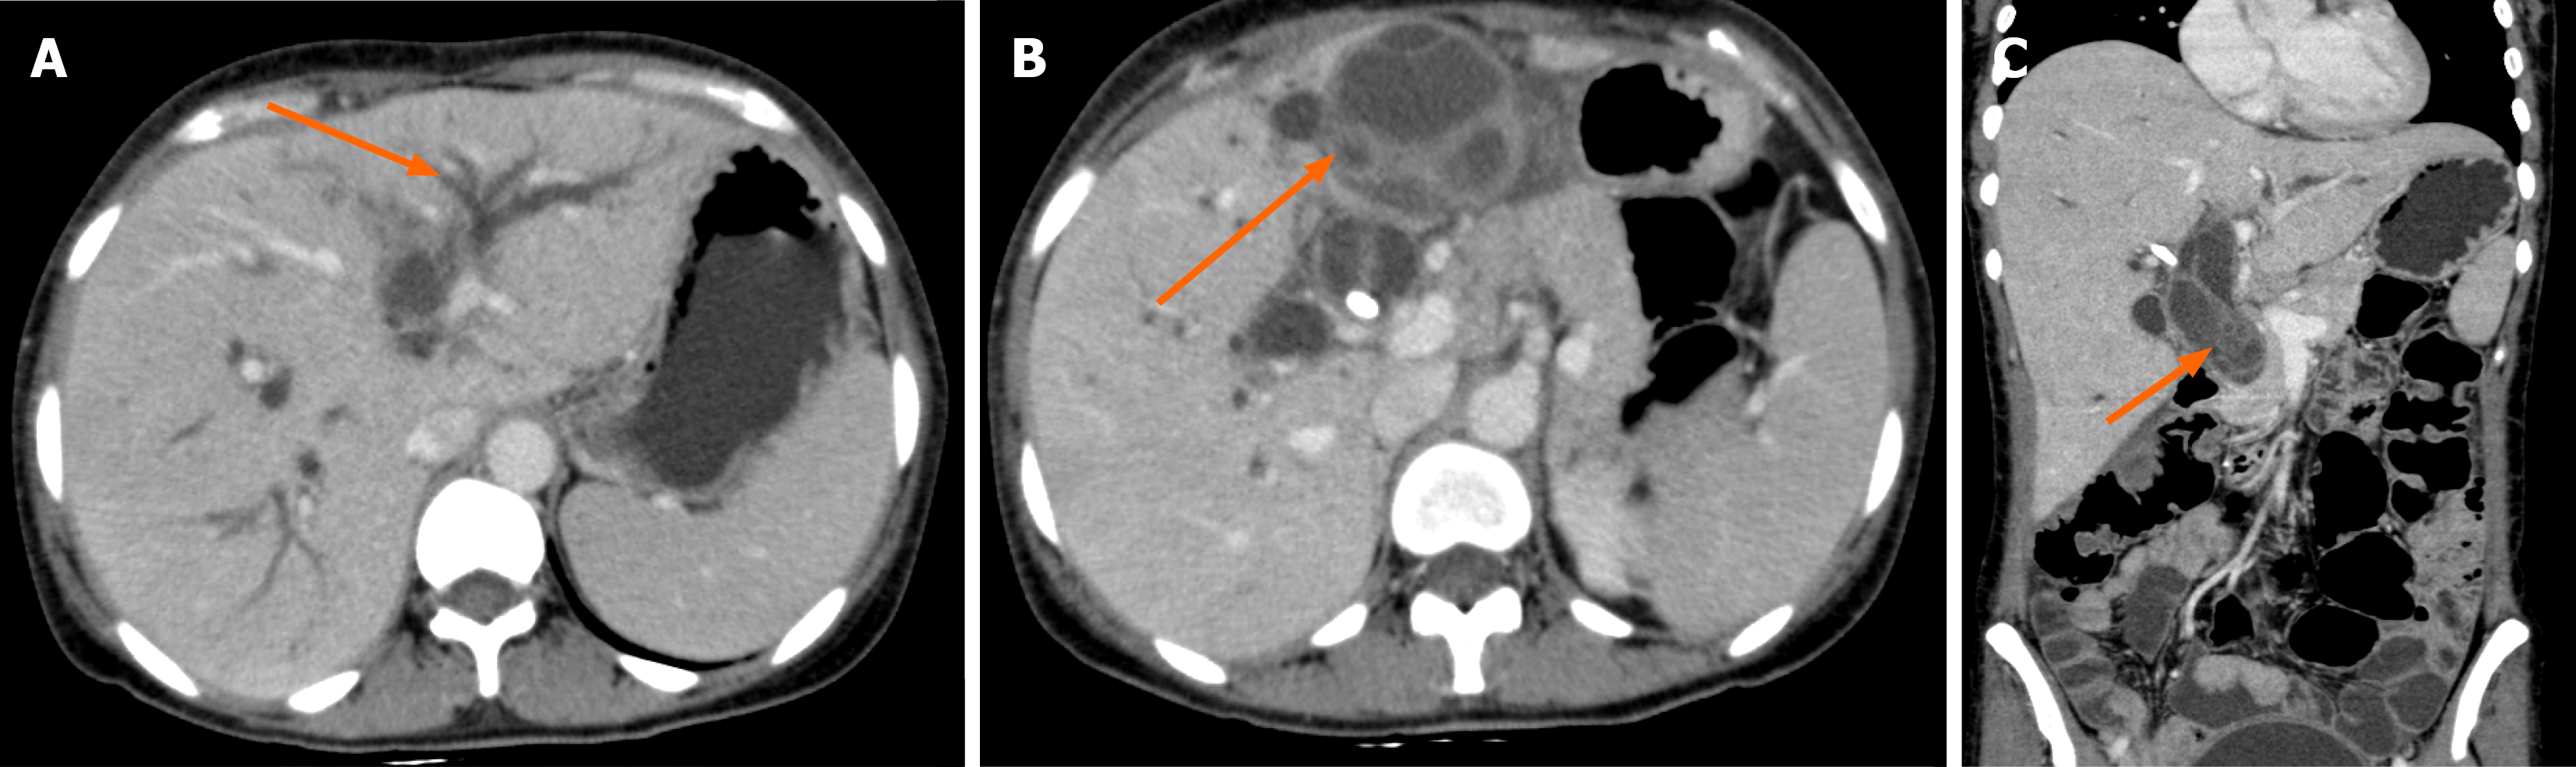
Figure 8 Computed tomography images of a patient with biliary hydatid disease.
A: Axial computed tomography (CT) image showing moderate intrahepatic biliary dilatation (arrow); B: Axial CT image shows at least three well-defined cystic lesions present in the liver and porta hepatis (arrow), consistent with hydatid cysts; C: Coronal CT image shows extension of hydatid disease into the common bile duct, likely due to biliary rupture with extrahepatic biliary dilatation (arrow).
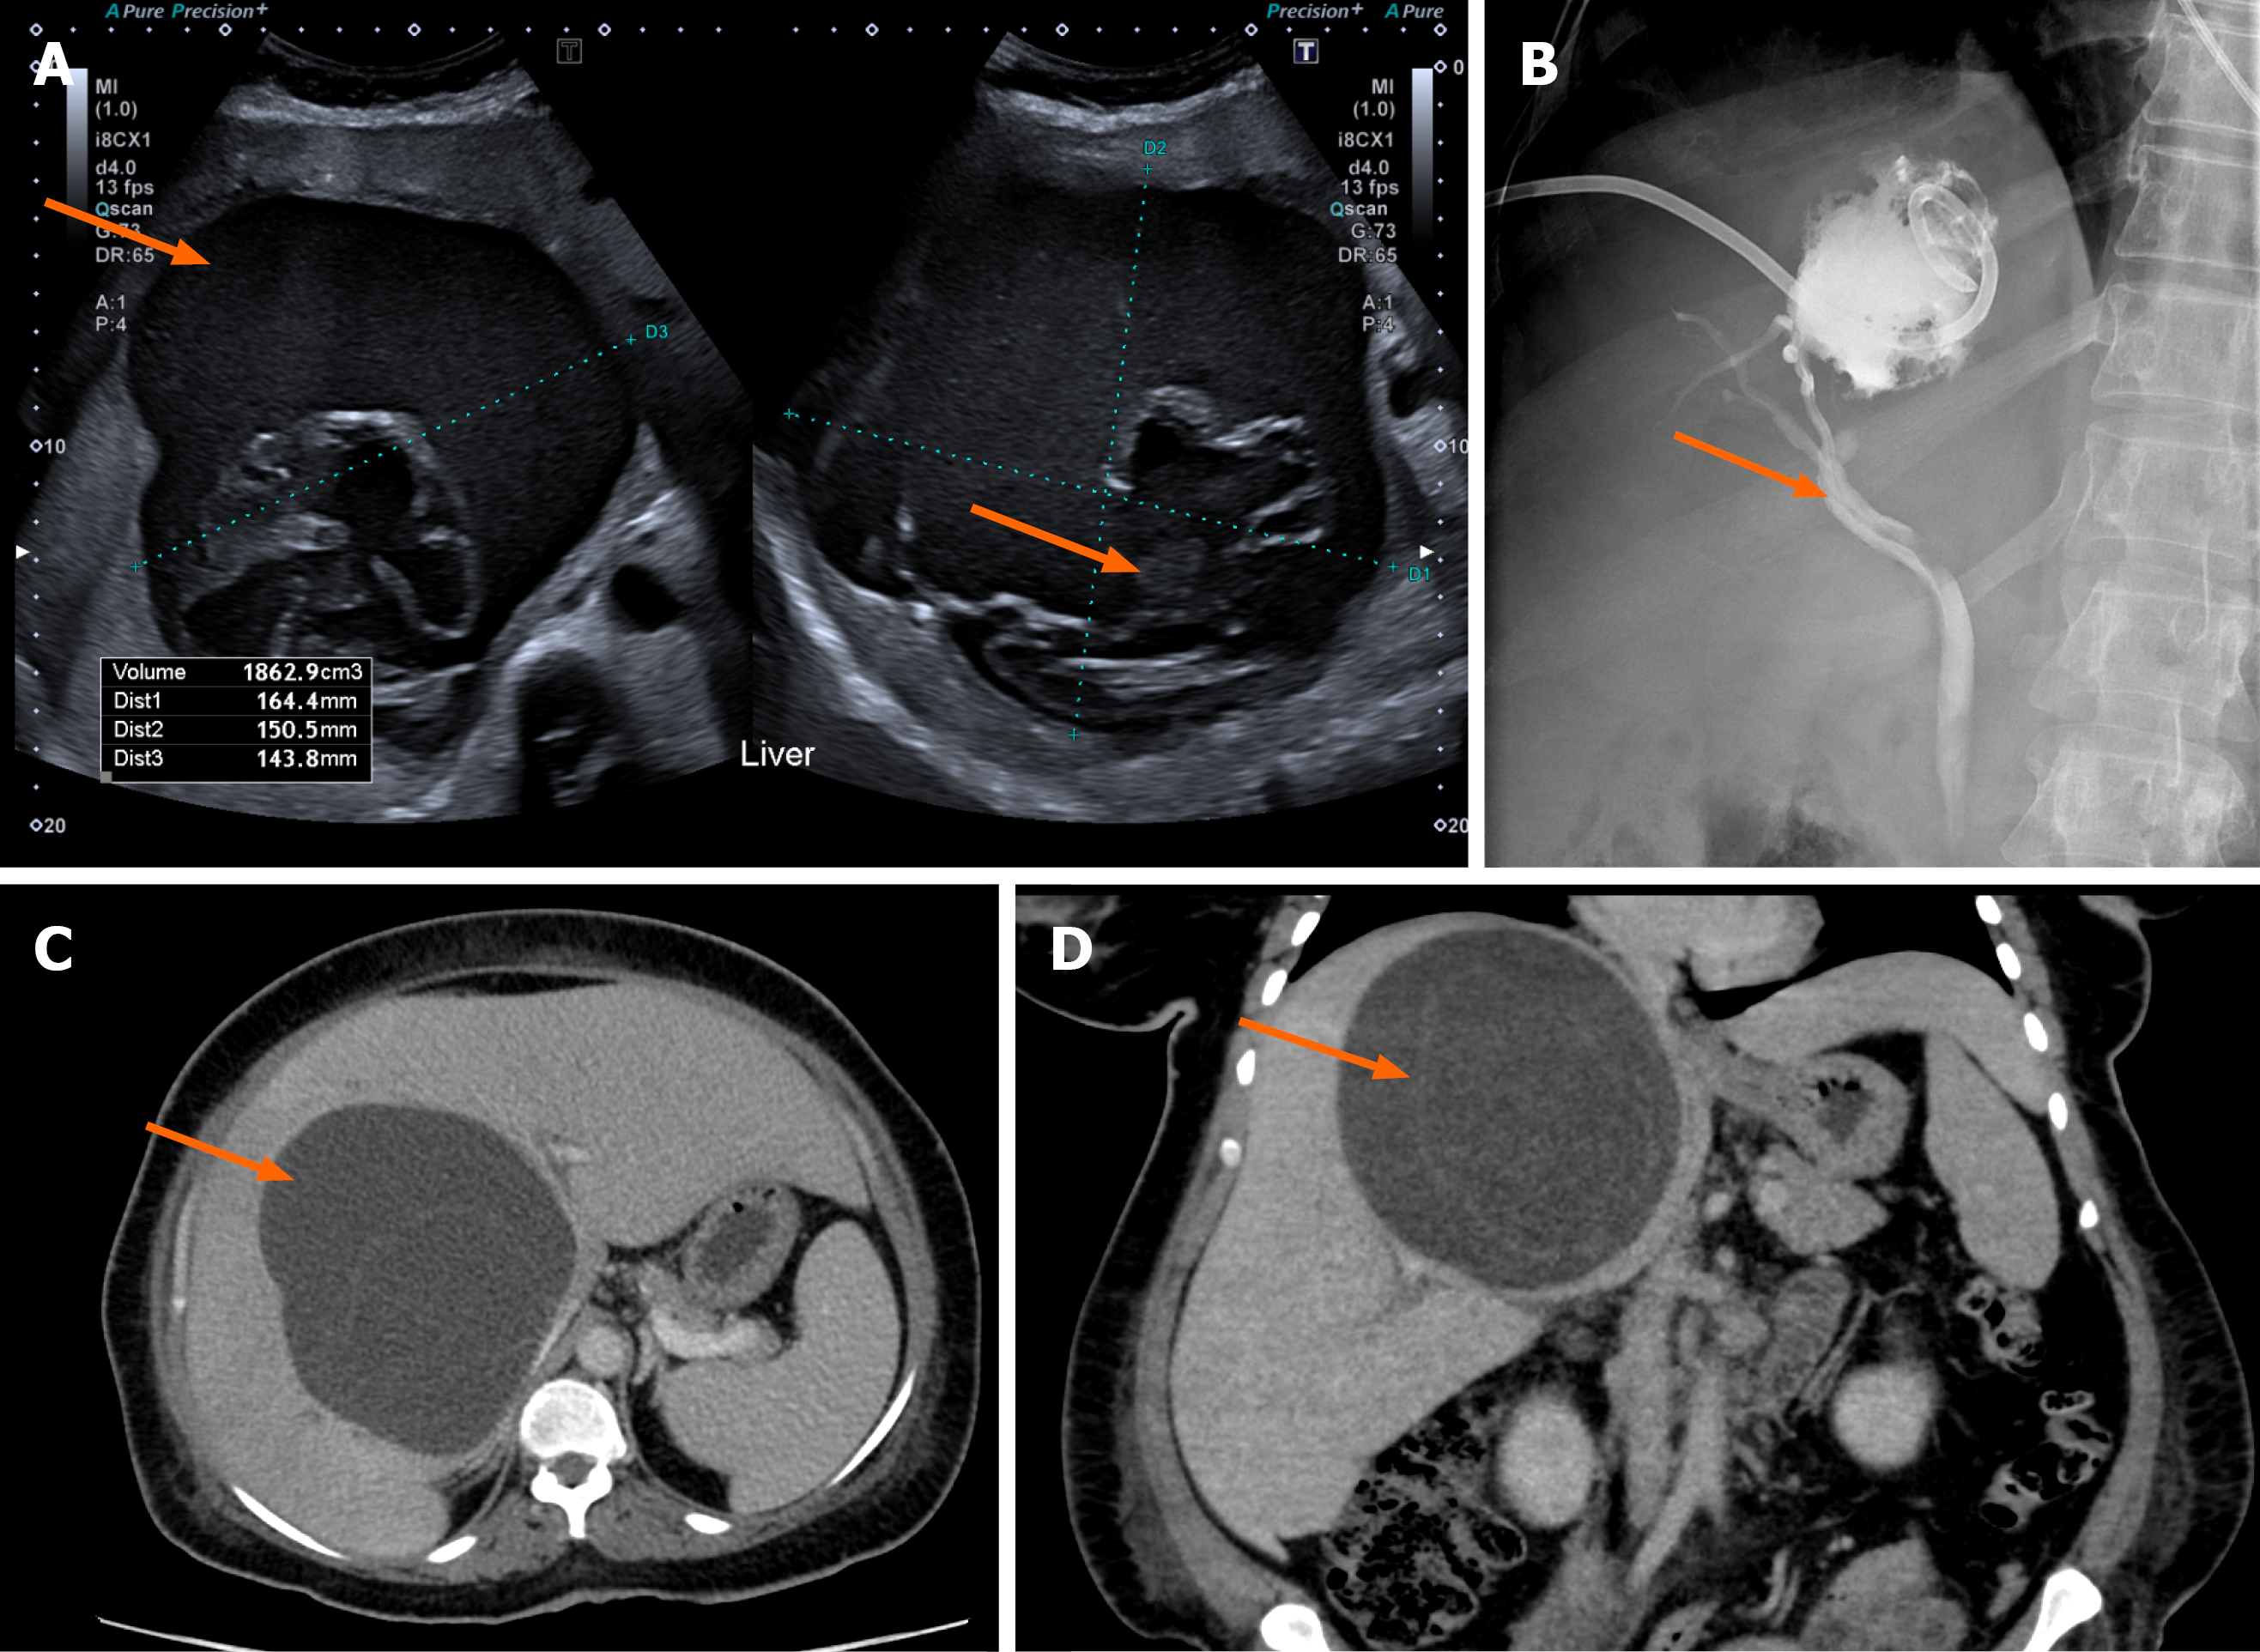
Figure 9 Biliary complications of hydatid cyst.
A: Ultrasound images show a large characteristic case of cystic echinococcosis 3a hydatid cyst disease with internal floating membranes (arrows); B: A fluoroscopic exam performed after catheter placement and the percutaneous aspiration injection and reaspiration procedure shows opacification of the biliary tree, suggesting a fistula with biliary communication (arrow); C: Axial computed tomography image shows a large cyst in the right lobe of the liver (arrow); D: Coronal computed tomography image showing floating internal membranes within the cyst (arrow).
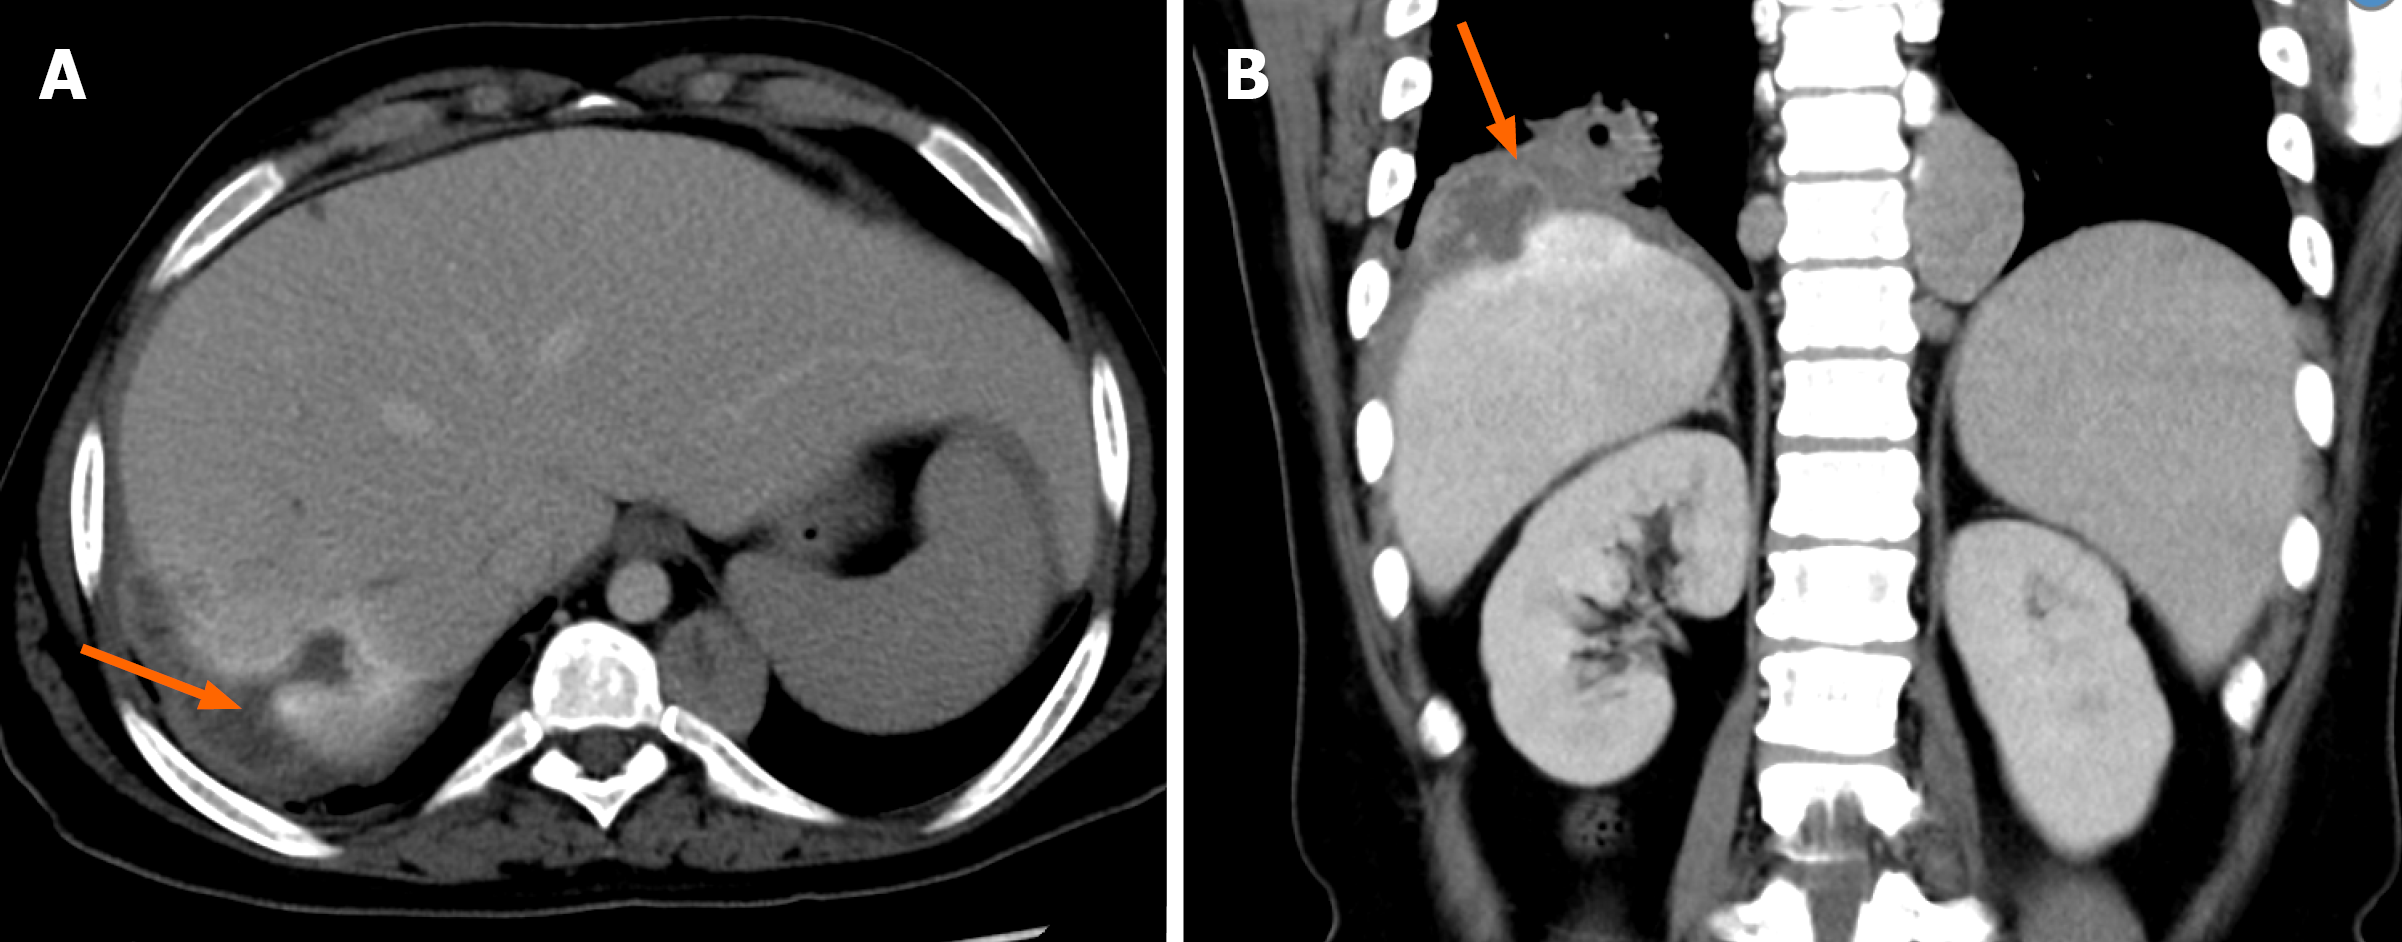
Figure 10 Hydatid cyst disease with rupture and transdiaphragmatic spread.
A and B: Axial computed tomography (A) and coronal computed tomography (B) images showing subcapsular rupture of hydatid disease in the right lobe of the liver involving segment VII (arrow in A) with transdiaphragmatic extension into the ipsilateral right thoracic cavity (arrow in B).
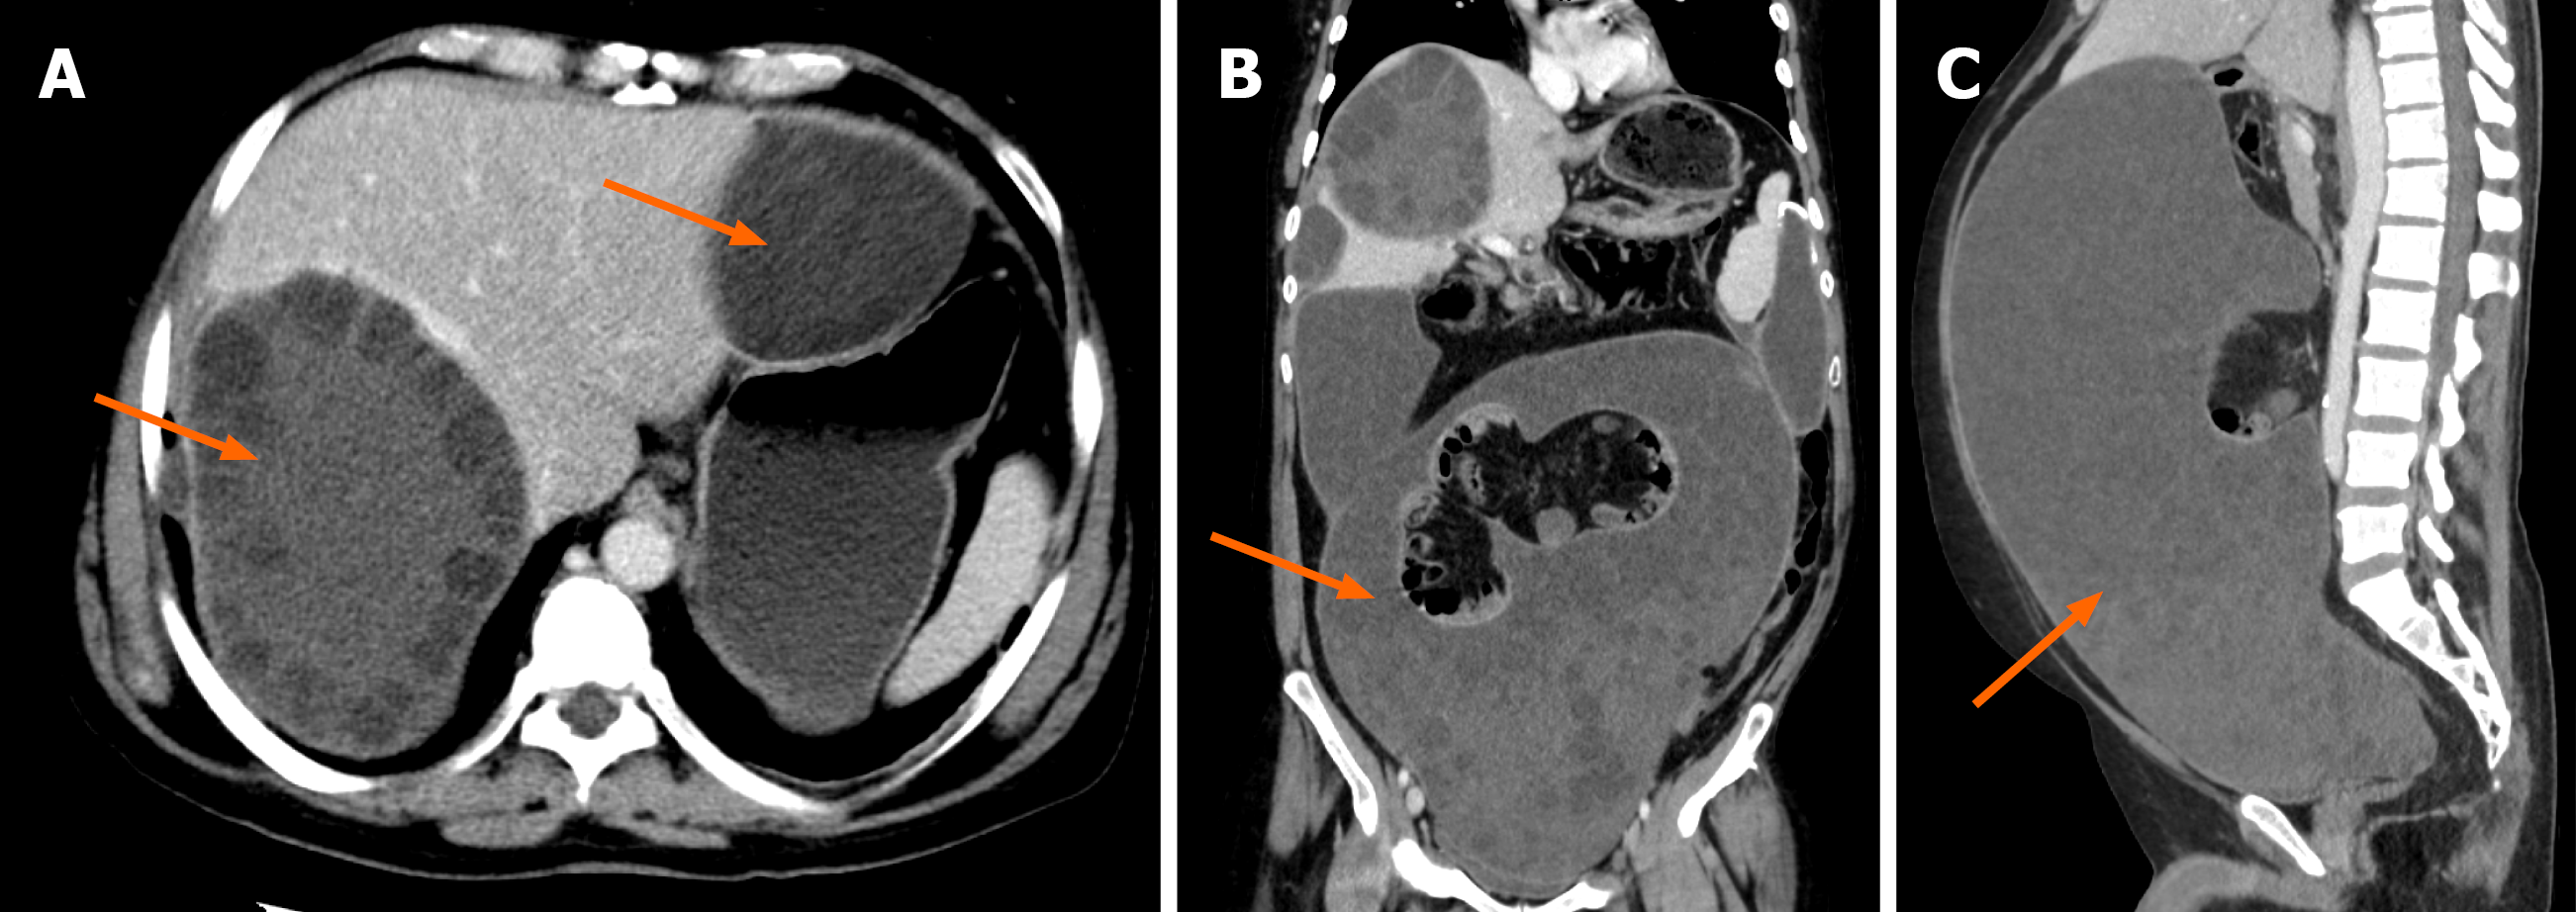
Figure 11 Hydatid cyst disease with intraperitoneal dissemination.
A-C: Axial, coronal and sagittal computed tomography images showing at least two hydatid cysts with daughter cysts with a typical rosette appearance in the left and right lobes of the liver (arrows in A). Coronal and sagittal sections show diffuse dissemination of hydatid disease into the peritoneum (B and C).
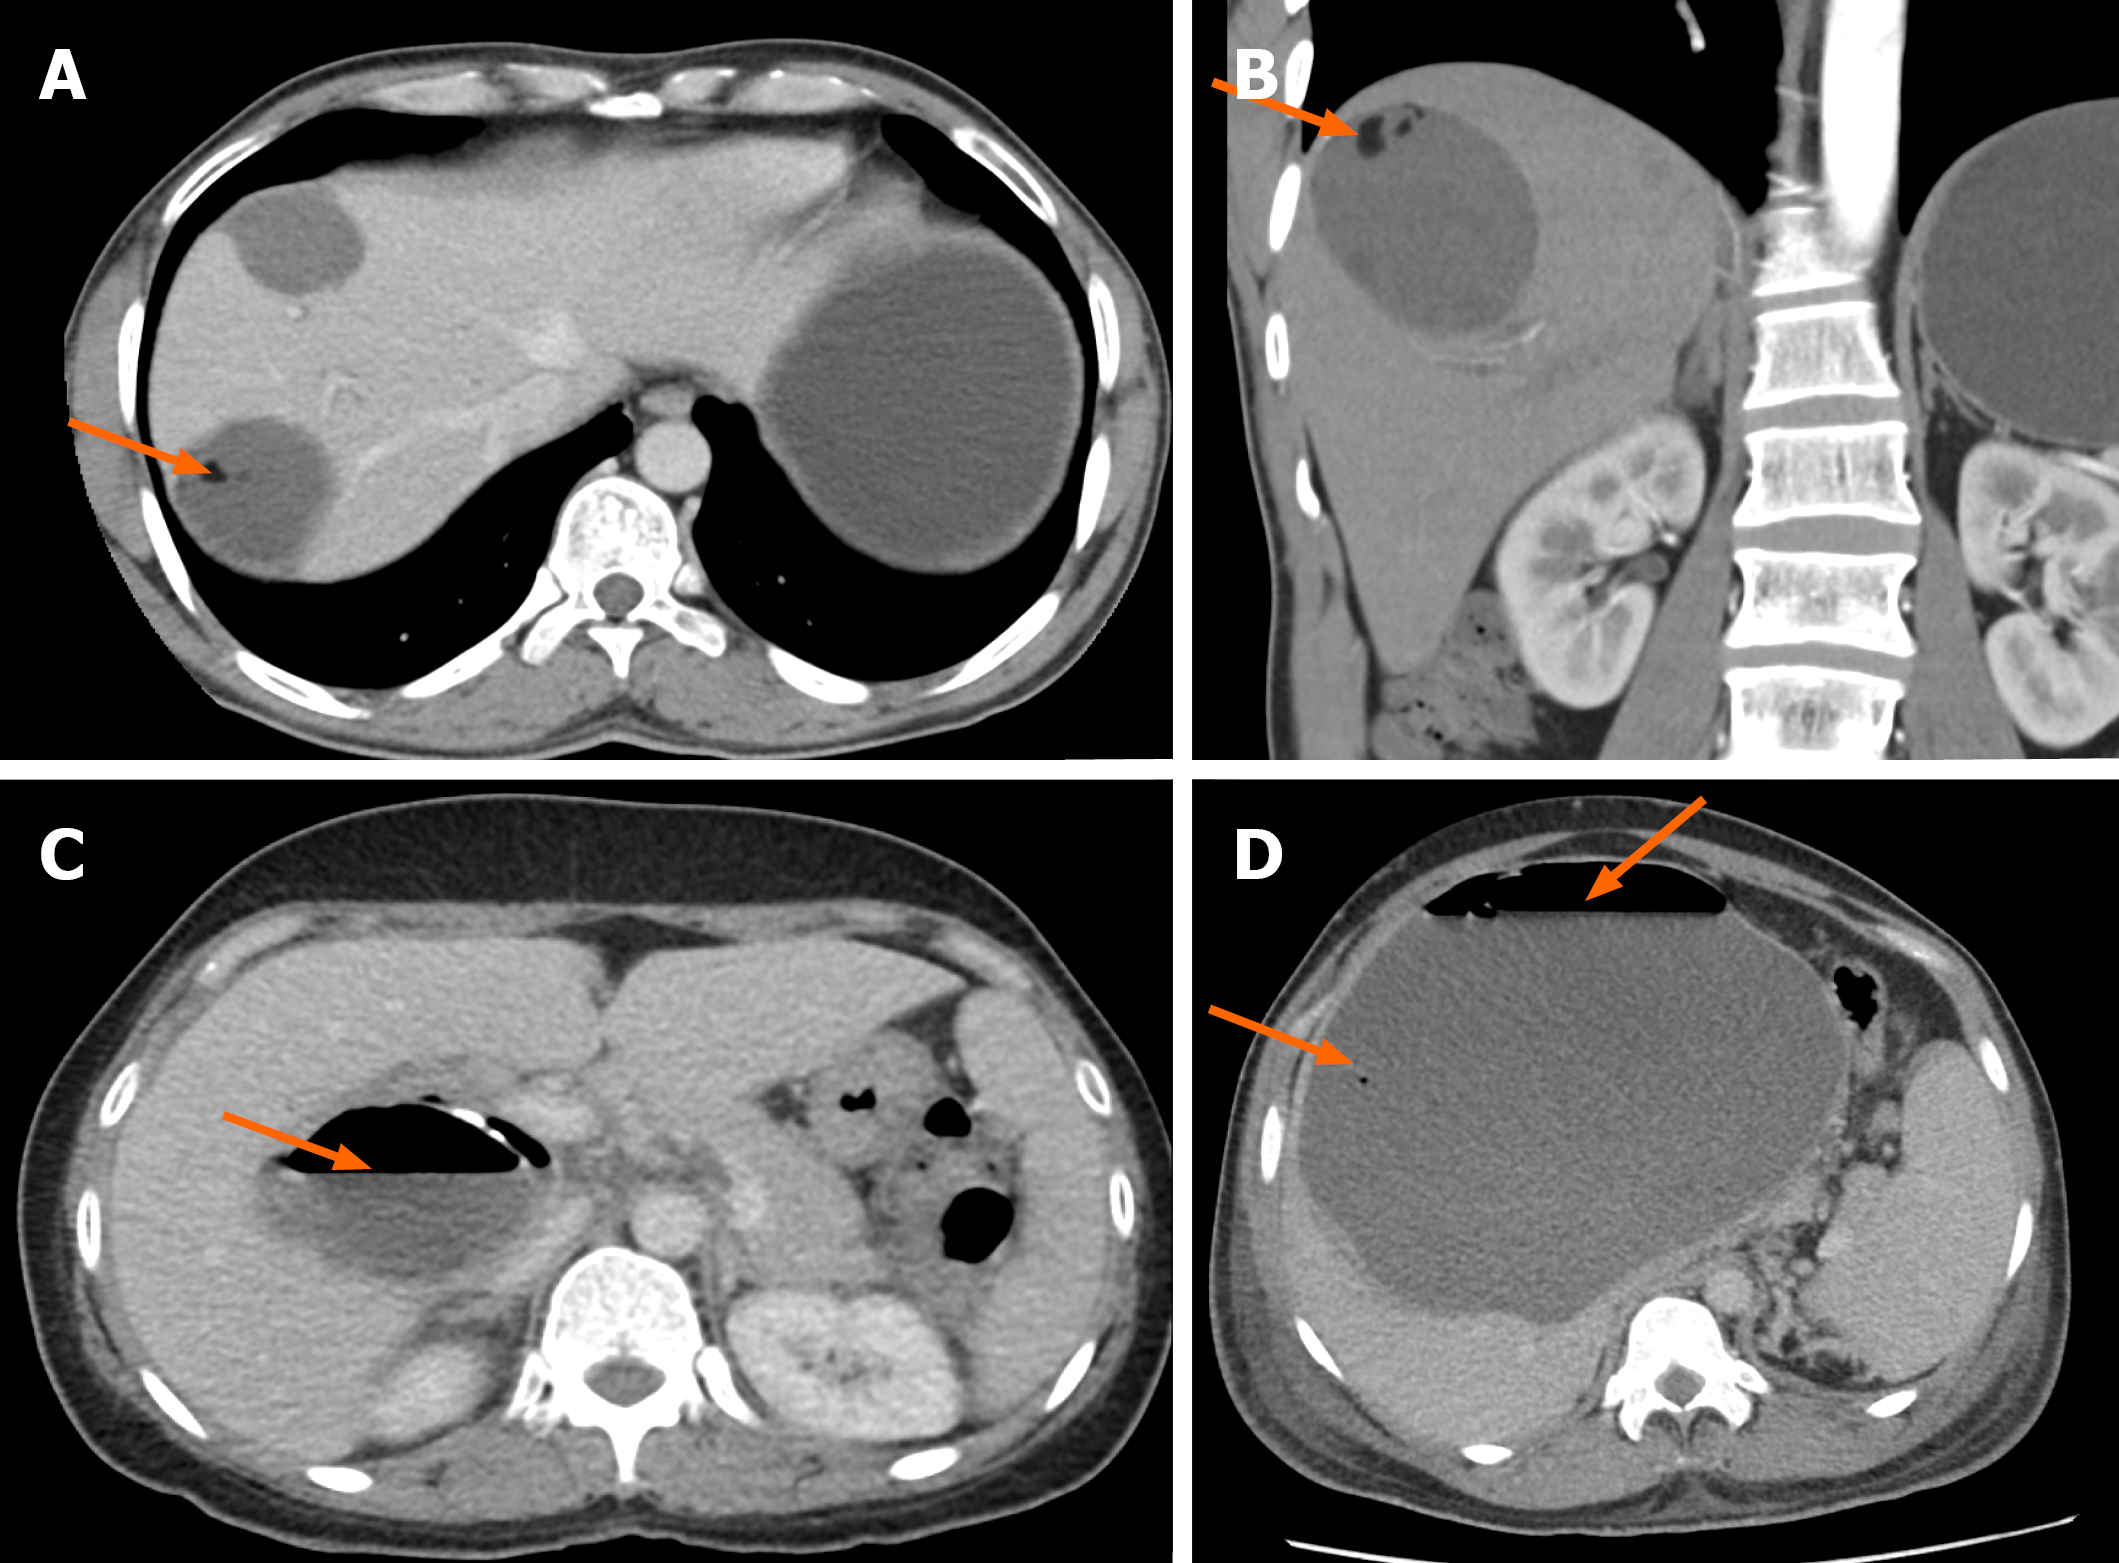
Figure 12 Fat and gas within hydatid cyst disease.
A and B: Computed tomography (CT) axial and coronal CT images showing a focal fat density lobule within the hydatid cyst in the right lobe of the liver (arrows); C and D: Axial CT sections from two different patients showing air specks and air-fluid levels within the hydatid cyst (arrows). This was iatrogenic due to surgical deroofing of the cyst in C and due to superinfection of the cyst in D.
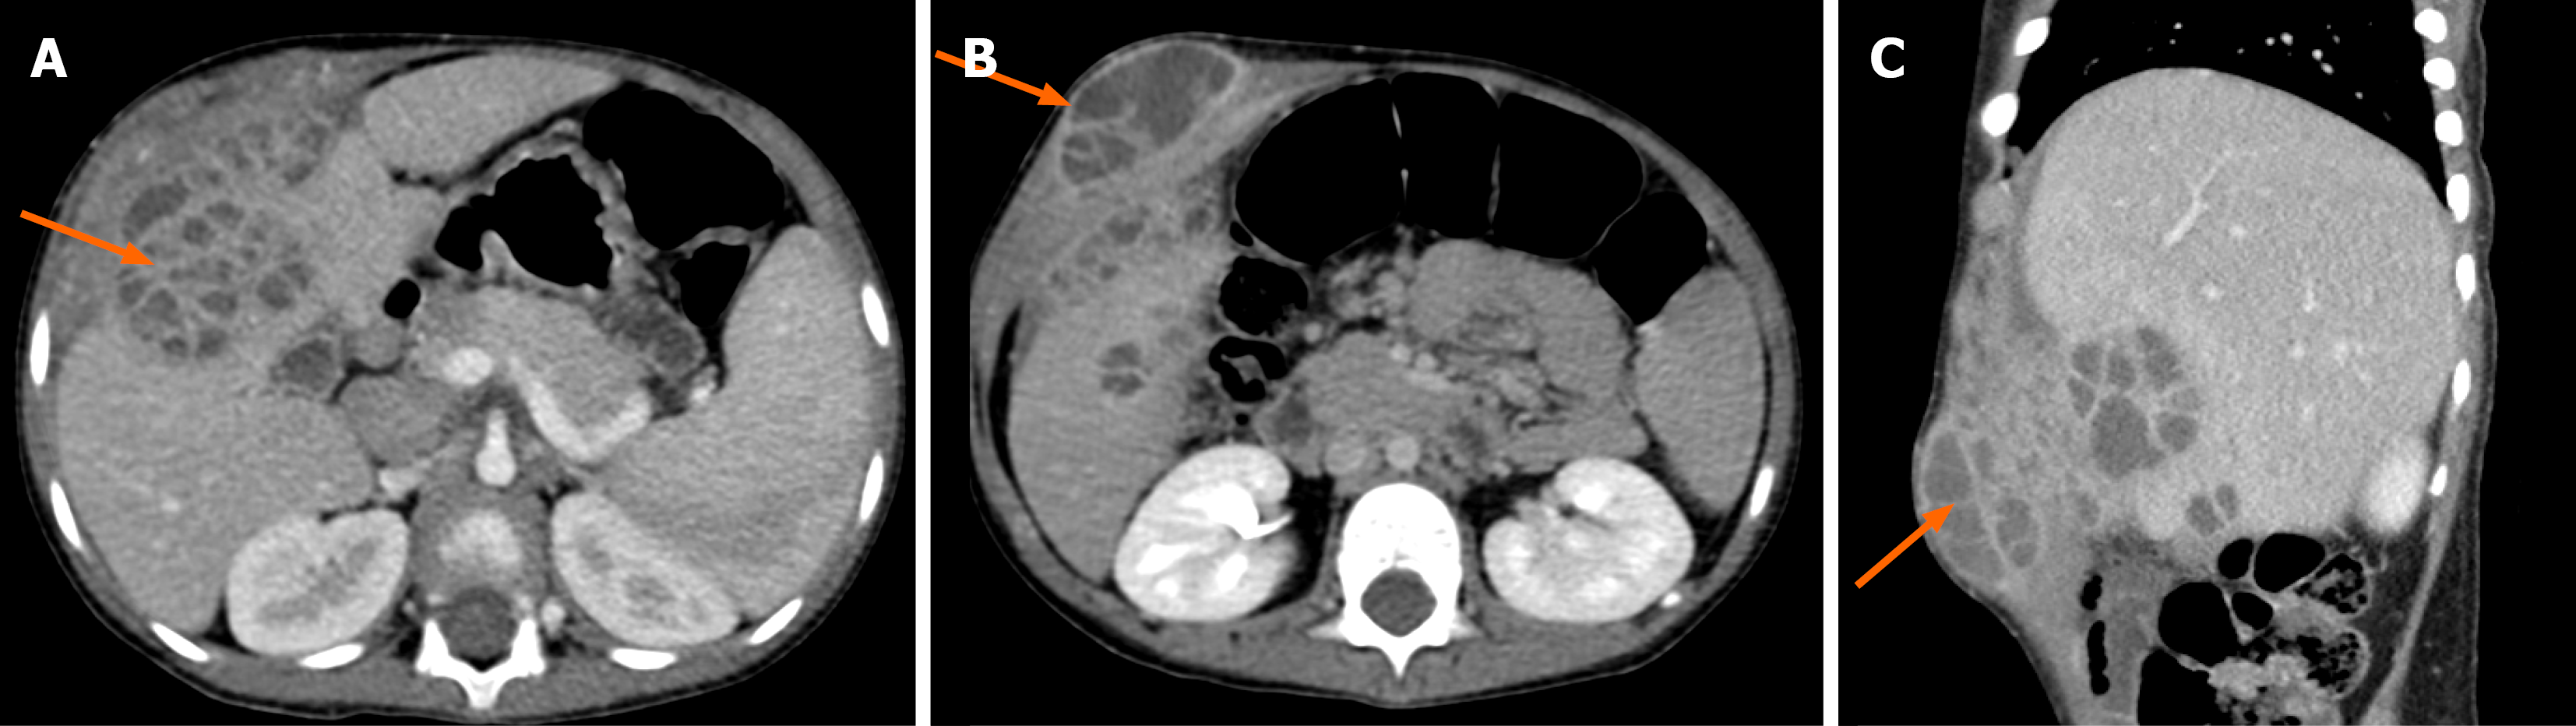
Figure 13 Hepatic hydatid disease with exophytic involvement of the abdominal wall.
A: Computed tomography axial image showing a multicystic hydatid cyst in the right lobe of the liver involving segments IV and V (arrow); B and C: Axial and sagittal computed tomography images showing extension of the lesion from the subcapsular location of the liver and into the anterior abdominal wall (arrows).
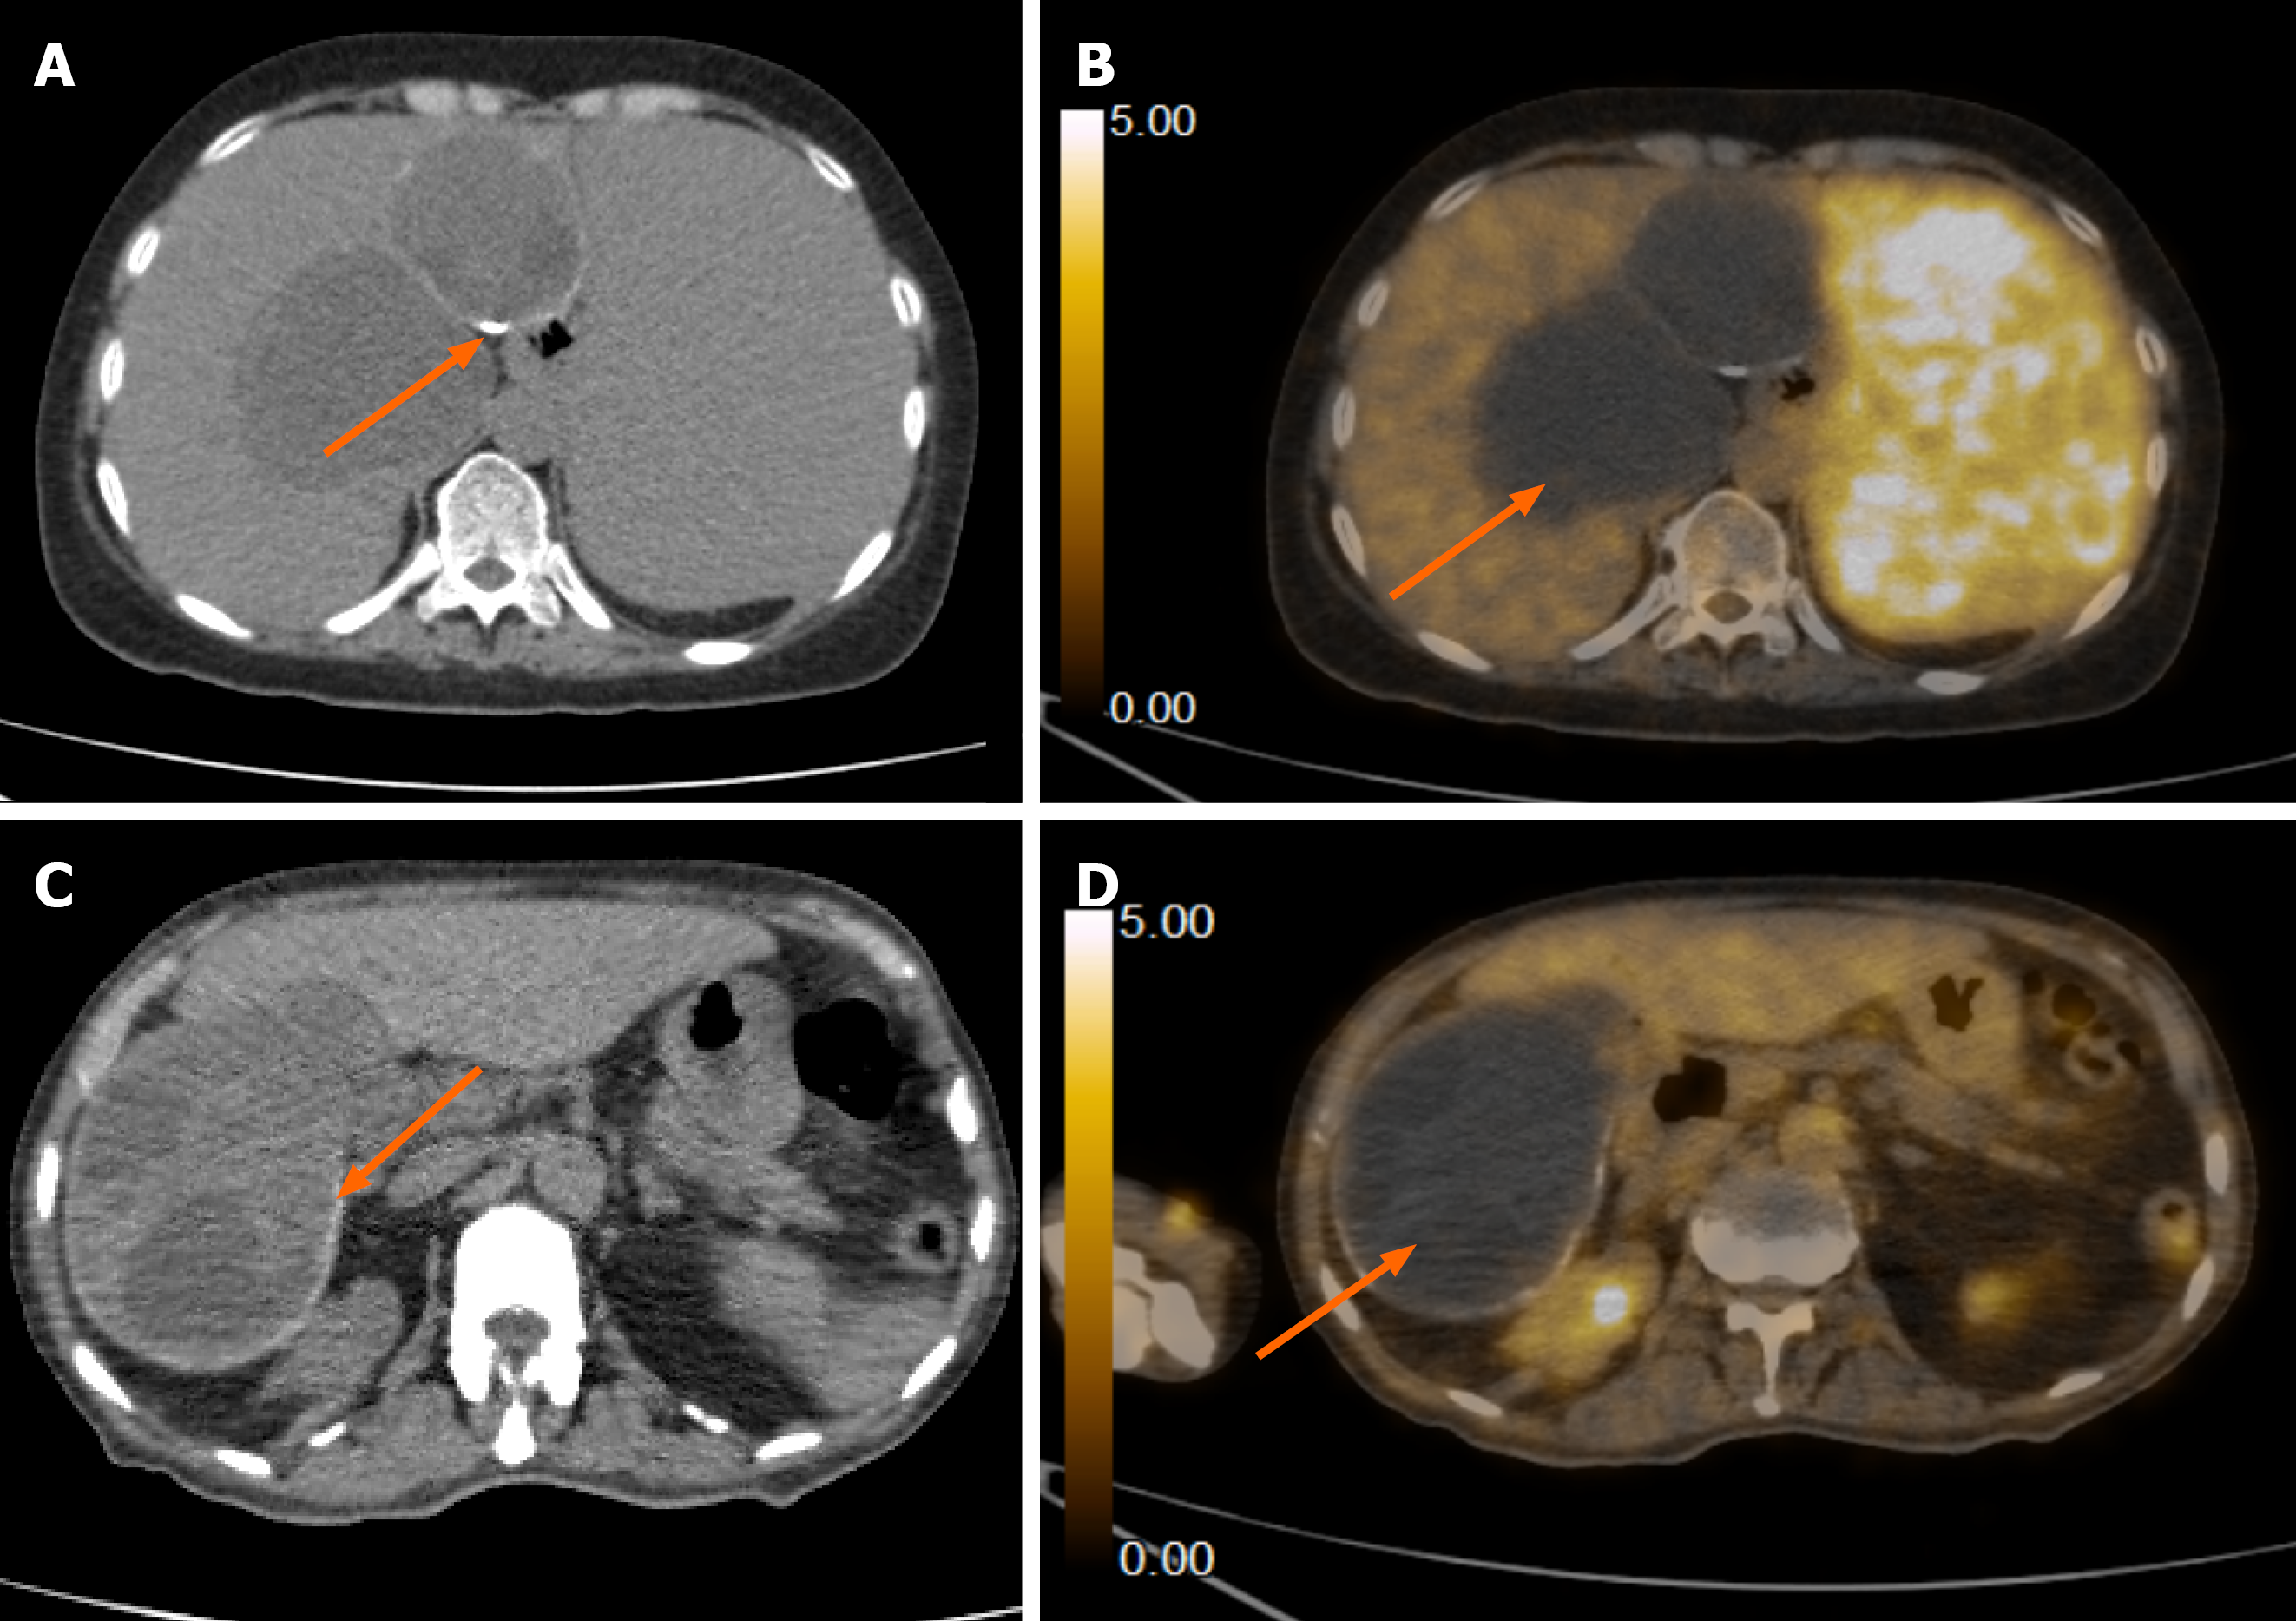
Figure 14 Positron emission tomography/computed tomography images of hydatid cysts in two patients.
A: Plain computed tomography (CT) axial image showing a cystic lesion with wall calcification (arrow); B: Fused positron emission tomography/CT axial image shows no evidence of fluorodeoxyglucose activity within the lesion (arrow); C: Plain CT axial image shows another hydatid cyst in segment VI of the liver with peripheral calcification (arrow); D: Fused positron emission tomography/CT axial image shows no corresponding fluorodeoxyglucose activity (arrow).
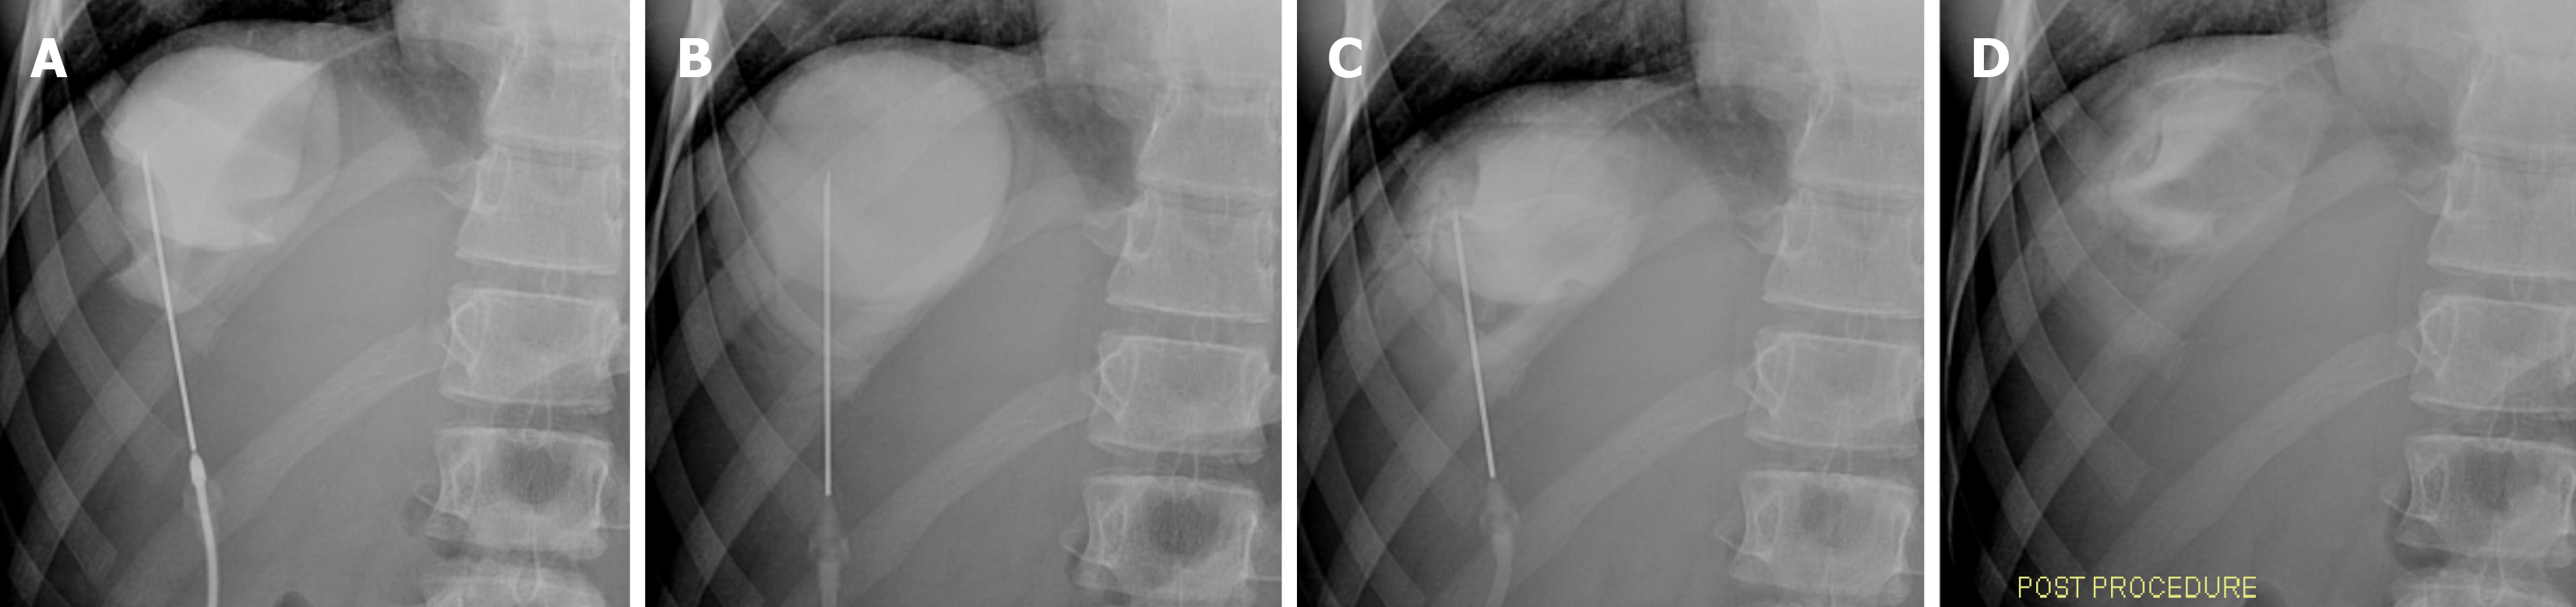
Figure 15 Percutaneous aspiration injection and reaspiration procedure fluoroscopic images.
A 15-year-old girl presented with cystic echino
- Citation: Khandwala K, Sajjad M, Hussain Z, Zeeshan M, Hilal K. Hepatic hydatid cyst disease in low- and middle-income countries: Spectrum of imaging findings and complications. World J Hepatol 2026; 18(8): 123946
- URL: https://www.wjgnet.com/1948-5182/full/v18/i8/123946.htm
- DOI: https://dx.doi.org/10.4254/wjh.123946