
















Copyright: ©Author(s) 2026.
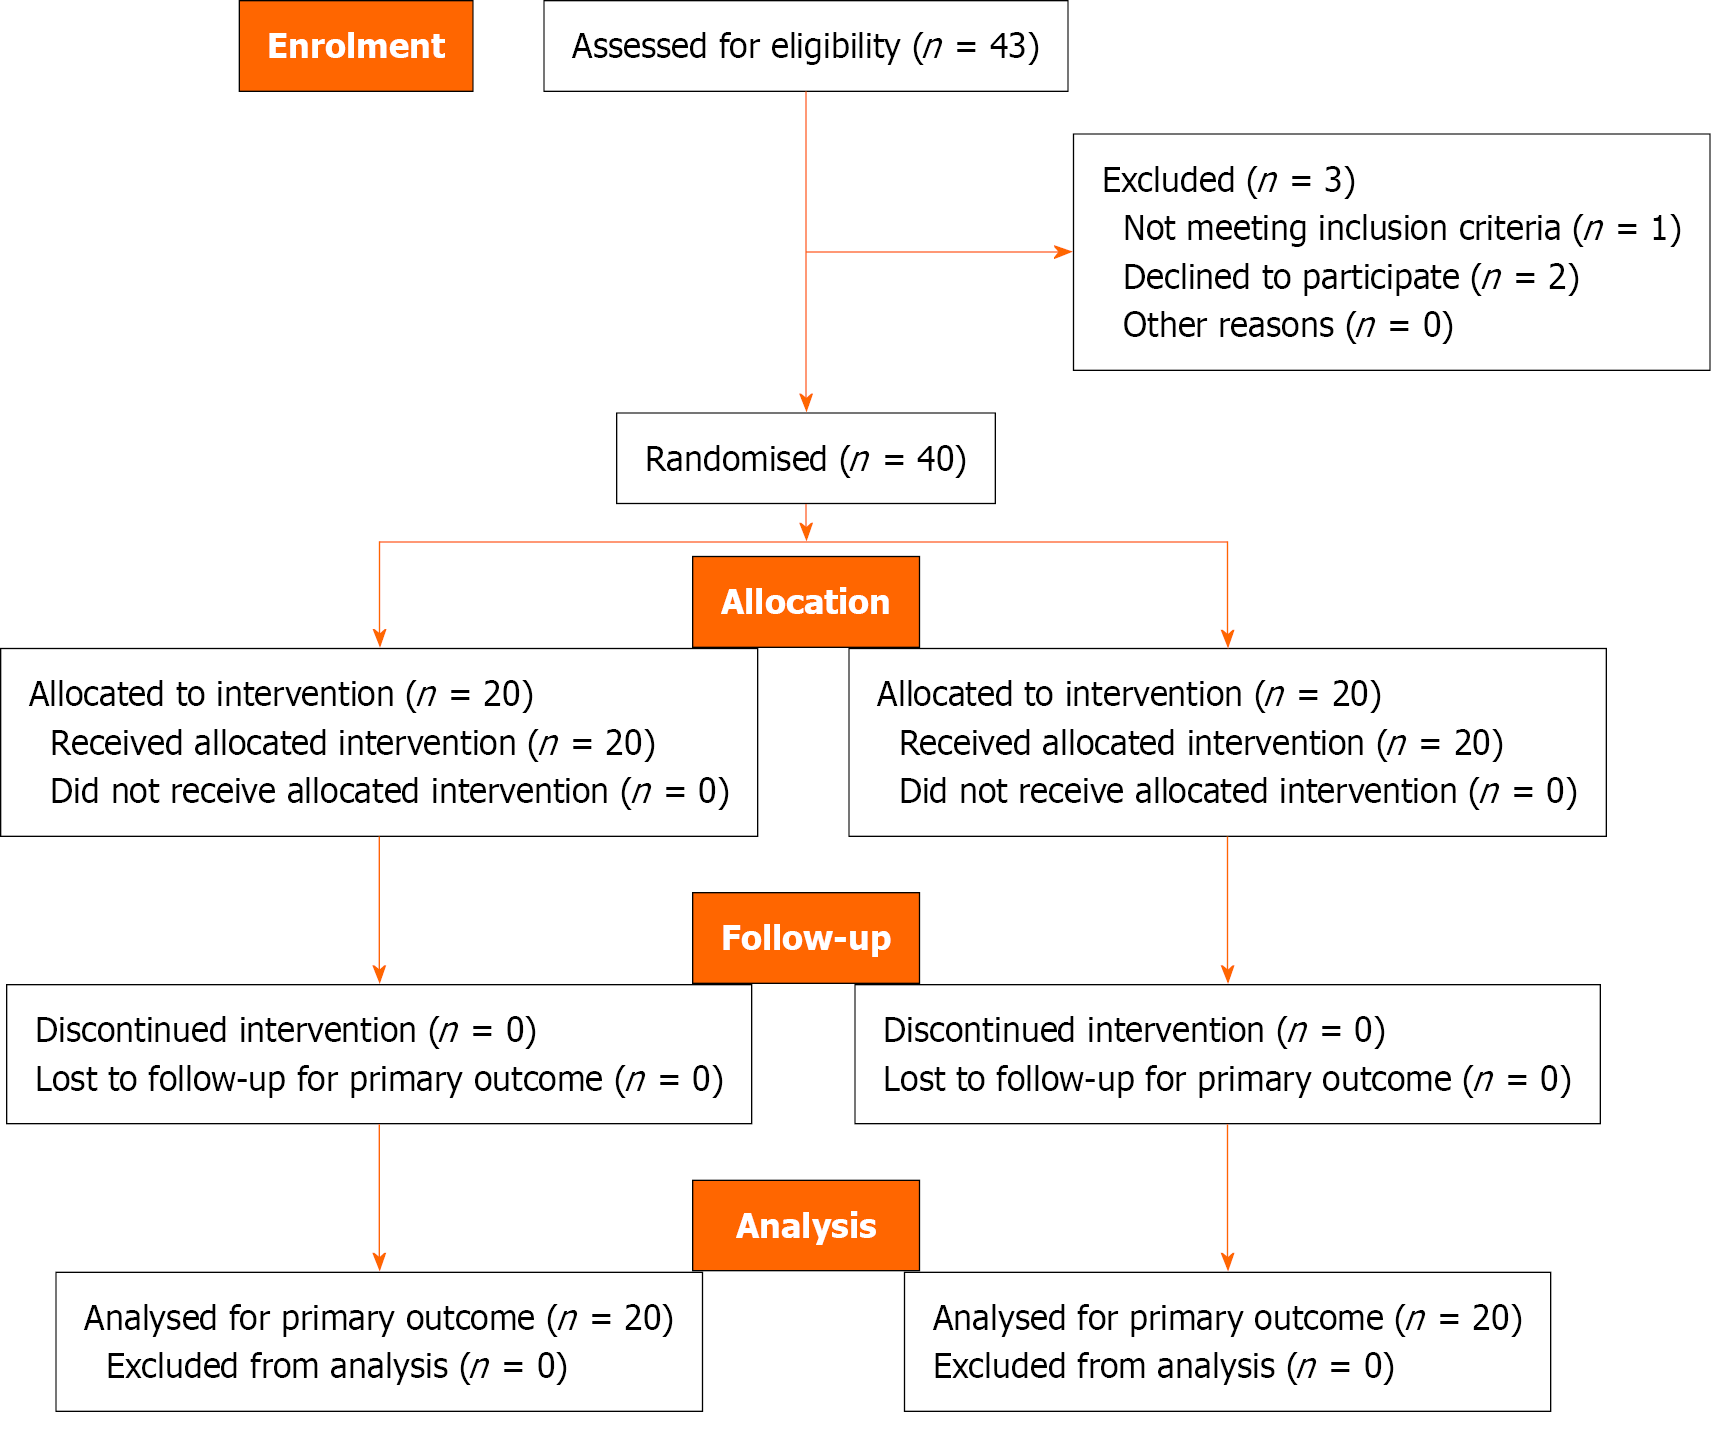
Figure 1
Flow diagram of the participant inclusion process.

Figure 2 Single-cell RNA sequencing of liver tissues from cirrhotic patients.
Six liver samples, divided into the control group (n = 3) and the Jianpi Huoxue Formula (JHF) group (n = 3), were analyzed using single-cell RNA sequencing. A: Diagram showing the experimental procedure in this study; B: Fourteen major liver cell types were identified based on cell-type-specific marker genes after JHF treatment; C: Gene Ontology and terms and Kyoto Encyclopedia of Genes and Genomes analyses of the top 20 differentially expressed genes in human hepatic stellate cells (HSCs) subtypes; D: Violin plots and Uniform Manifold Approximation and Projection (UMAP) plots showing the expression levels of STAT3, MYC, and MCL-1 across HSC subpopulations after JHF treatment; E: Violin plots and UMAP plots showing the expression levels of ACTA2, COL1A1, COL1A2, and MMP1 in the major cell population.
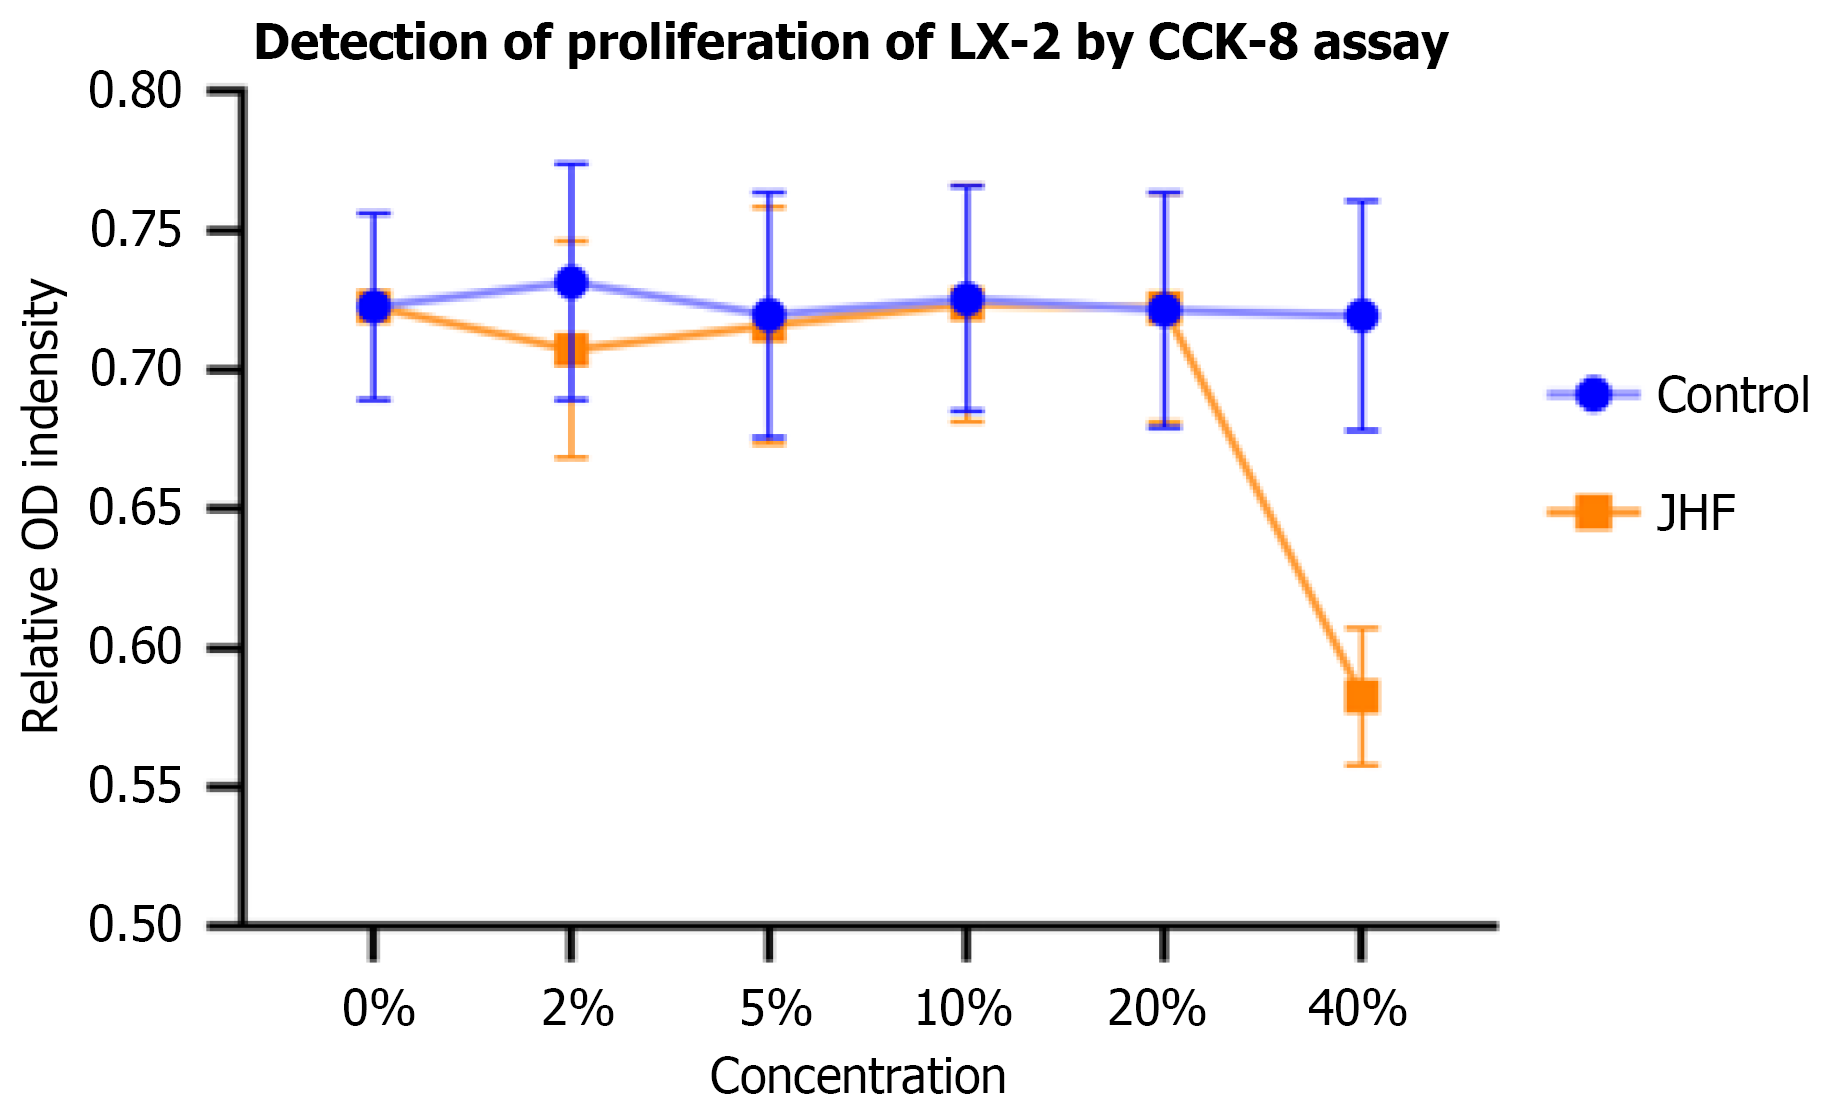
Figure 3 Screening of Jianpi Huoxue Formula drug-containing serum concentrations and detection of LX-2 cell proliferation via the CCK-8 assay.
CCK-8: Cell counting kit-8; JHF: Jianpi Huoxue Formula.
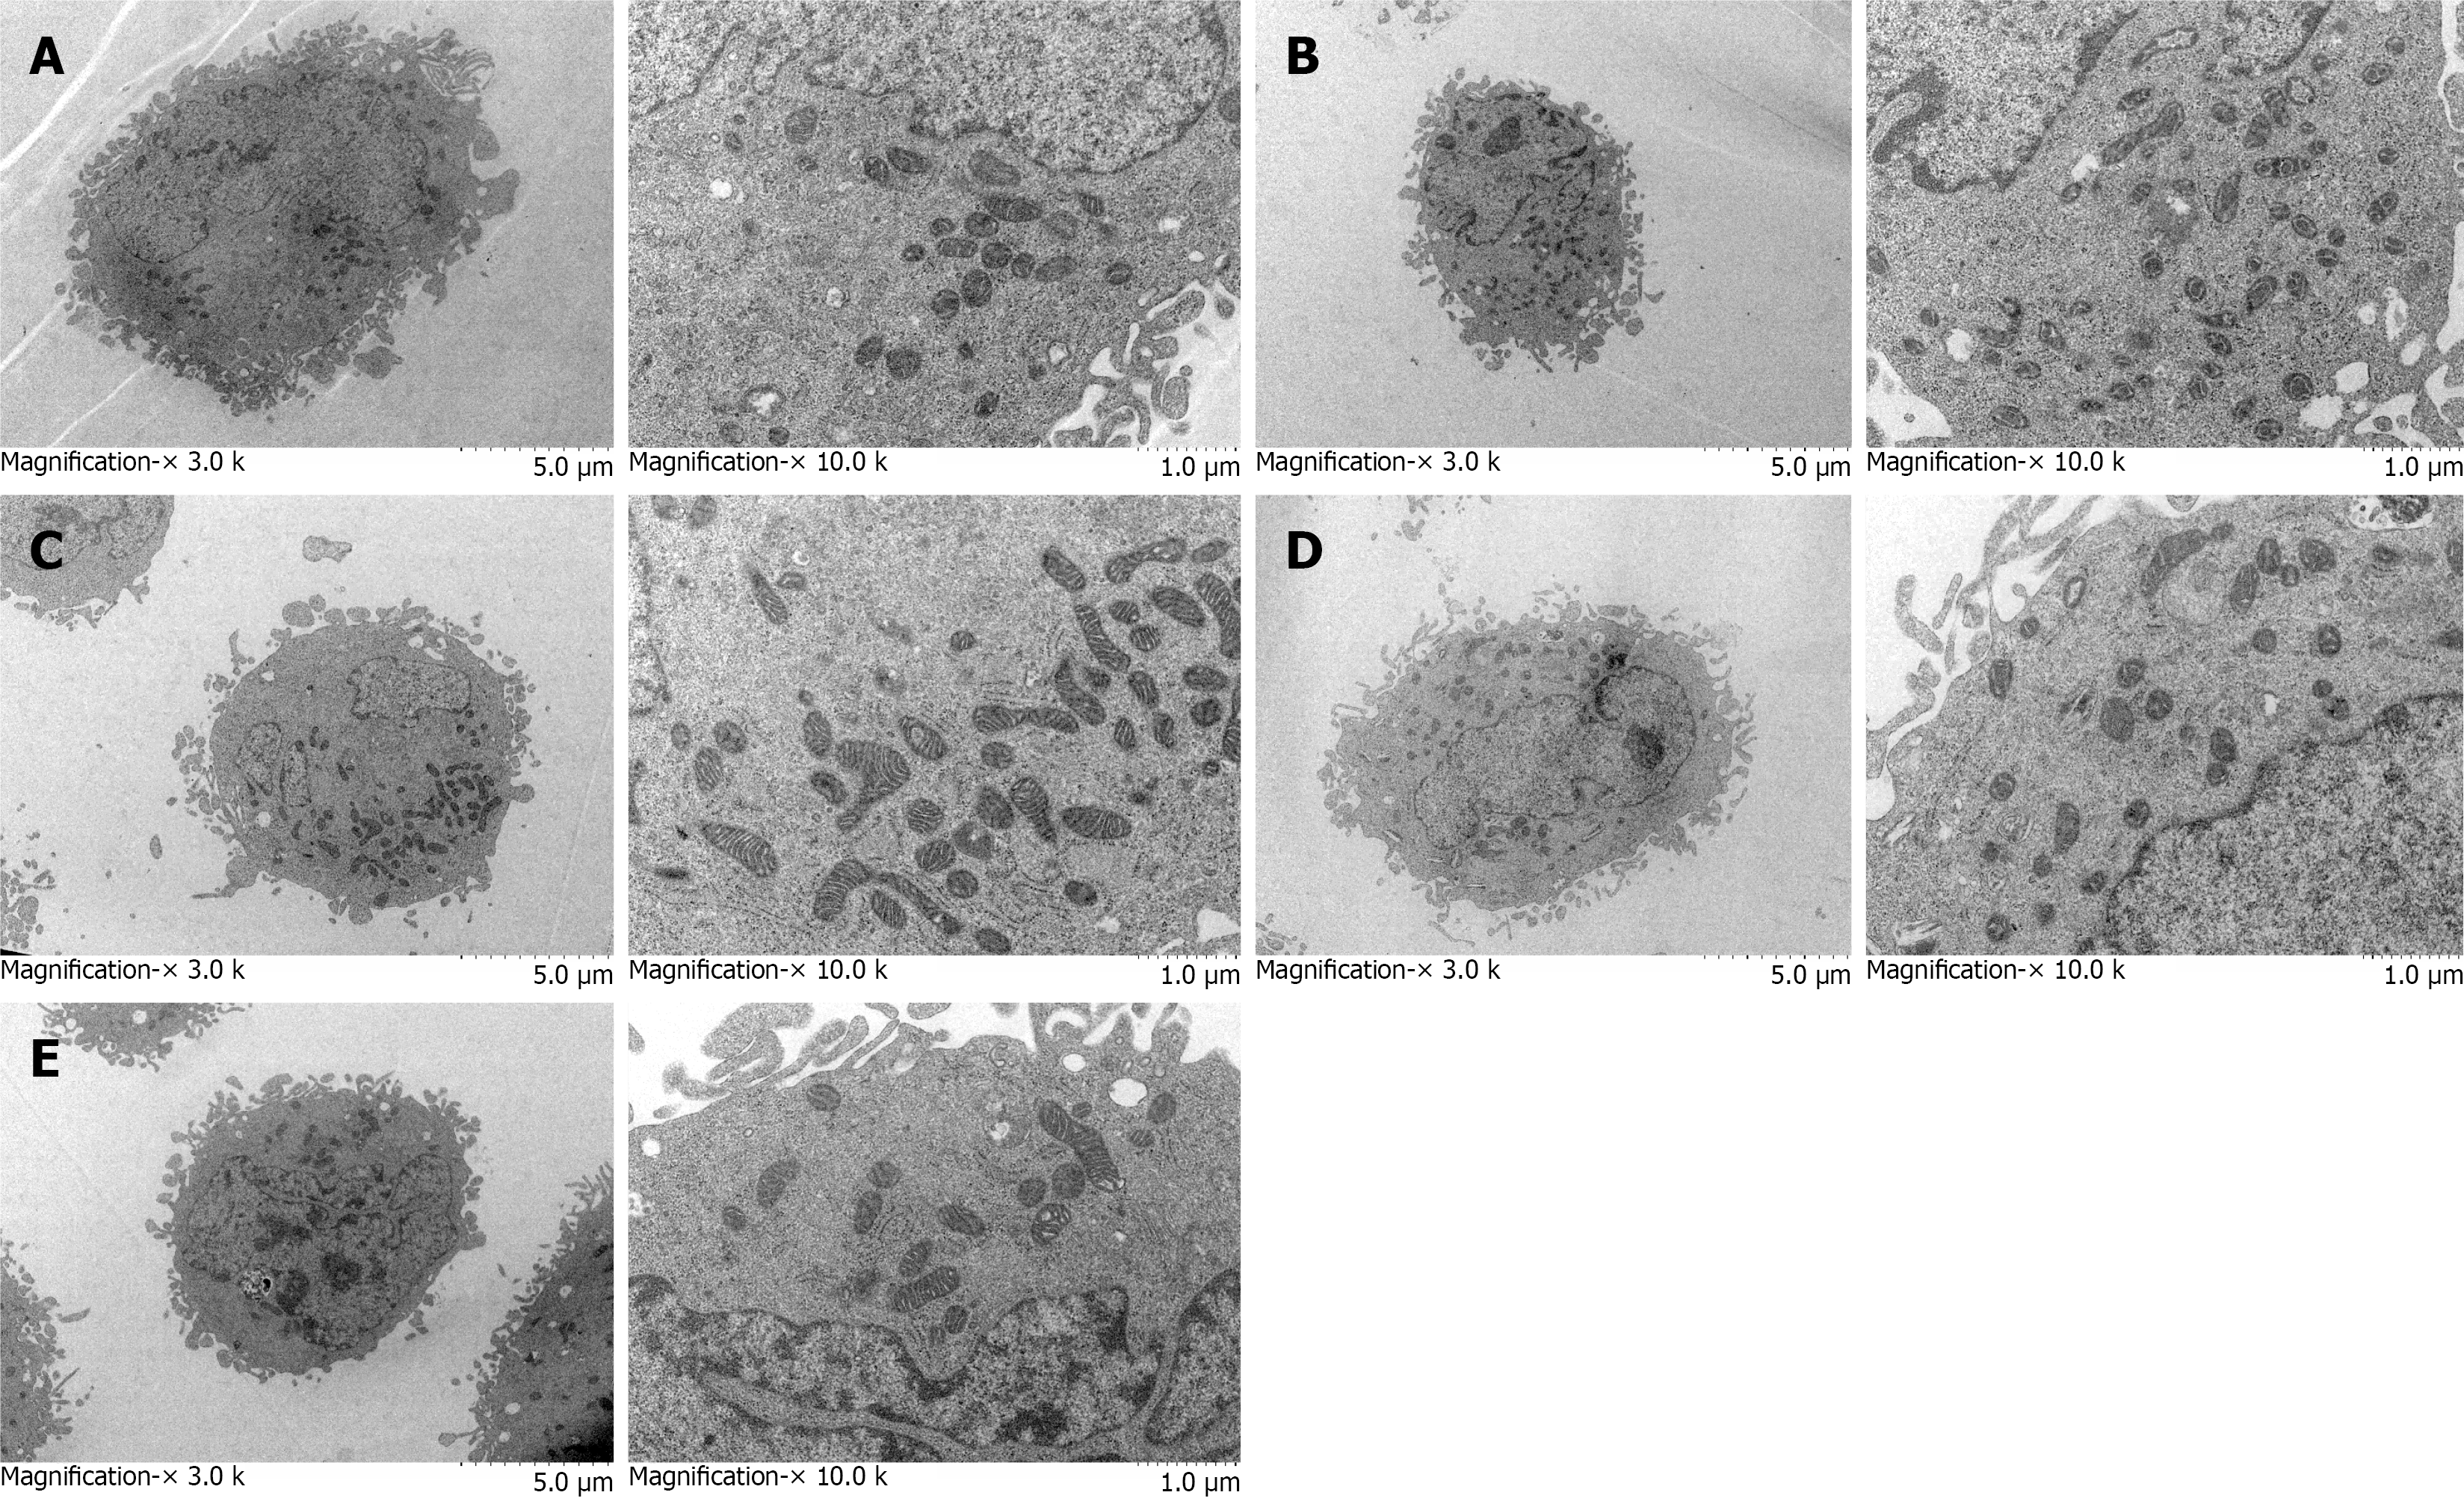
Figure 4 Transmission electron microscopy observations of human hepatic stellate cells ultrastructure.
A: Transmission electron microscopy (TEM) observation results of the control group; B: TEM observation results of the Jianpi Huoxue Formula (JHF) group; C: TEM observation results of the STAT3 activator group; D: TEM observation results of the STAT3 inhibitor group; E: TEM observation results of the STAT3 activator + JHF group.
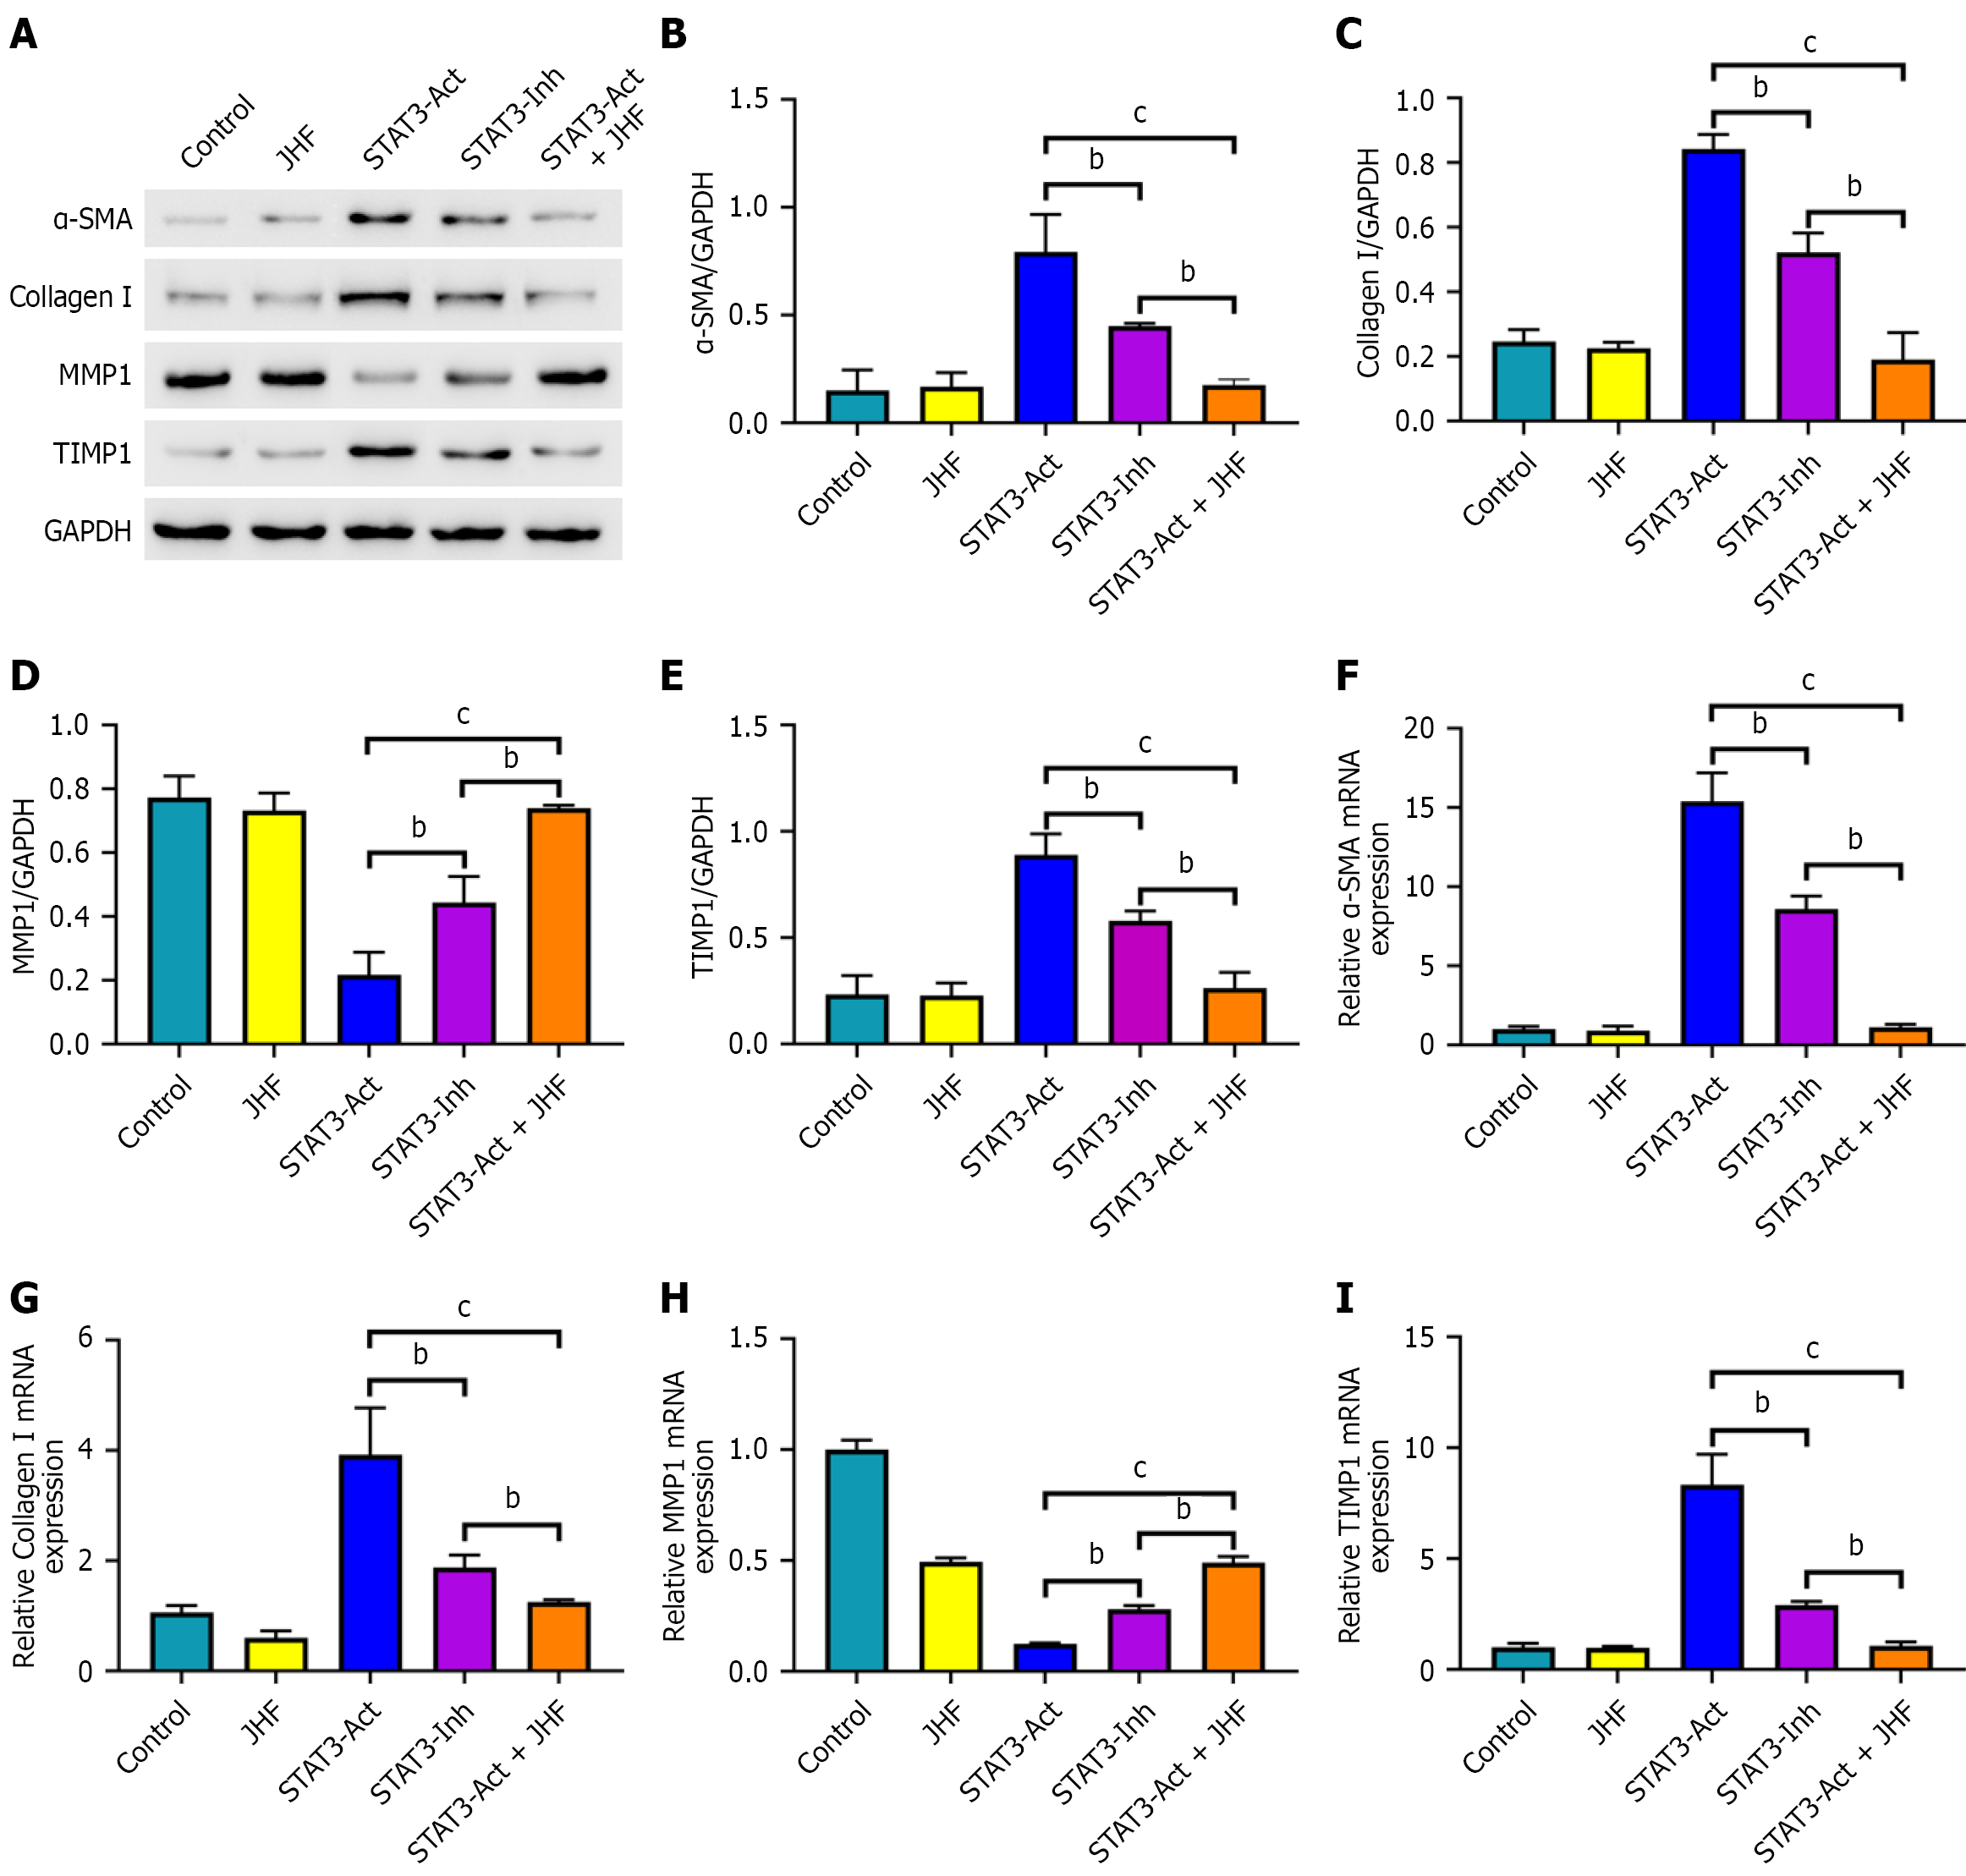
Figure 5 Western blot and quantitative real-time PCR for detecting α-SMA, Collagen I, MMP1, and TIMP1.
A: Western blot results of α-SMA, Collagen I, MMP1, and TIMP1; B: Α-SMA western blot result; C: Collagen I western blot result; D: MMP1 western blot result; E: TIMP1 western blot result; F: Α-SMA quantitative real-time PCR (qRT-PCR) result; G: Collagen I qRT-PCR result; H: MMP1 qRT-PCR result; I: TIMP1 qRT-PCR result. aP < 0.05, bP < 0.01, cP < 0.001.
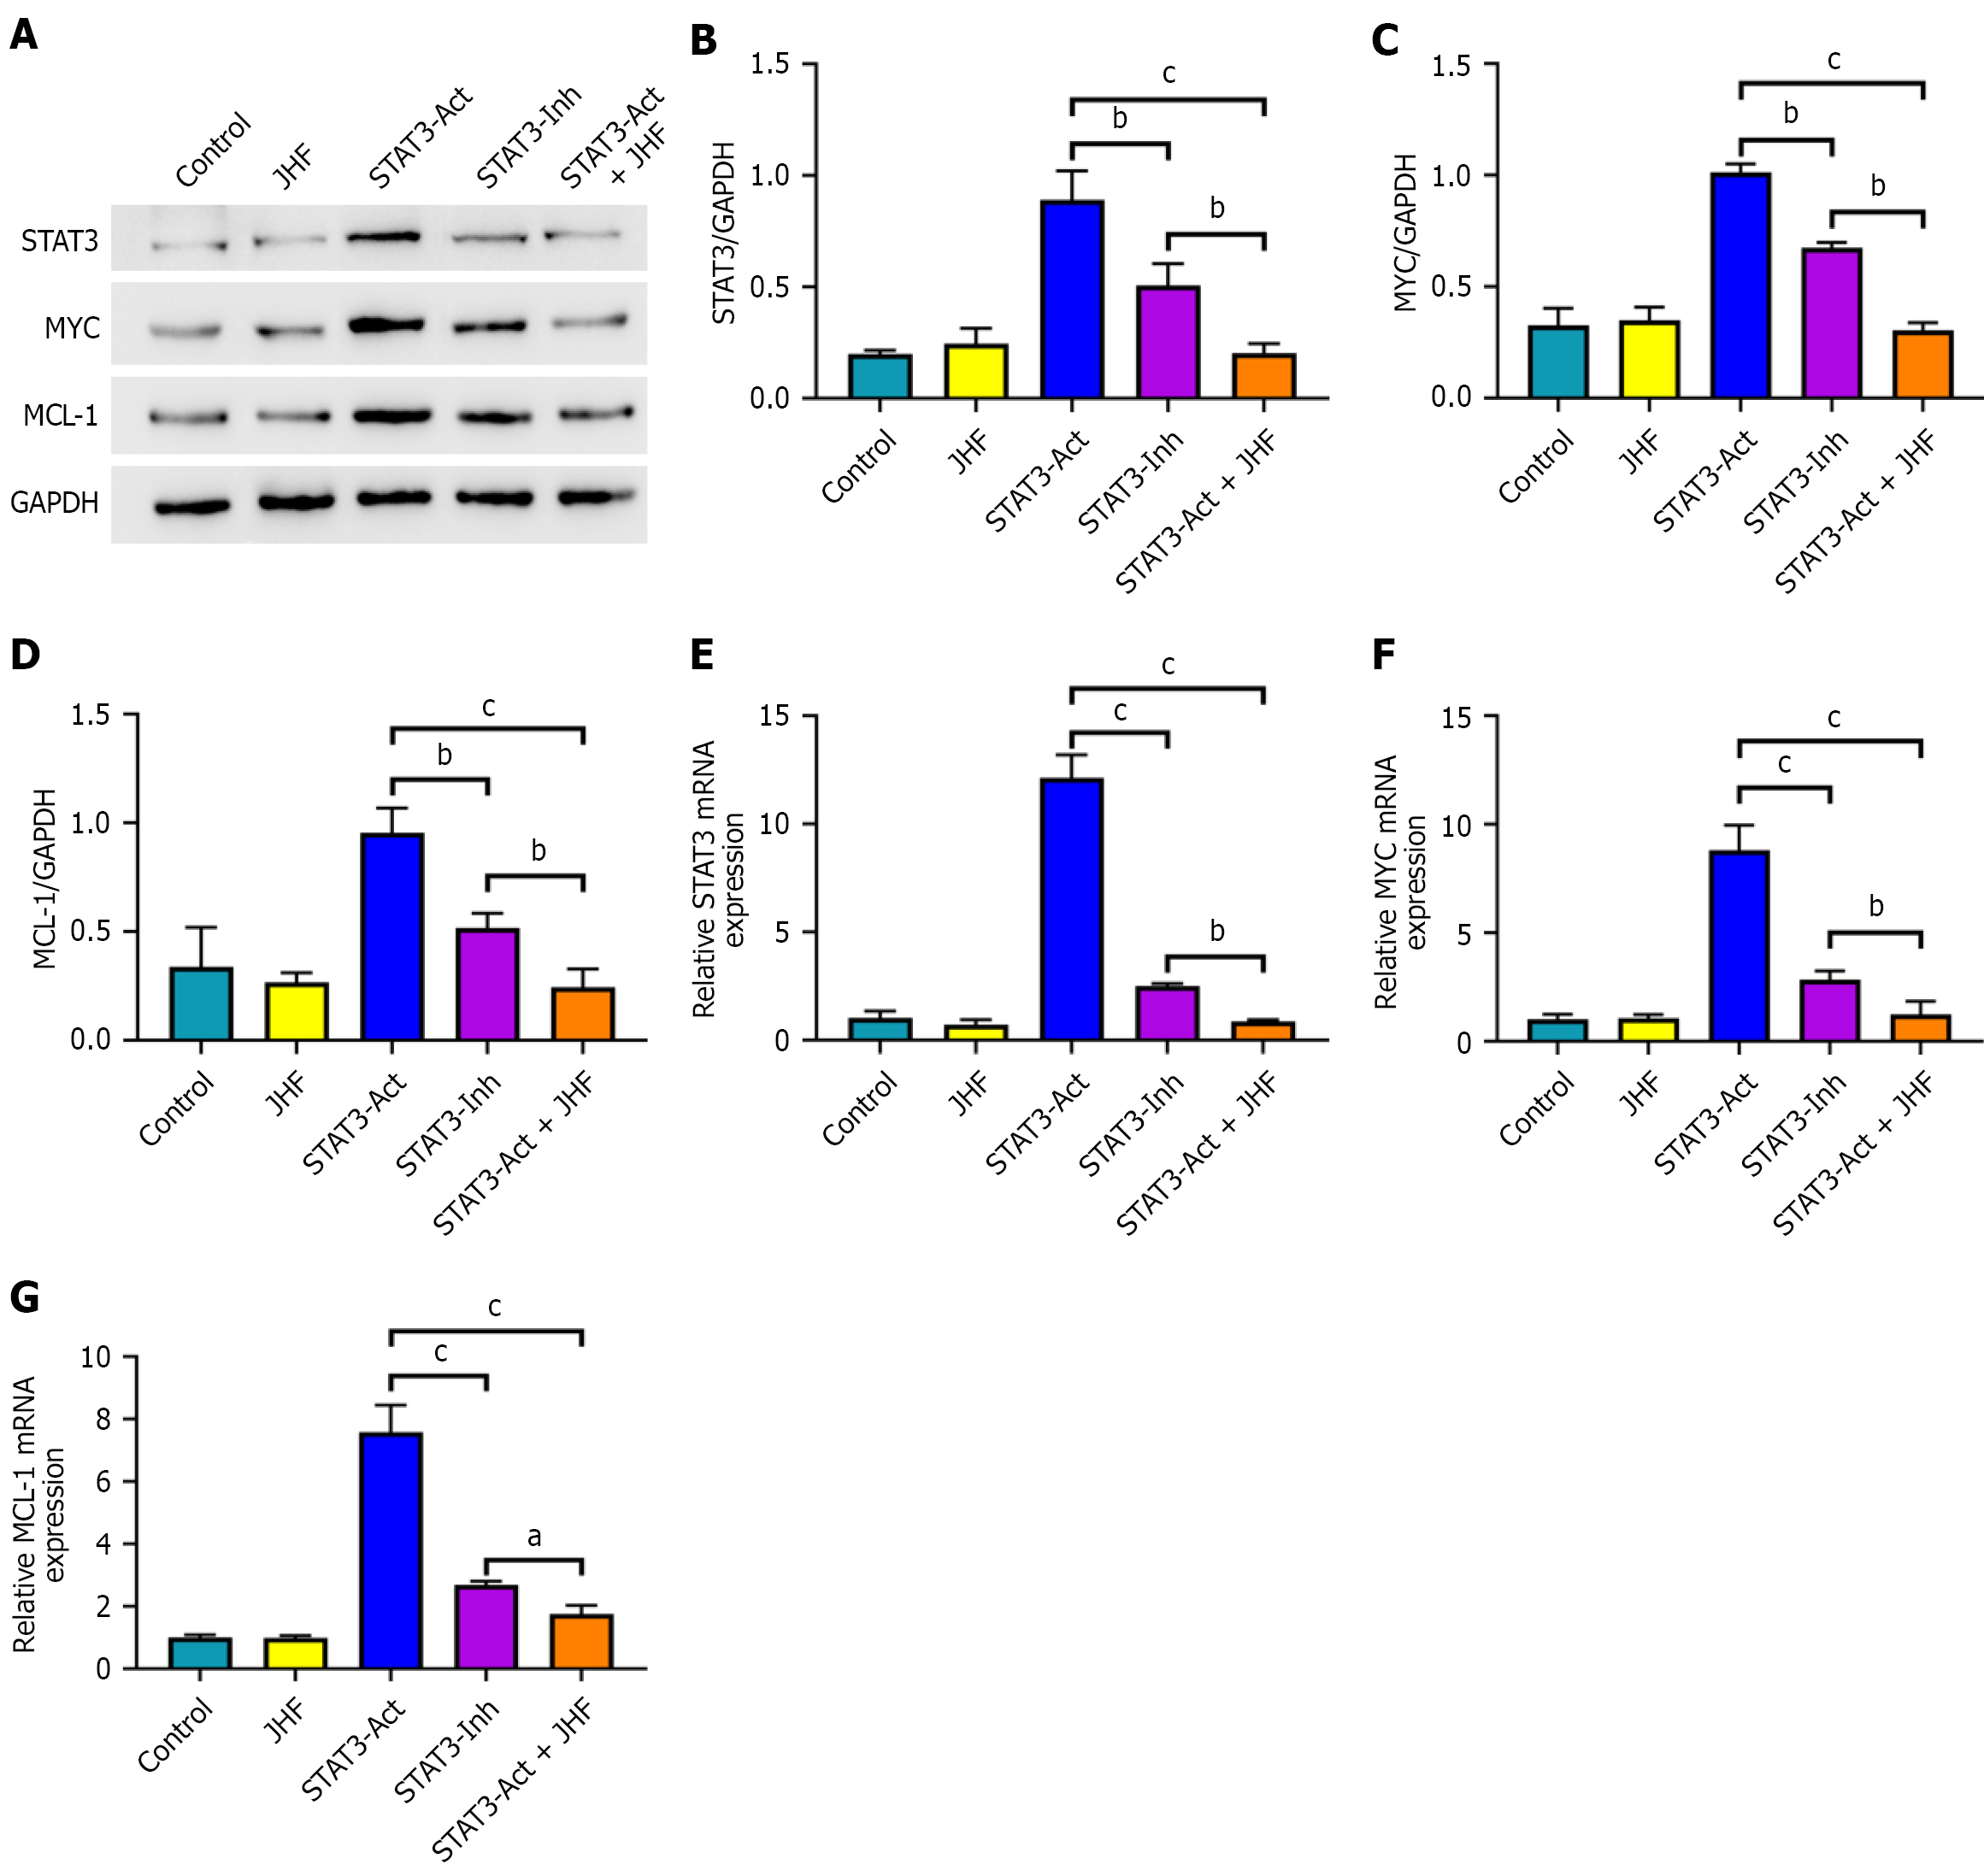
Figure 6 Western blot and quantitative real-time PCR for detecting STAT3, MYC, and MCL-1.
A: Western blot results of STAT3, MYC, and MCL-1; B: STAT3 western blot result; C: MYC western blot result; D: MCL-1 western blot result; E: STAT3 quantitative real-time PCR (qRT-PCR) result; F: MYC qRT-PCR result; G: MCL-1 qRT-PCR result. aP < 0.05, bP < 0.01, cP < 0.001.
- Citation: Huang L, Wu CG, Zhu TF, Li QL, Yu QS, Zhang Q, Shen Y. Suppression of the STAT3/MYC/MCL-1 pathway by the fixed Jianpi Huoxue Formula relieves early biochemical abnormalities in liver fibrosis. World J Hepatol 2026; 18(8): 122262
- URL: https://www.wjgnet.com/1948-5182/full/v18/i8/122262.htm
- DOI: https://dx.doi.org/10.4254/wjh.122262