
















Copyright: ©Author(s) 2026.
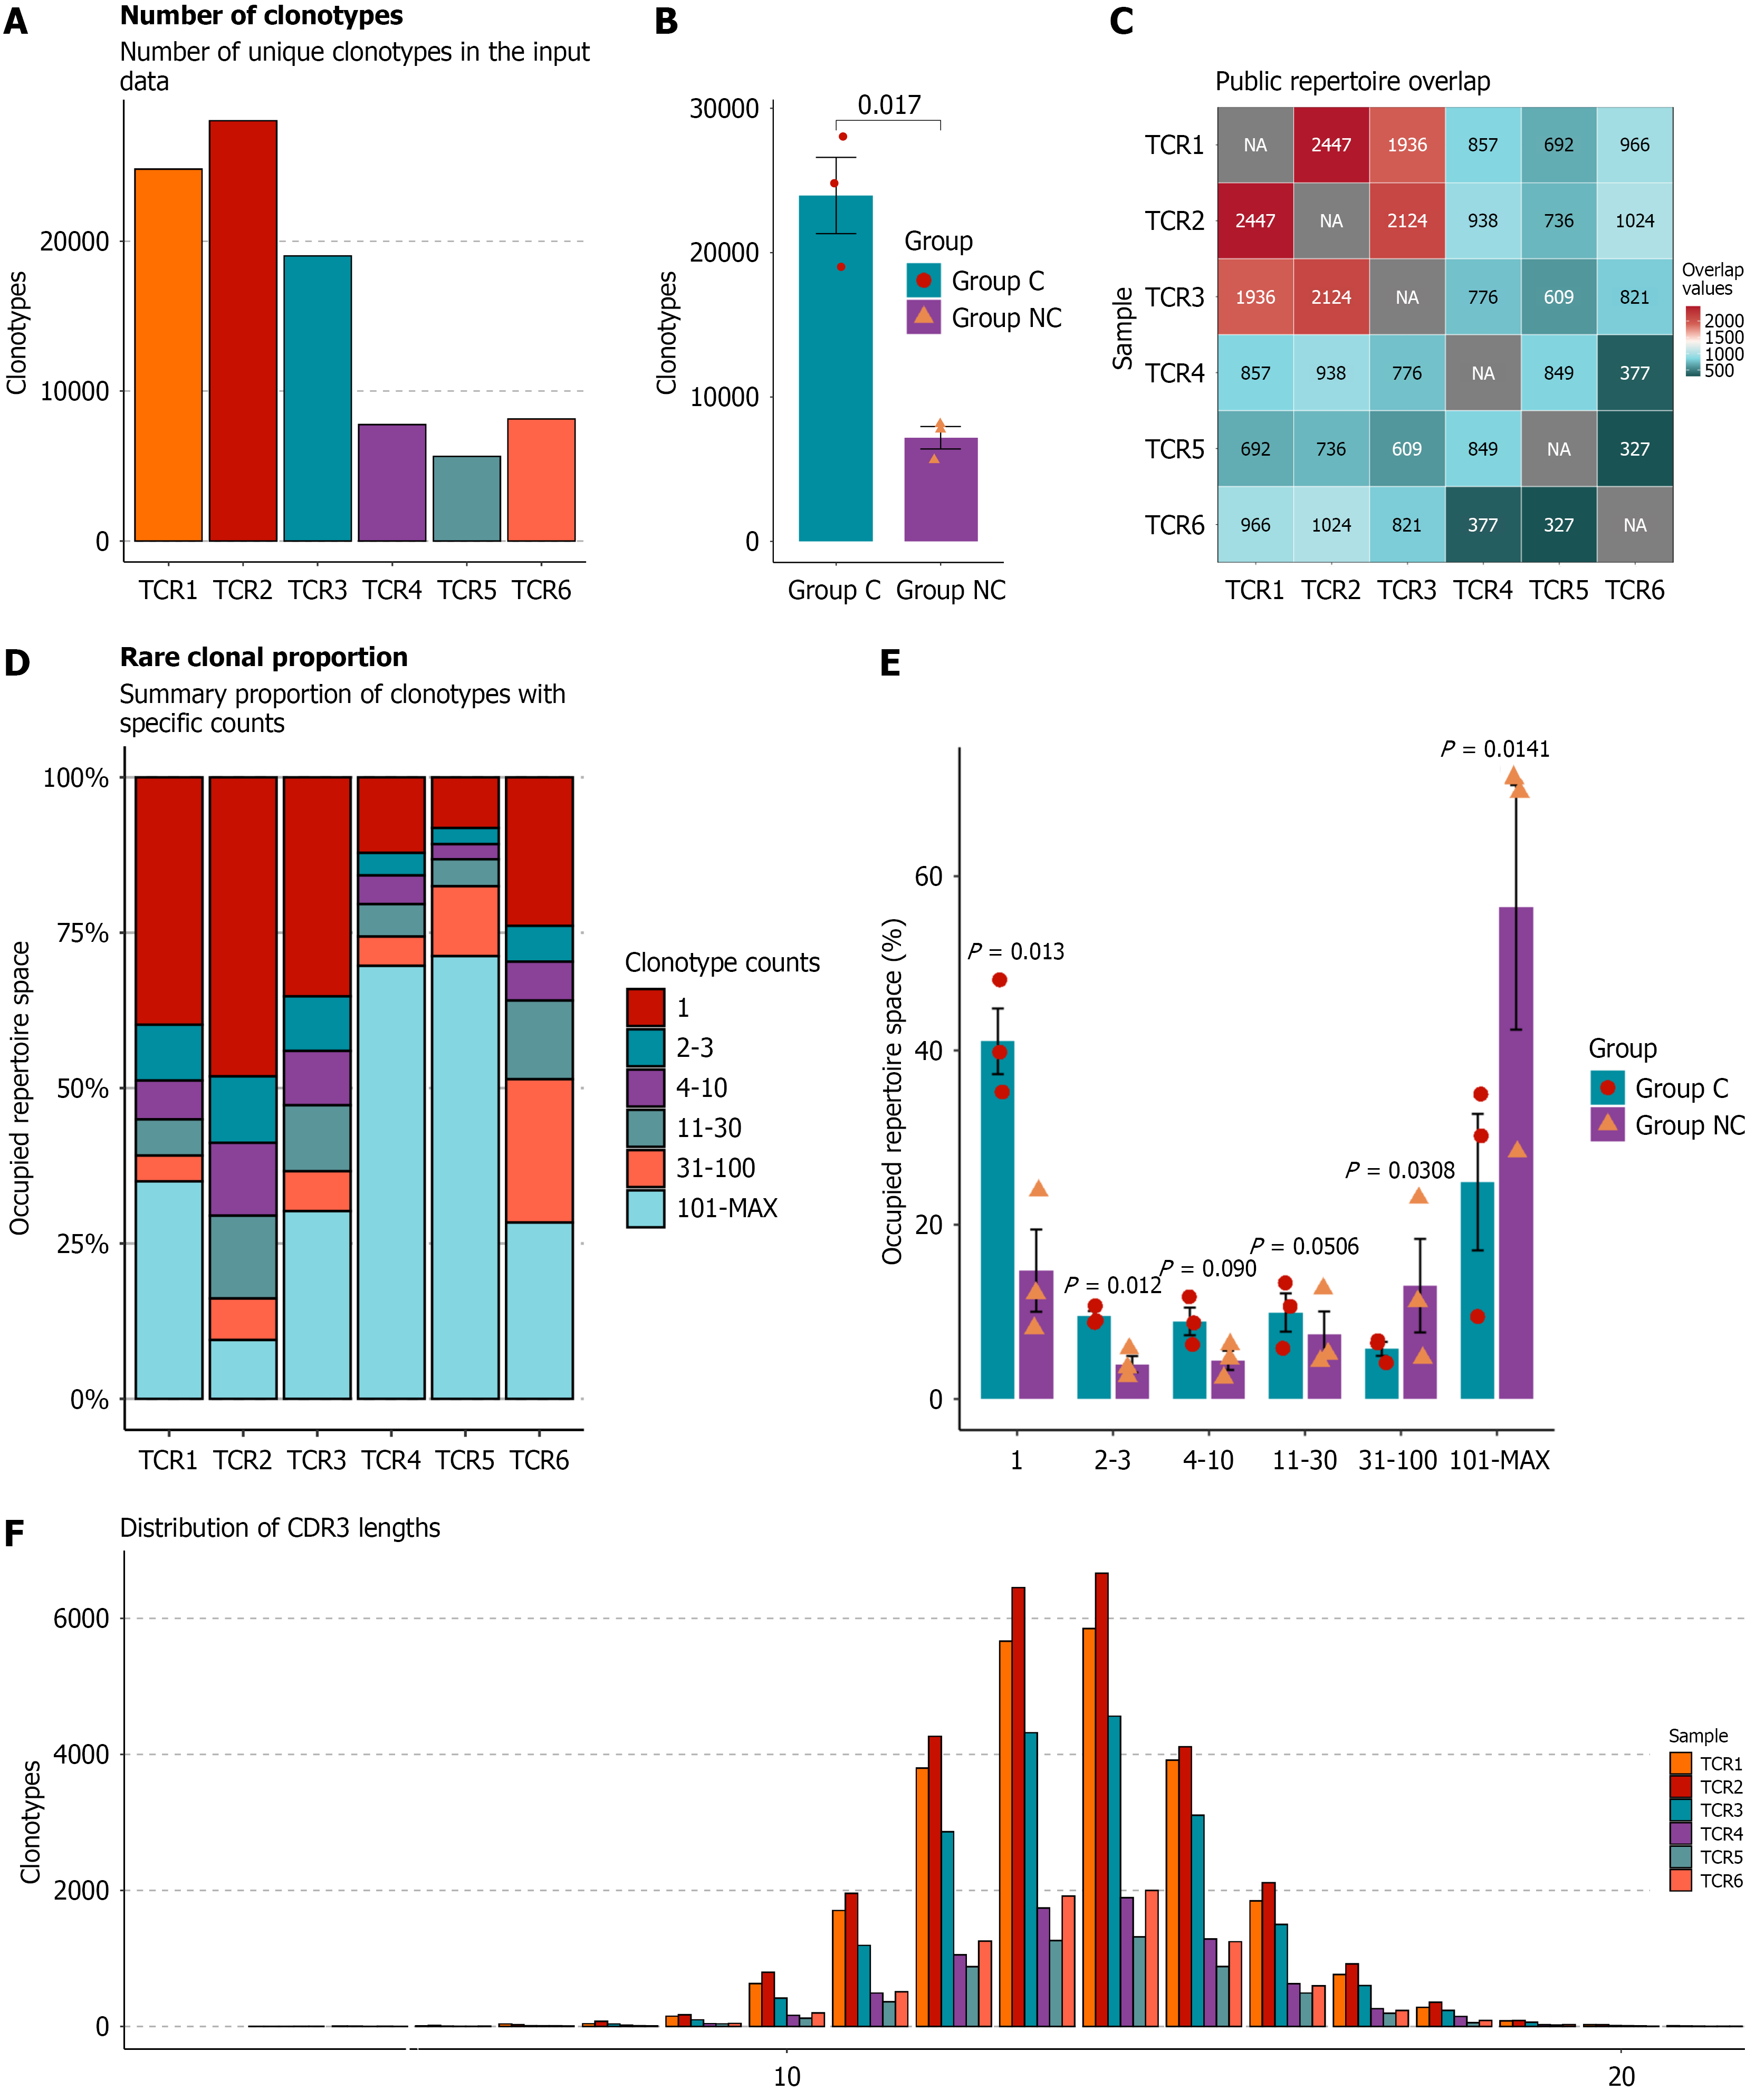
Figure 1 Comparative analysis of T cell receptor α chain diversity and clonal expansion between Group-C and Group-NC.
A: The number of unique clonotypes between the two groups; B: Clonotype counts between the two groups; C: Sharing of T cell receptor α chain sequences among samples from different groups; D: Distribution of clonotypes at specific counts; E: Relative proportion of clonotypes across different frequency categories; F: Distribution of complementarity-determining region 3 lengths. TCR 1-3: Samples from patients in Group-C; TCR 4-6: Samples from patients in Group-NC; CDR3: Complementarity-determining region 3; TCR: T cell receptor.
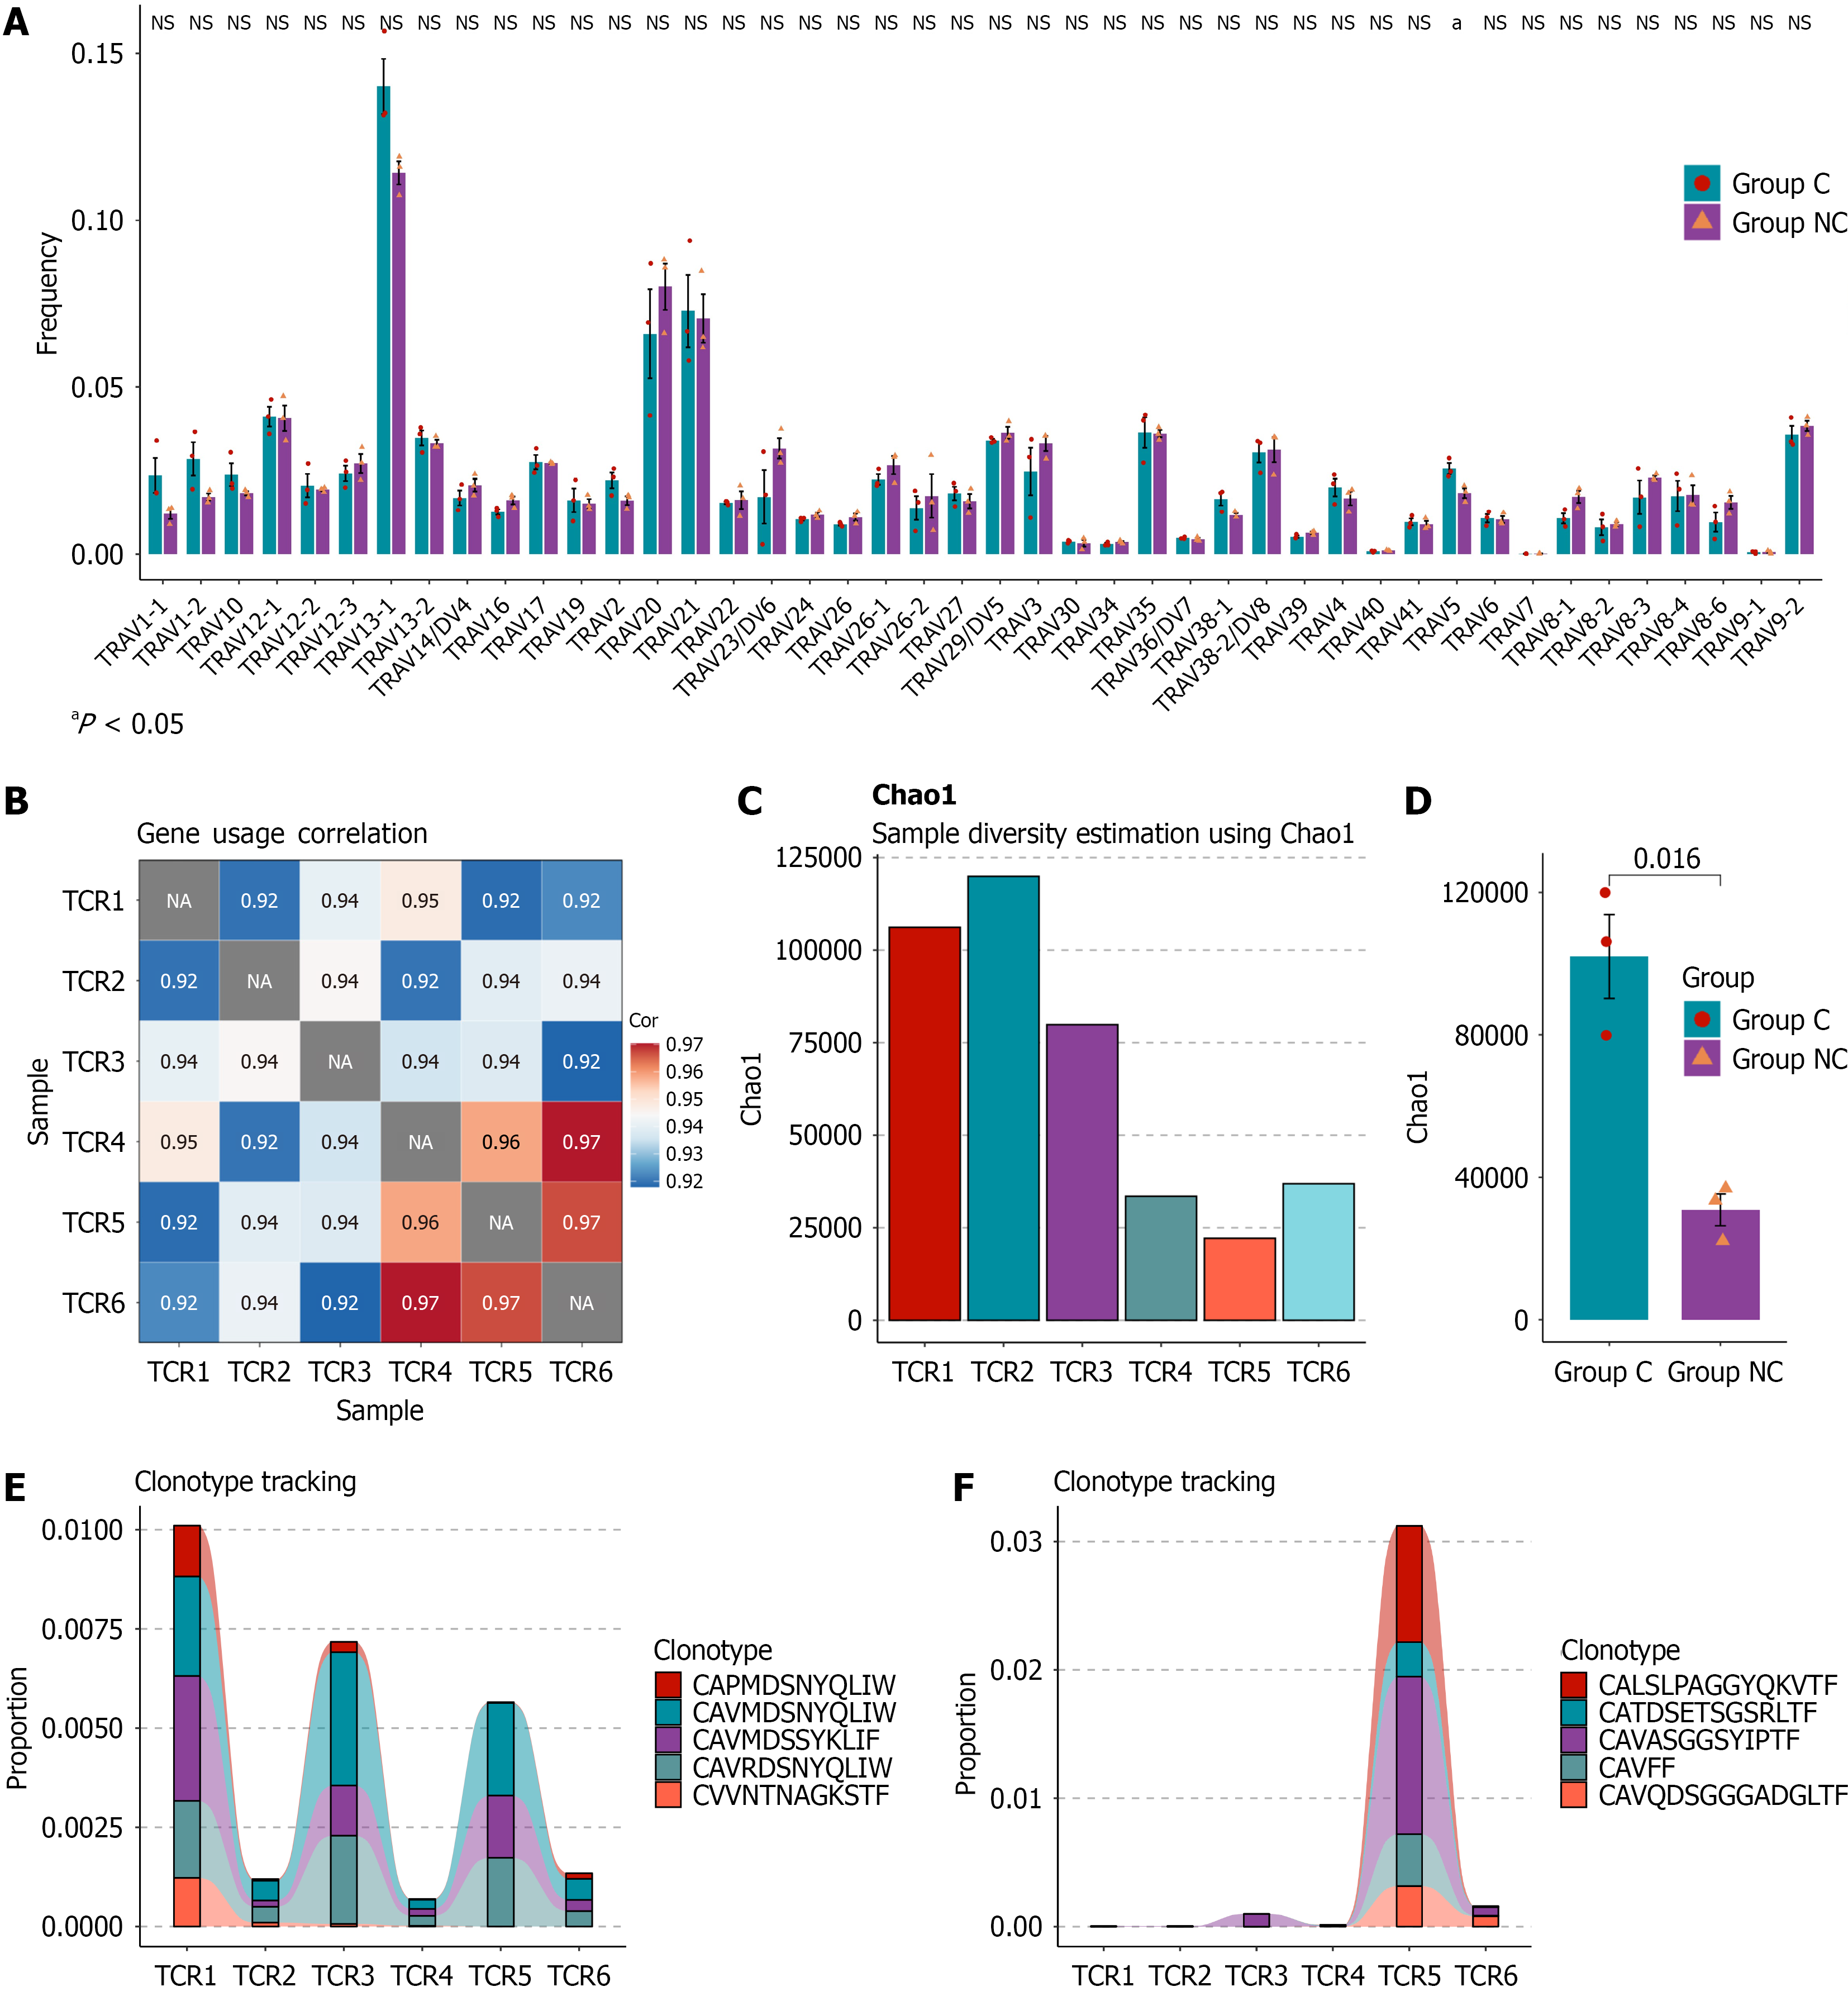
Figure 2 Comparison of T cell receptor α chain frequency and Chao1 diversity between Group-C and Group-NC.
A: Usage frequency of certain genes between the two groups; B: Correlation heatmap of gene usage; C and D: Chao1 indices between the two groups; E and F: Distribution of different clonotypes within each sample. NS: Not significant; TCR 1-3: Samples from patients in Group-C; TCR 4-6: Samples from patients in Group-NC; TCR: T cell receptor. aP < 0.05.
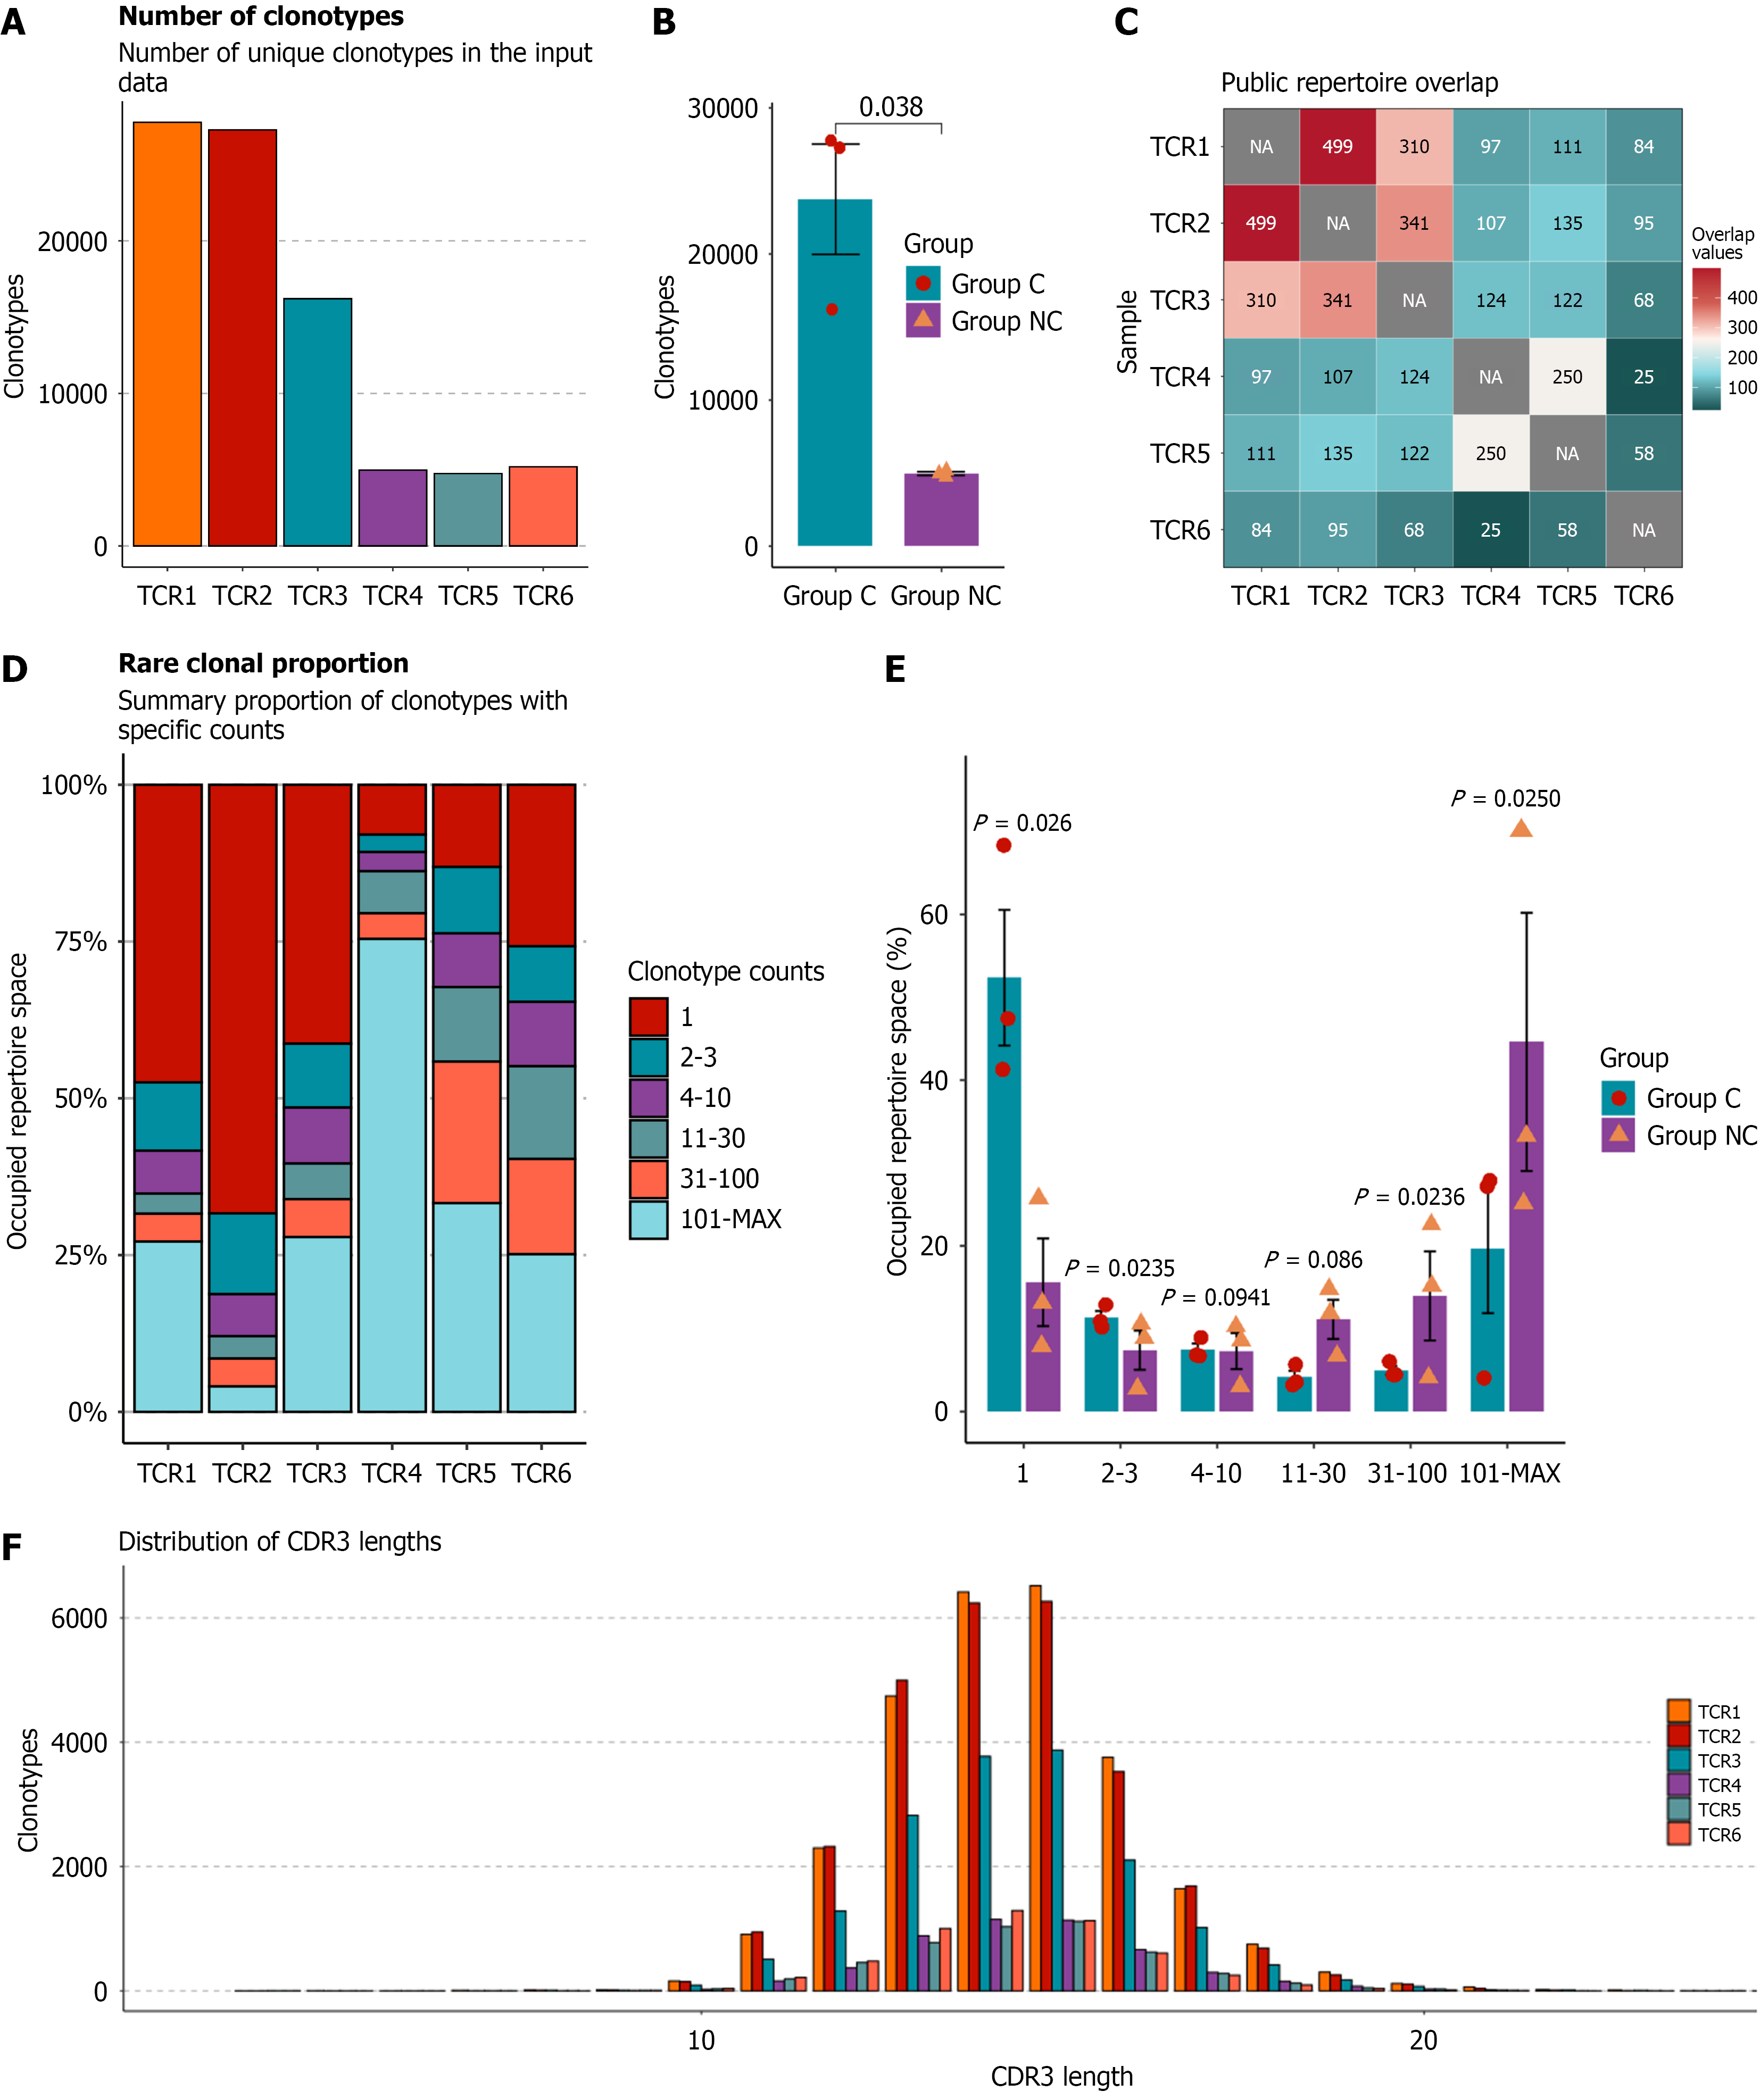
Figure 3 Comparison of T cell receptor β Chain frequency and clonotype distribution between Group-C and Group-NC.
A and B: Clonotype diversity and distribution of T cell receptor β chains; C: Public repertoire overlaps analysis on each sample; D and E: Rare clonal proportions; F: Distribution of complementarity-determining region 3 lengths. TCR 1-3: Samples from patients in Group-C; TCR 4-6: Samples from patients in Group-NC; TCR: T cell receptor.
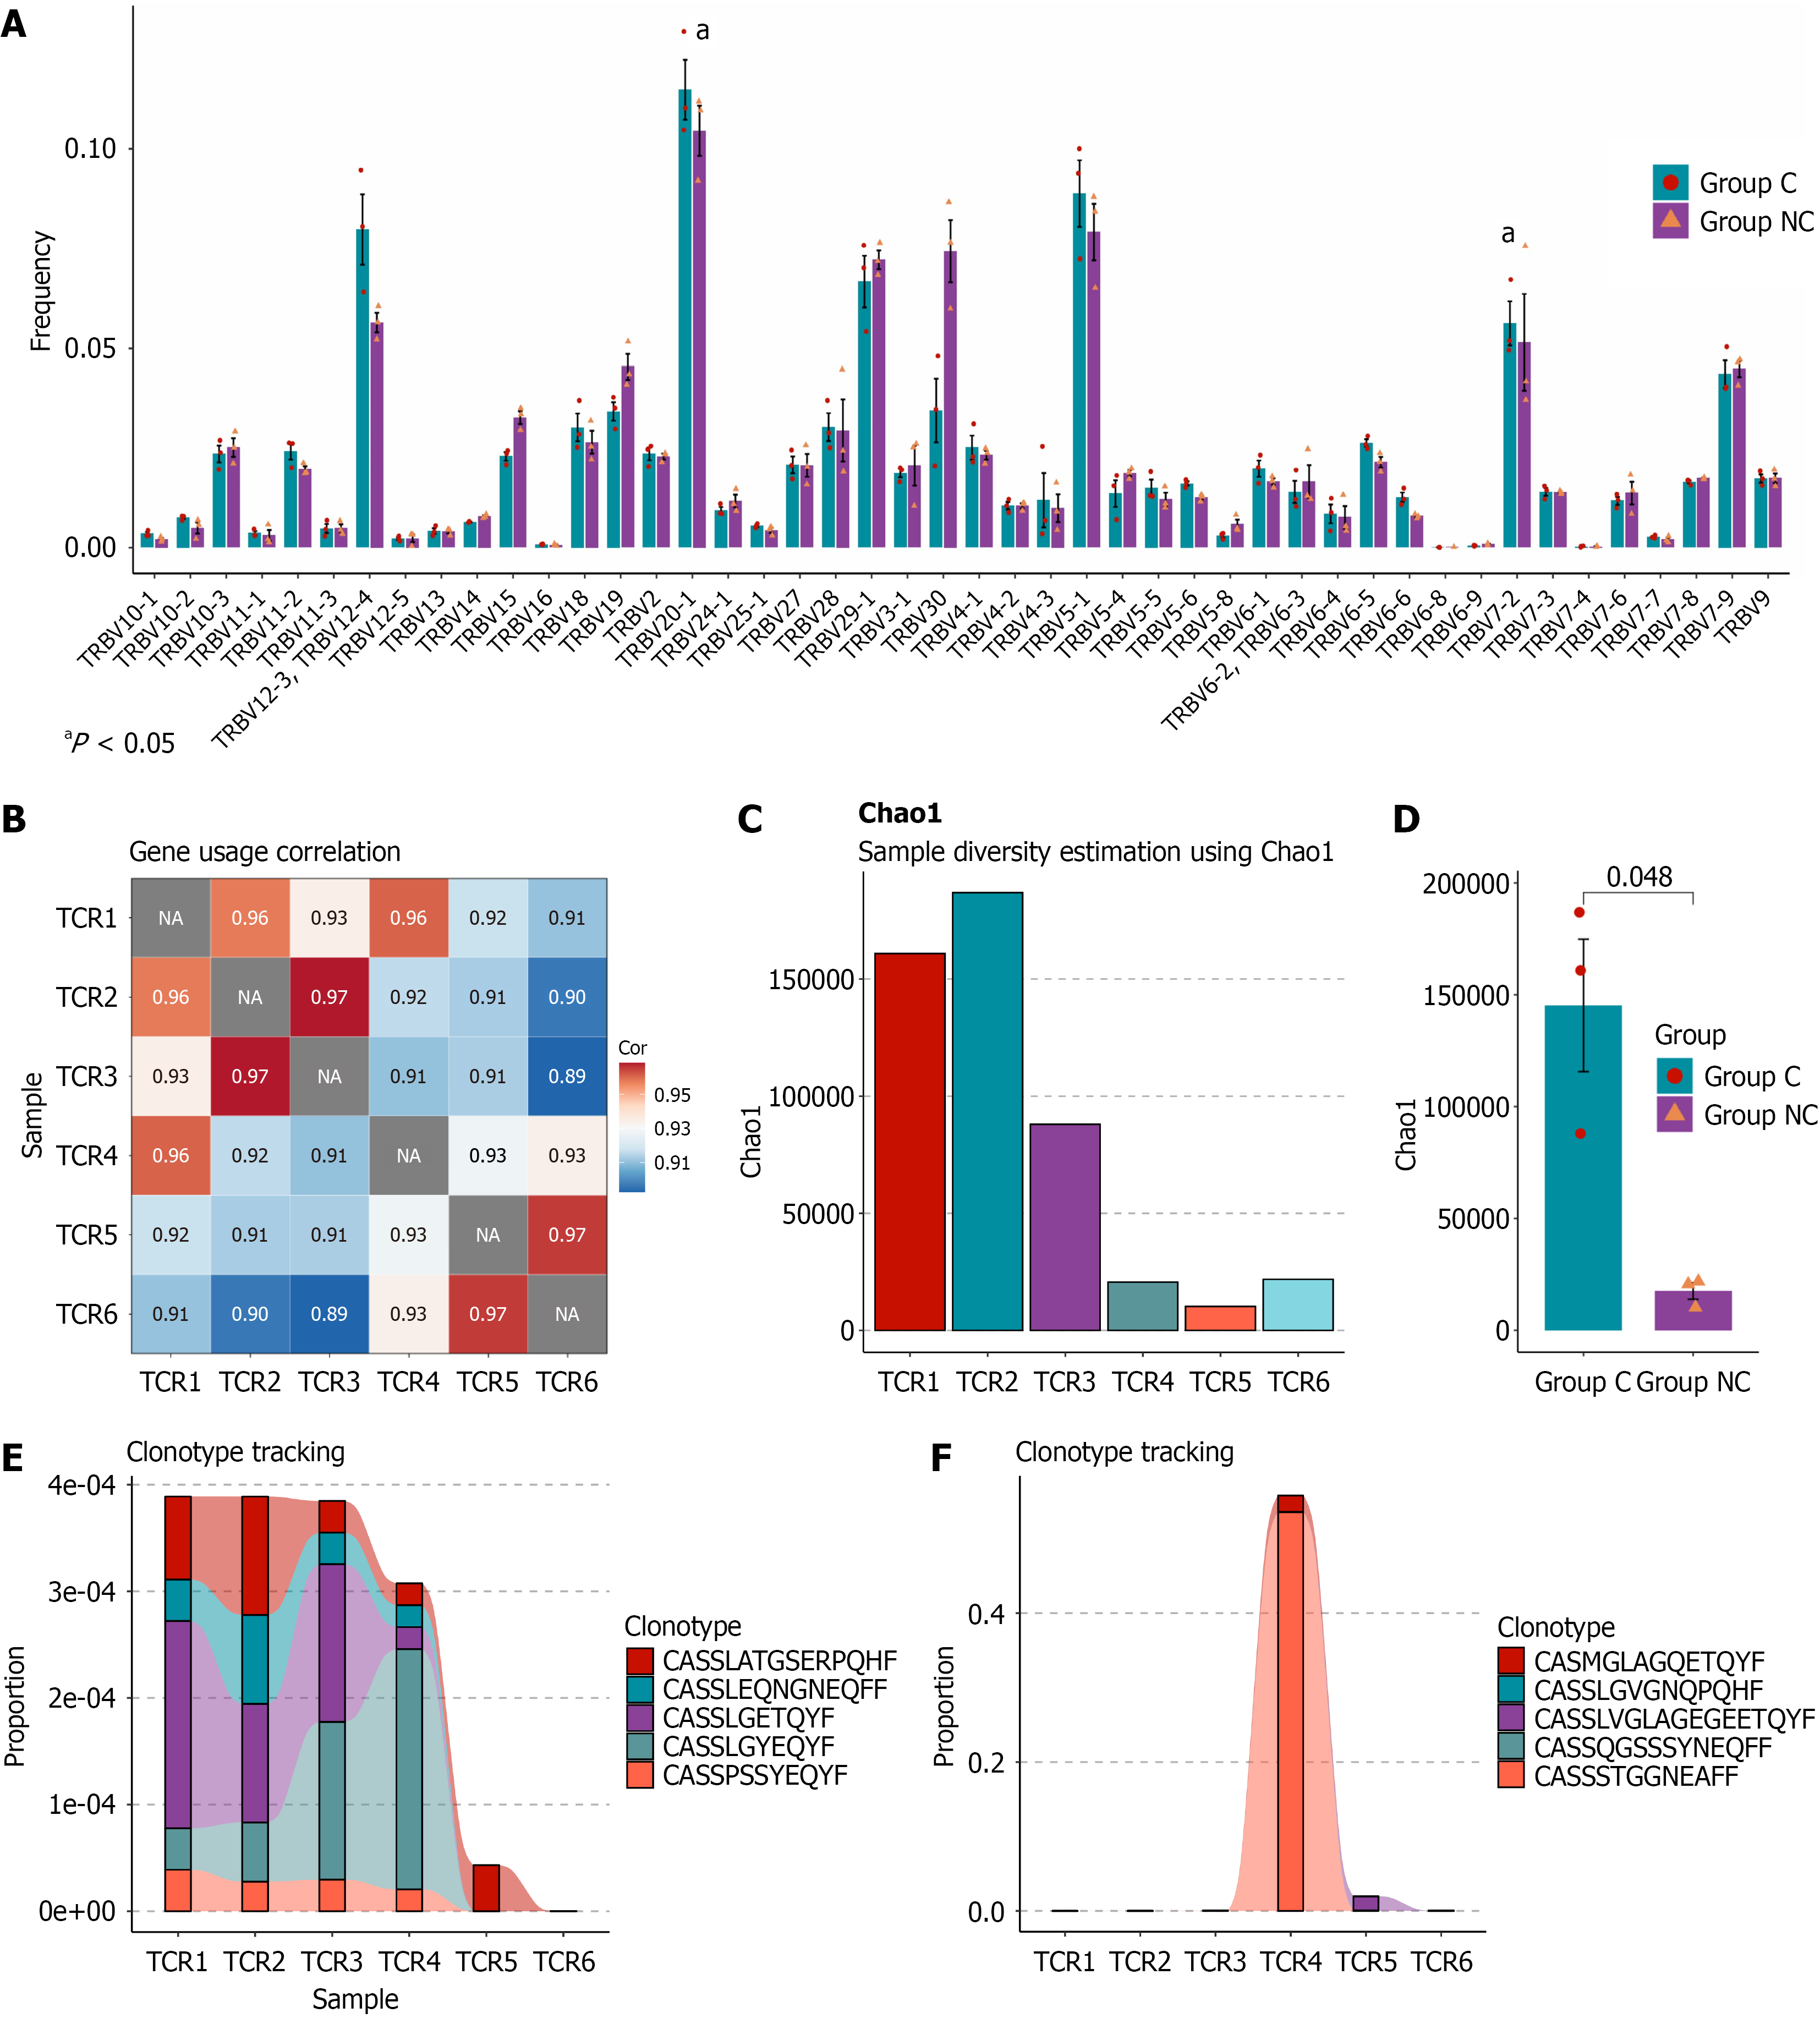
Figure 4 Comparative analysis of T cell receptor β chain usage and clonotype distribution between Group-C and Group-NC.
A: Gene frequencies of T cell receptor β chain between the two groups; B: Correlation analysis of gene usage; C: Chao1 indices in each sample; D: Comparison of Chao 1 indices between the two groups; E and F: Distribution of different clonotypes within each sample. TCR: T cell receptor. aP < 0.05.
- Citation: Hao KY, Tang L, Chen GB, Guo W, Wang ZH, Mao LP, Yu YC. Effects of pegylated interferon on T cell receptor fingerprints in chronic hepatitis B patients with/without surface antigen clearance. World J Hepatol 2026; 18(7): 123089
- URL: https://www.wjgnet.com/1948-5182/full/v18/i7/123089.htm
- DOI: https://dx.doi.org/10.4254/wjh.123089