
















Copyright: ©Author(s) 2026.
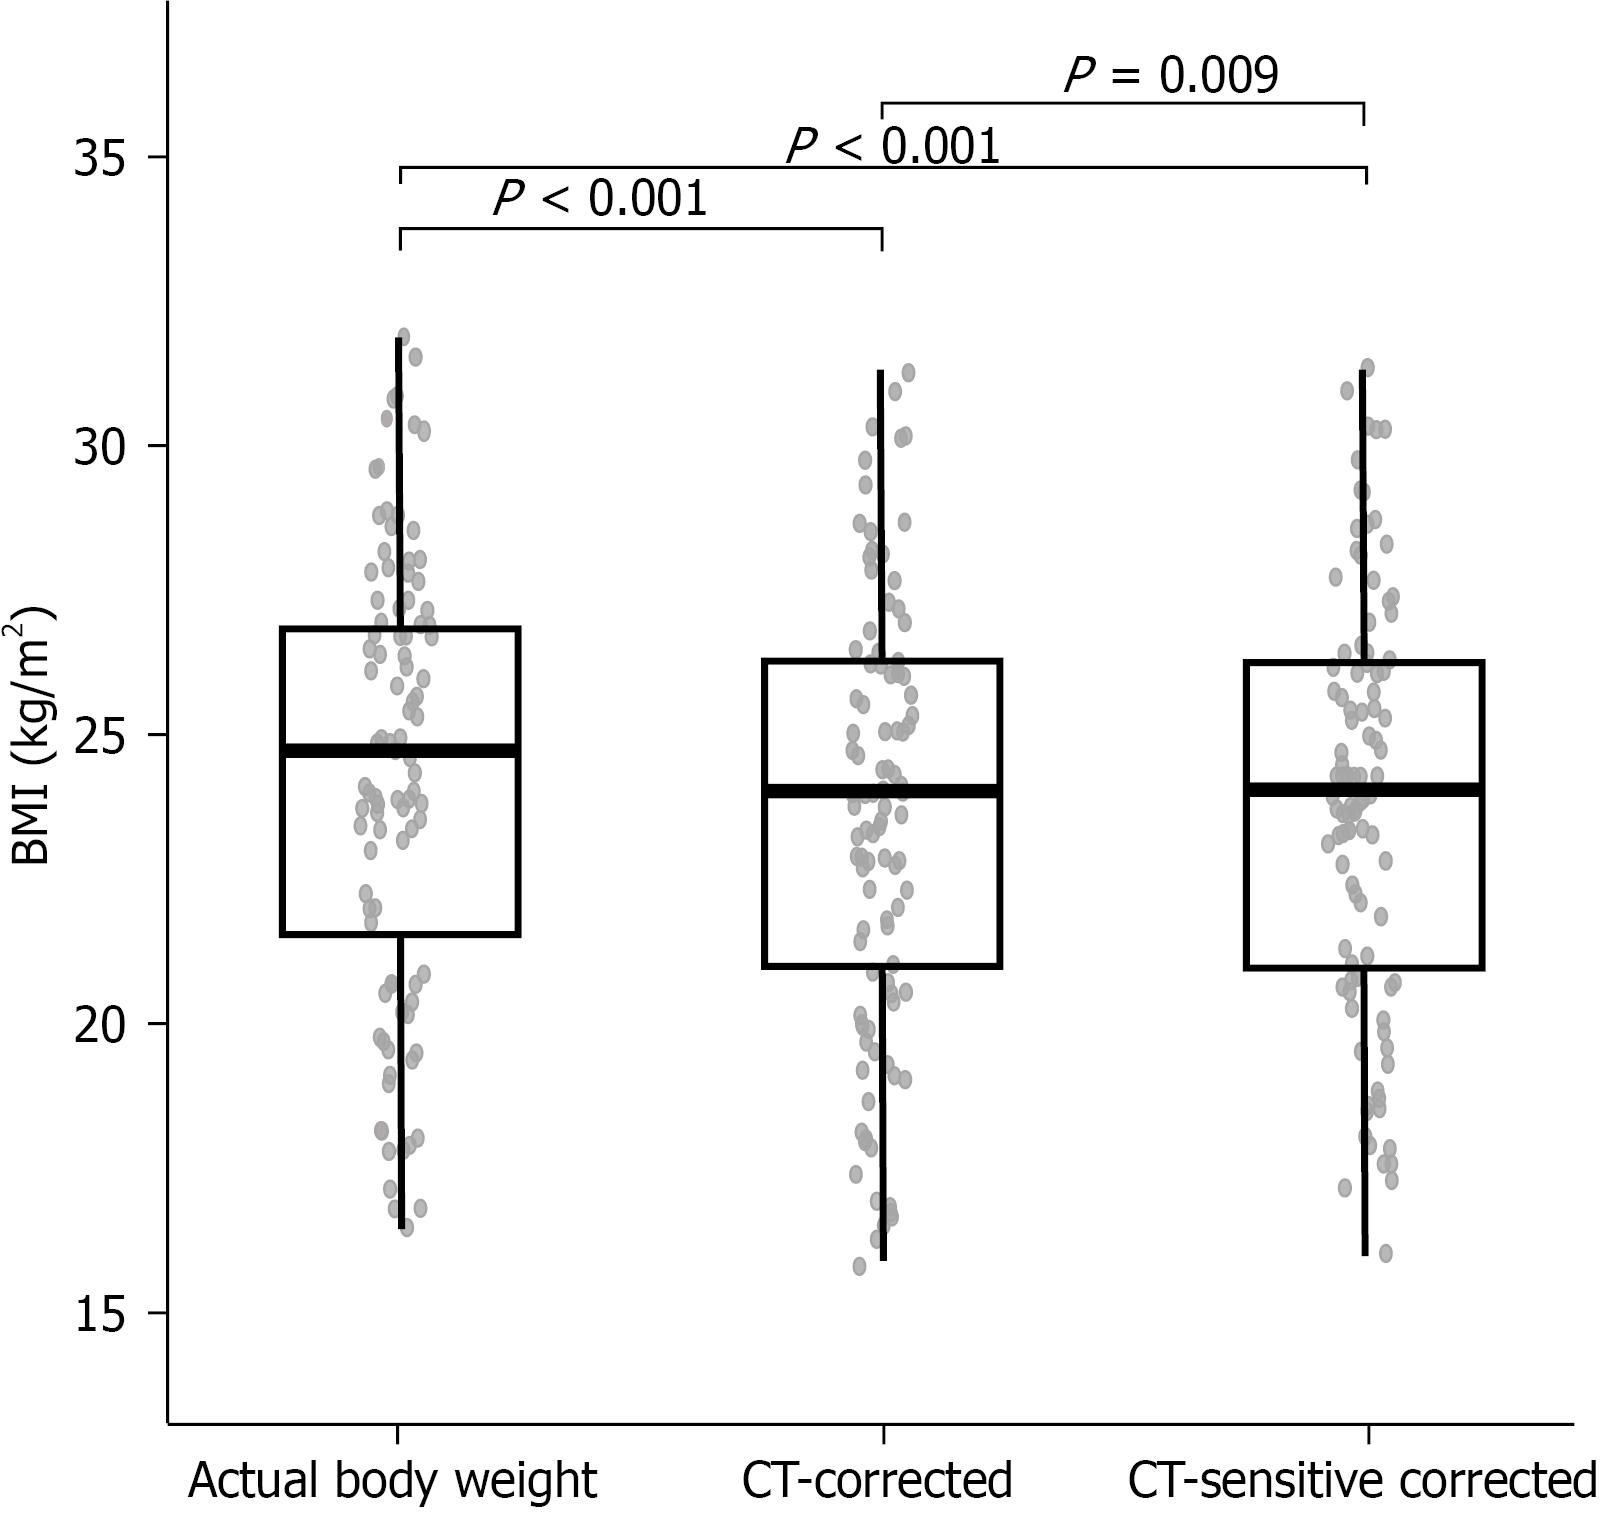
Figure 1 Distribution of the body mass index values obtained using the actual body weight method, computed tomography-corrected method, and computed tomography-sensitive corrected method in patients with cirrhosis and ascites.
The body mass index (BMI) values are presented as boxplots with individual data points. Paired comparisons were performed using the Wilcoxon signed-rank test. Both the computed tomography (CT)-corrected BMI and the CT-sensitive corrected BMI were significantly lower than the actual BMI (both P < 0.001), and the CT-sensitive corrected BMI was also lower than the CT-corrected BMI (P = 0.009). BMI: Body mass index; CT: Computed tomography.
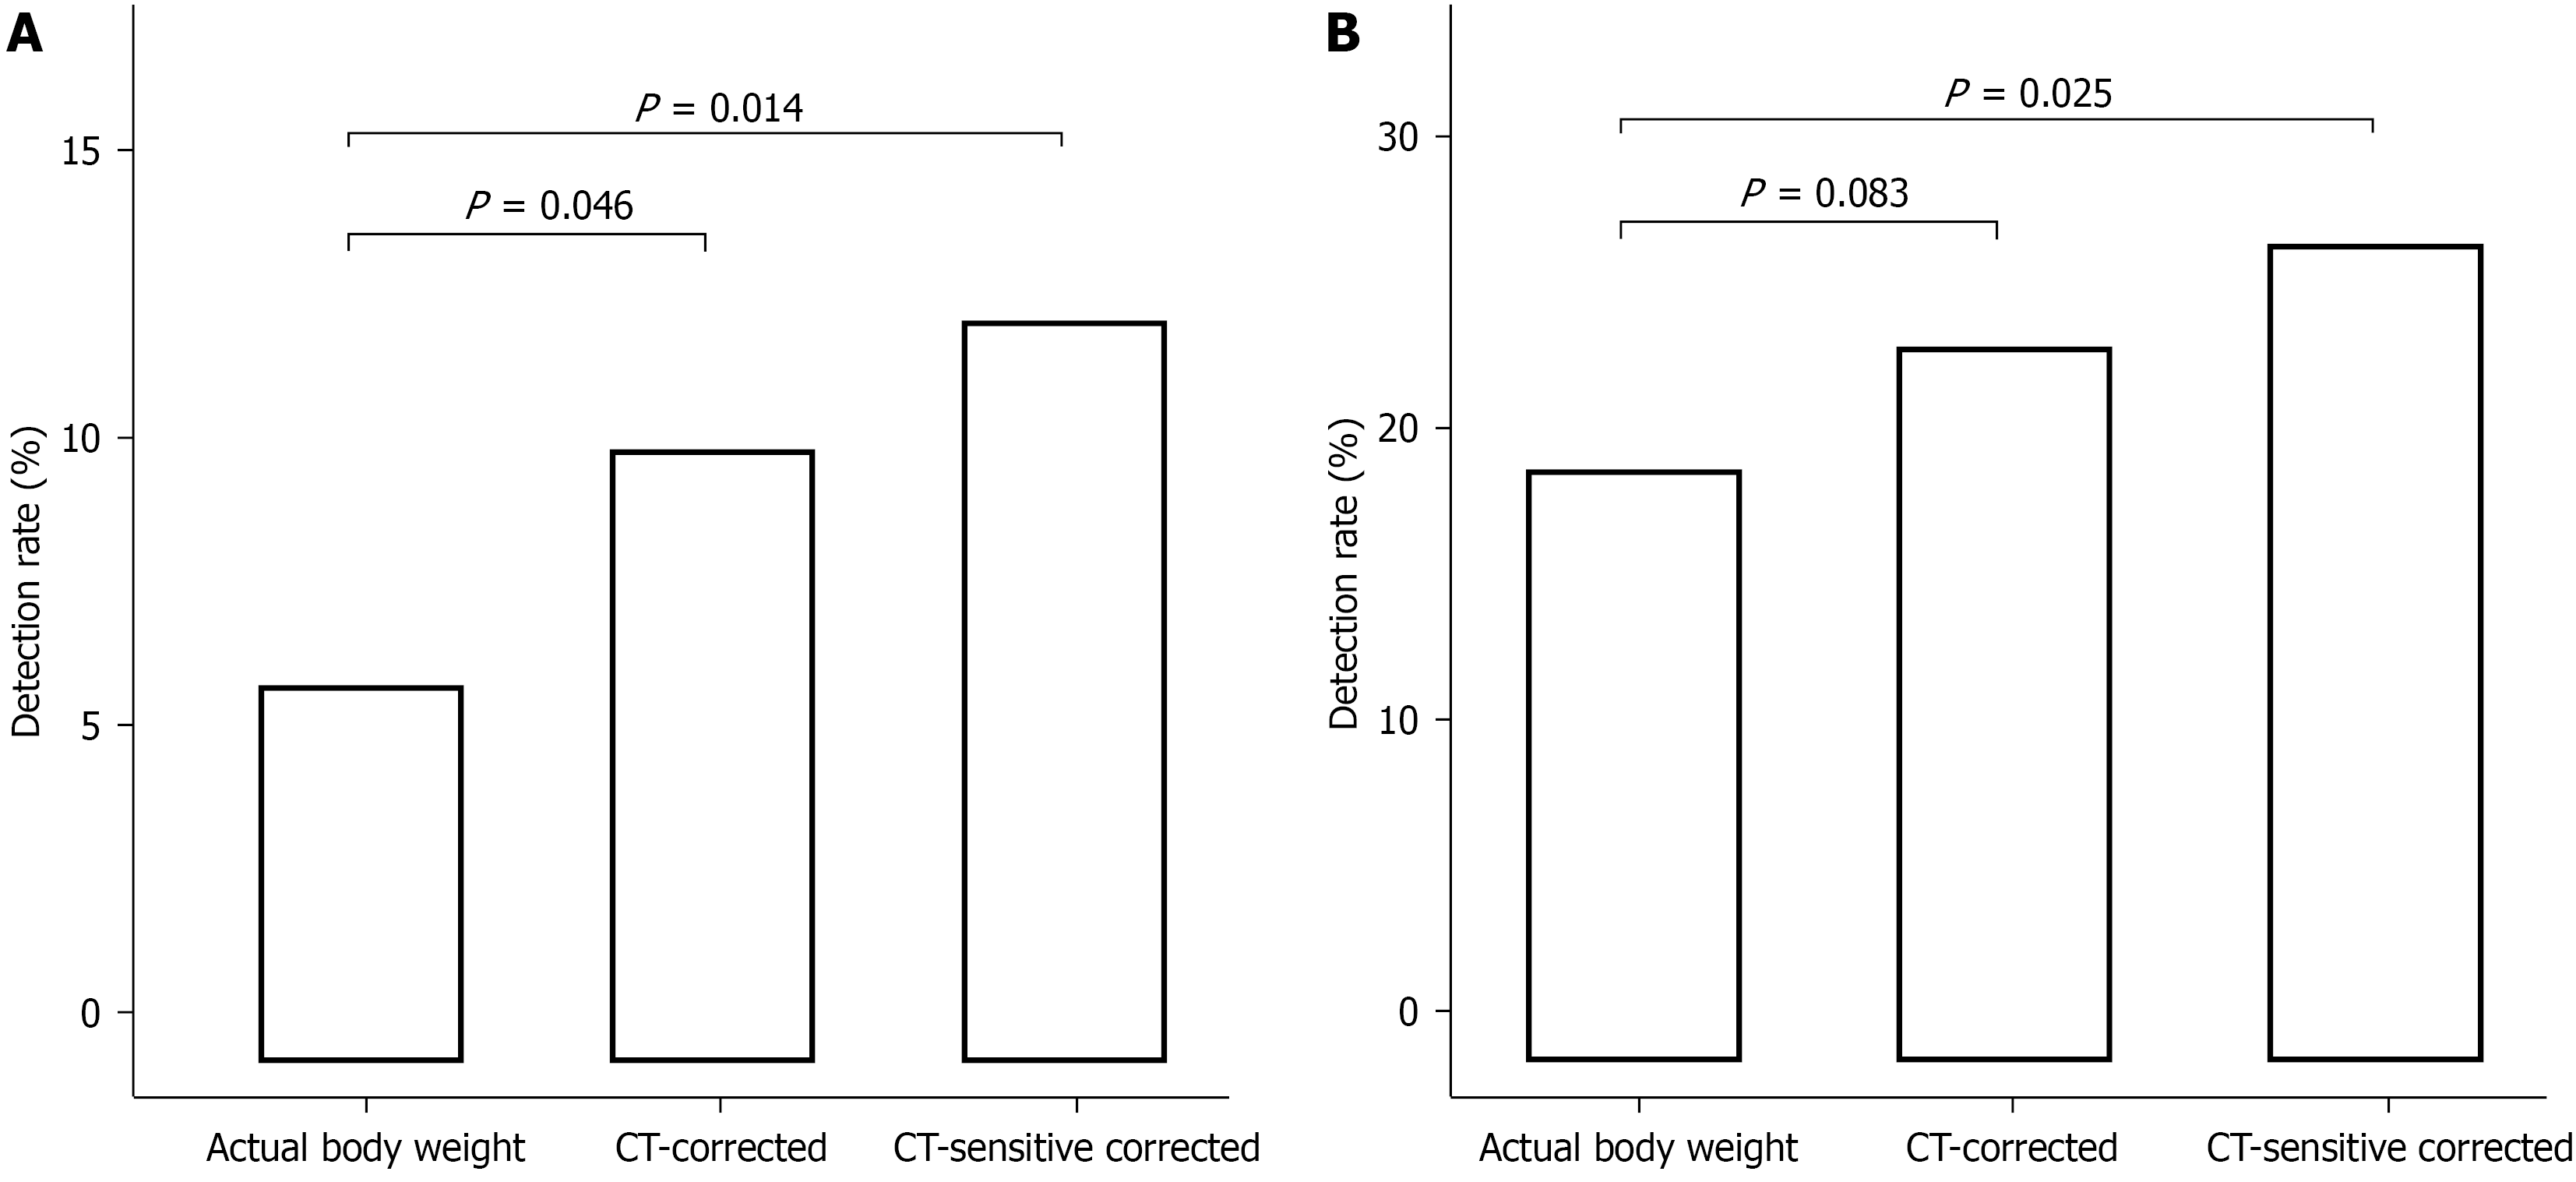
Figure 2 Comparison of low body mass index and Global Leadership Initiative on Malnutrition-defined malnutrition detection rates using the actual body weight method, computed tomography-corrected method, and computed tomography-sensitive corrected method in patients with cirrhosis and ascites.
A: Comparison of the low-body mass index (BMI) detection rates using the actual body weight method, computed tomography (CT)-corrected method, and CT-sensitive corrected method in patients with cirrhosis and ascites. A low BMI was defined according to the Global Leadership Initiative on Malnutrition (GLIM) BMI criteria for Asian populations with age stratification. Detection rates were compared using the McNemar test without continuity correction. The CT-corrected method and the CT-sensitive corrected method identified more patients with a low BMI than the actual body weight method (P = 0.046 and P = 0.014, respectively); B: Comparison of the GLIM-defined malnutrition detection rates using the actual body weight method, CT-corrected method, and CT-sensitive corrected method in patients with cirrhosis and ascites. GLIM-defined malnutrition was determined based on the presence of at least one phenotypic criterion used in this study: Unintentional weight loss > 5% within the previous 6 months, low BMI, or reduced arm muscle circumference. Detection rates were compared using the McNemar test without continuity correction. The CT-sensitive corrected method identified significantly more patients with GLIM-defined malnutrition than the actual body weight method (P = 0.025). CT: Computed tomography.
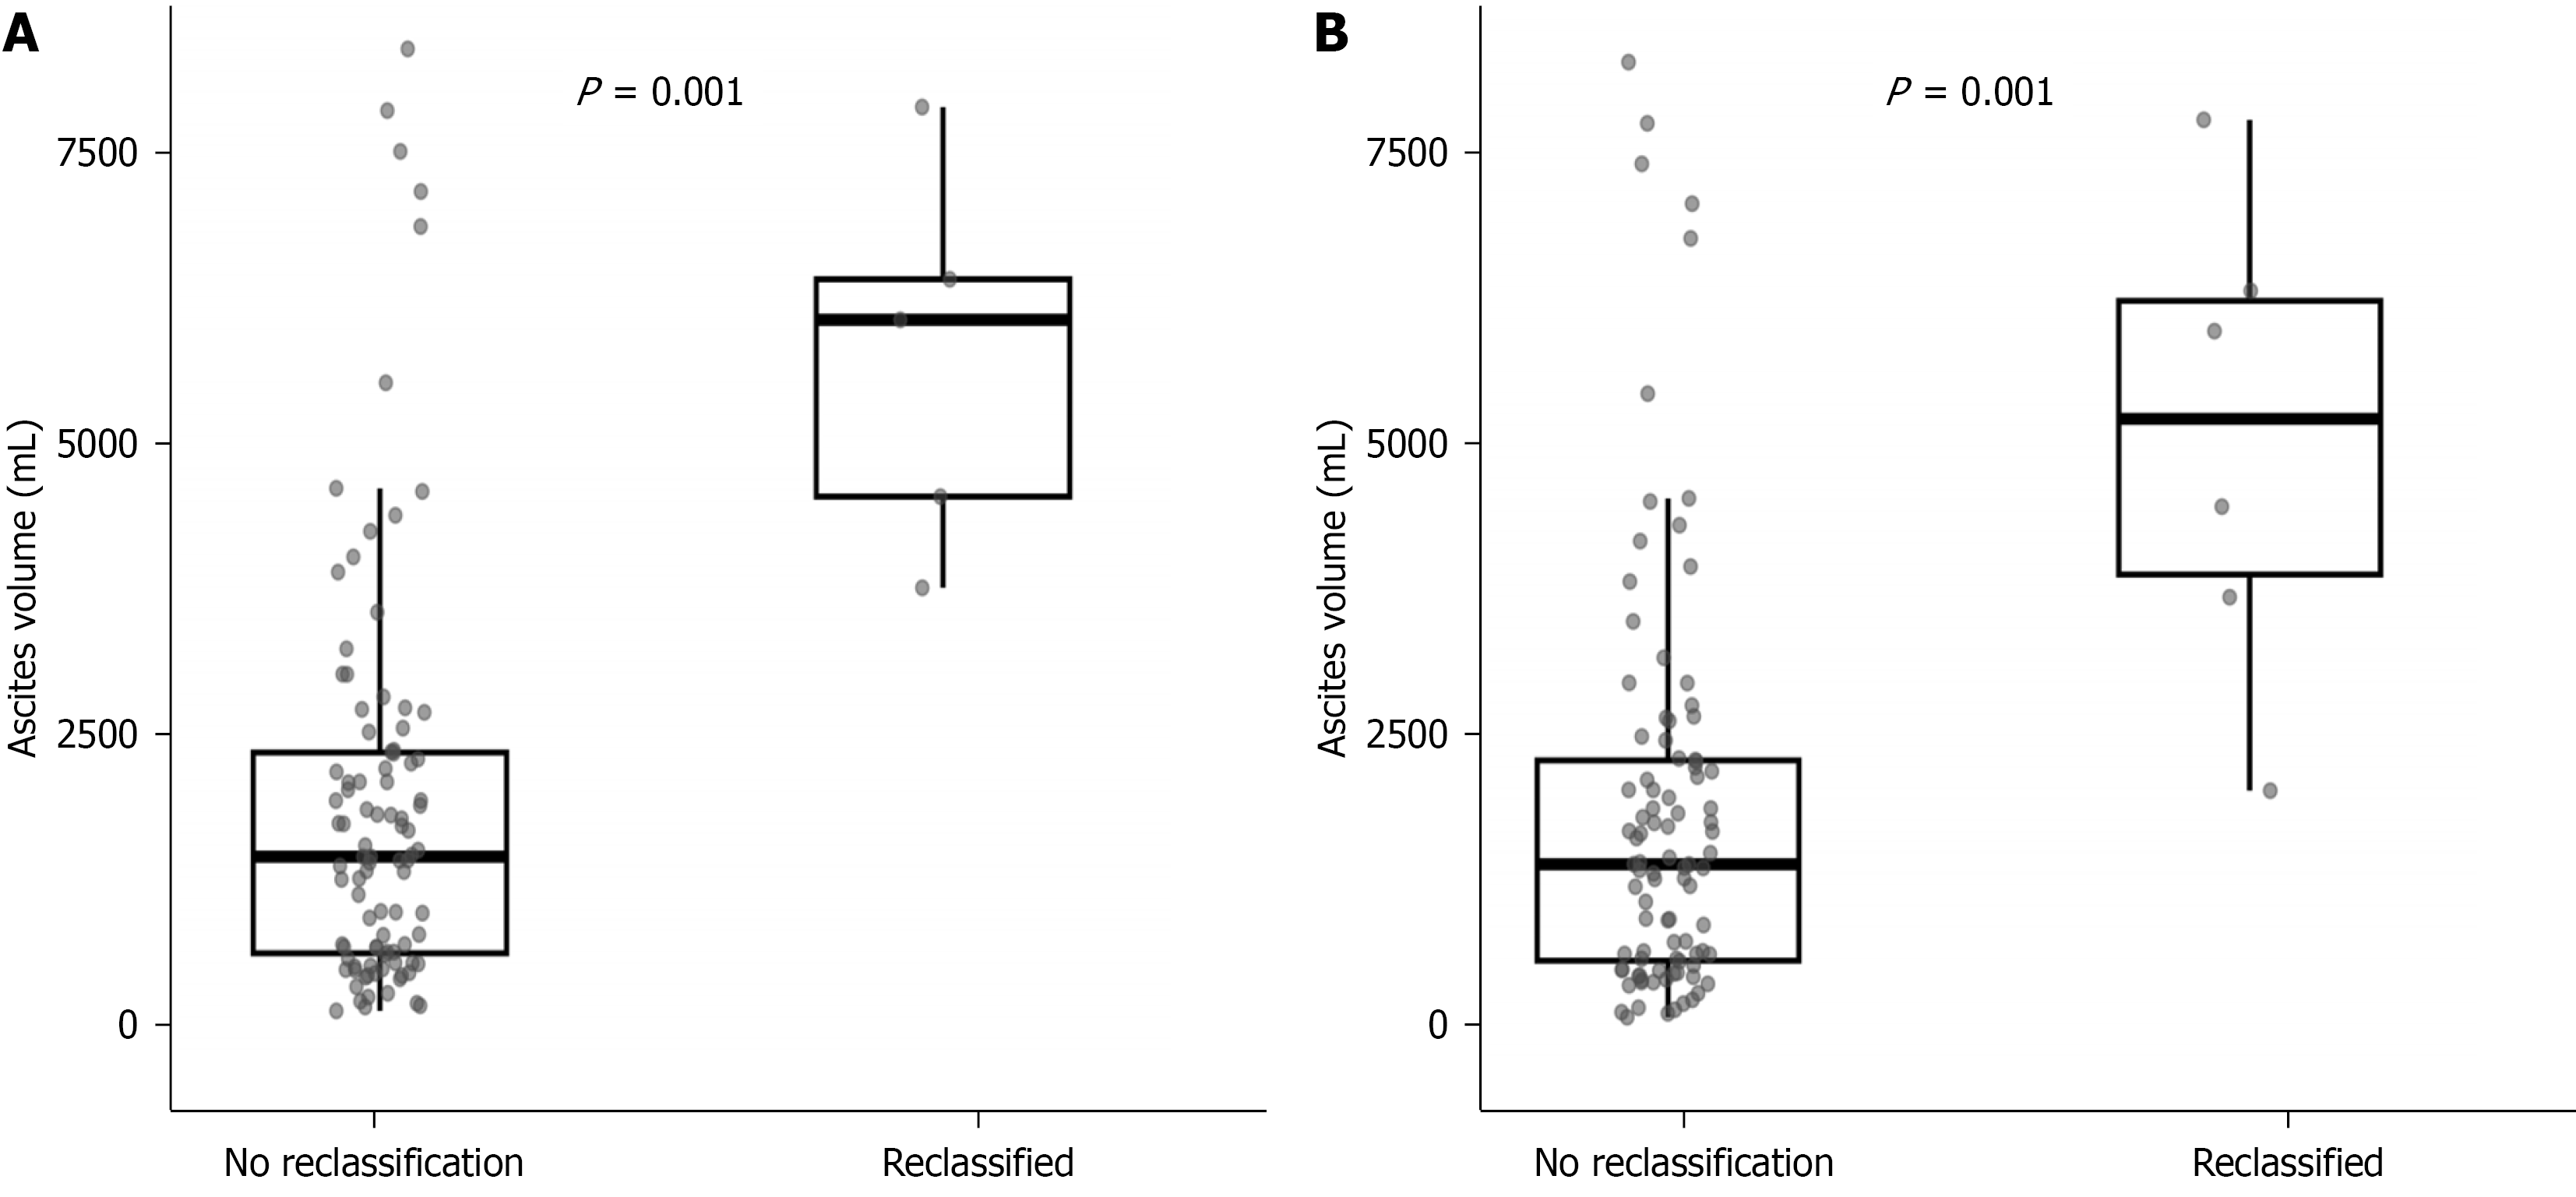
Figure 3 Comparison of ascites volume according to low body mass index and Global Leadership Initiative on Malnutrition-defined malnutrition reclassification based on the actual body weight method and computed tomography-sensitive corrected method in patients with cirrhosis and ascites.
A: Comparison of the ascites volume between patients with and without low- body mass index (BMI) reclassification based on the actual body weight method vs the computed tomography (CT)-sensitive corrected method. Low-BMI reclassification was defined as discordant low-BMI classification between the two methods. The ascites volume is presented as boxplots with individual data points. Groups were compared using the Wilcoxon rank-sum test. Patients with a low-BMI reclassification had a significantly larger ascites volume than those without reclassification (P = 0.001); B: Comparison of the ascites volume between patients with and without Global Leadership Initiative on Malnutrition (GLIM)-defined malnutrition reclassification based on the actual body weight method vs the CT-sensitive corrected method. GLIM-defined malnutrition reclassification was defined as a discordant GLIM classification between the two methods. The ascites volume is presented as boxplots with individual data points. Groups were compared using the Wilcoxon rank-sum test. Patients with GLIM-defined malnutrition reclassification had a significantly larger ascites volume than those without reclassification (P = 0.001).
- Citation: Zhao HJ, Su LH, Lu FH, Gao F, Sai JH, Li P, Shi JL, Wang L, Li SJ, Zhou F, Zhou LM, Wang N, He PY. Computed tomography-based correction of the body mass index improves malnutrition detection in patients with cirrhosis and ascites. World J Hepatol 2026; 18(7): 122692
- URL: https://www.wjgnet.com/1948-5182/full/v18/i7/122692.htm
- DOI: https://dx.doi.org/10.4254/wjh.122692