
















Copyright: ©Author(s) 2026.
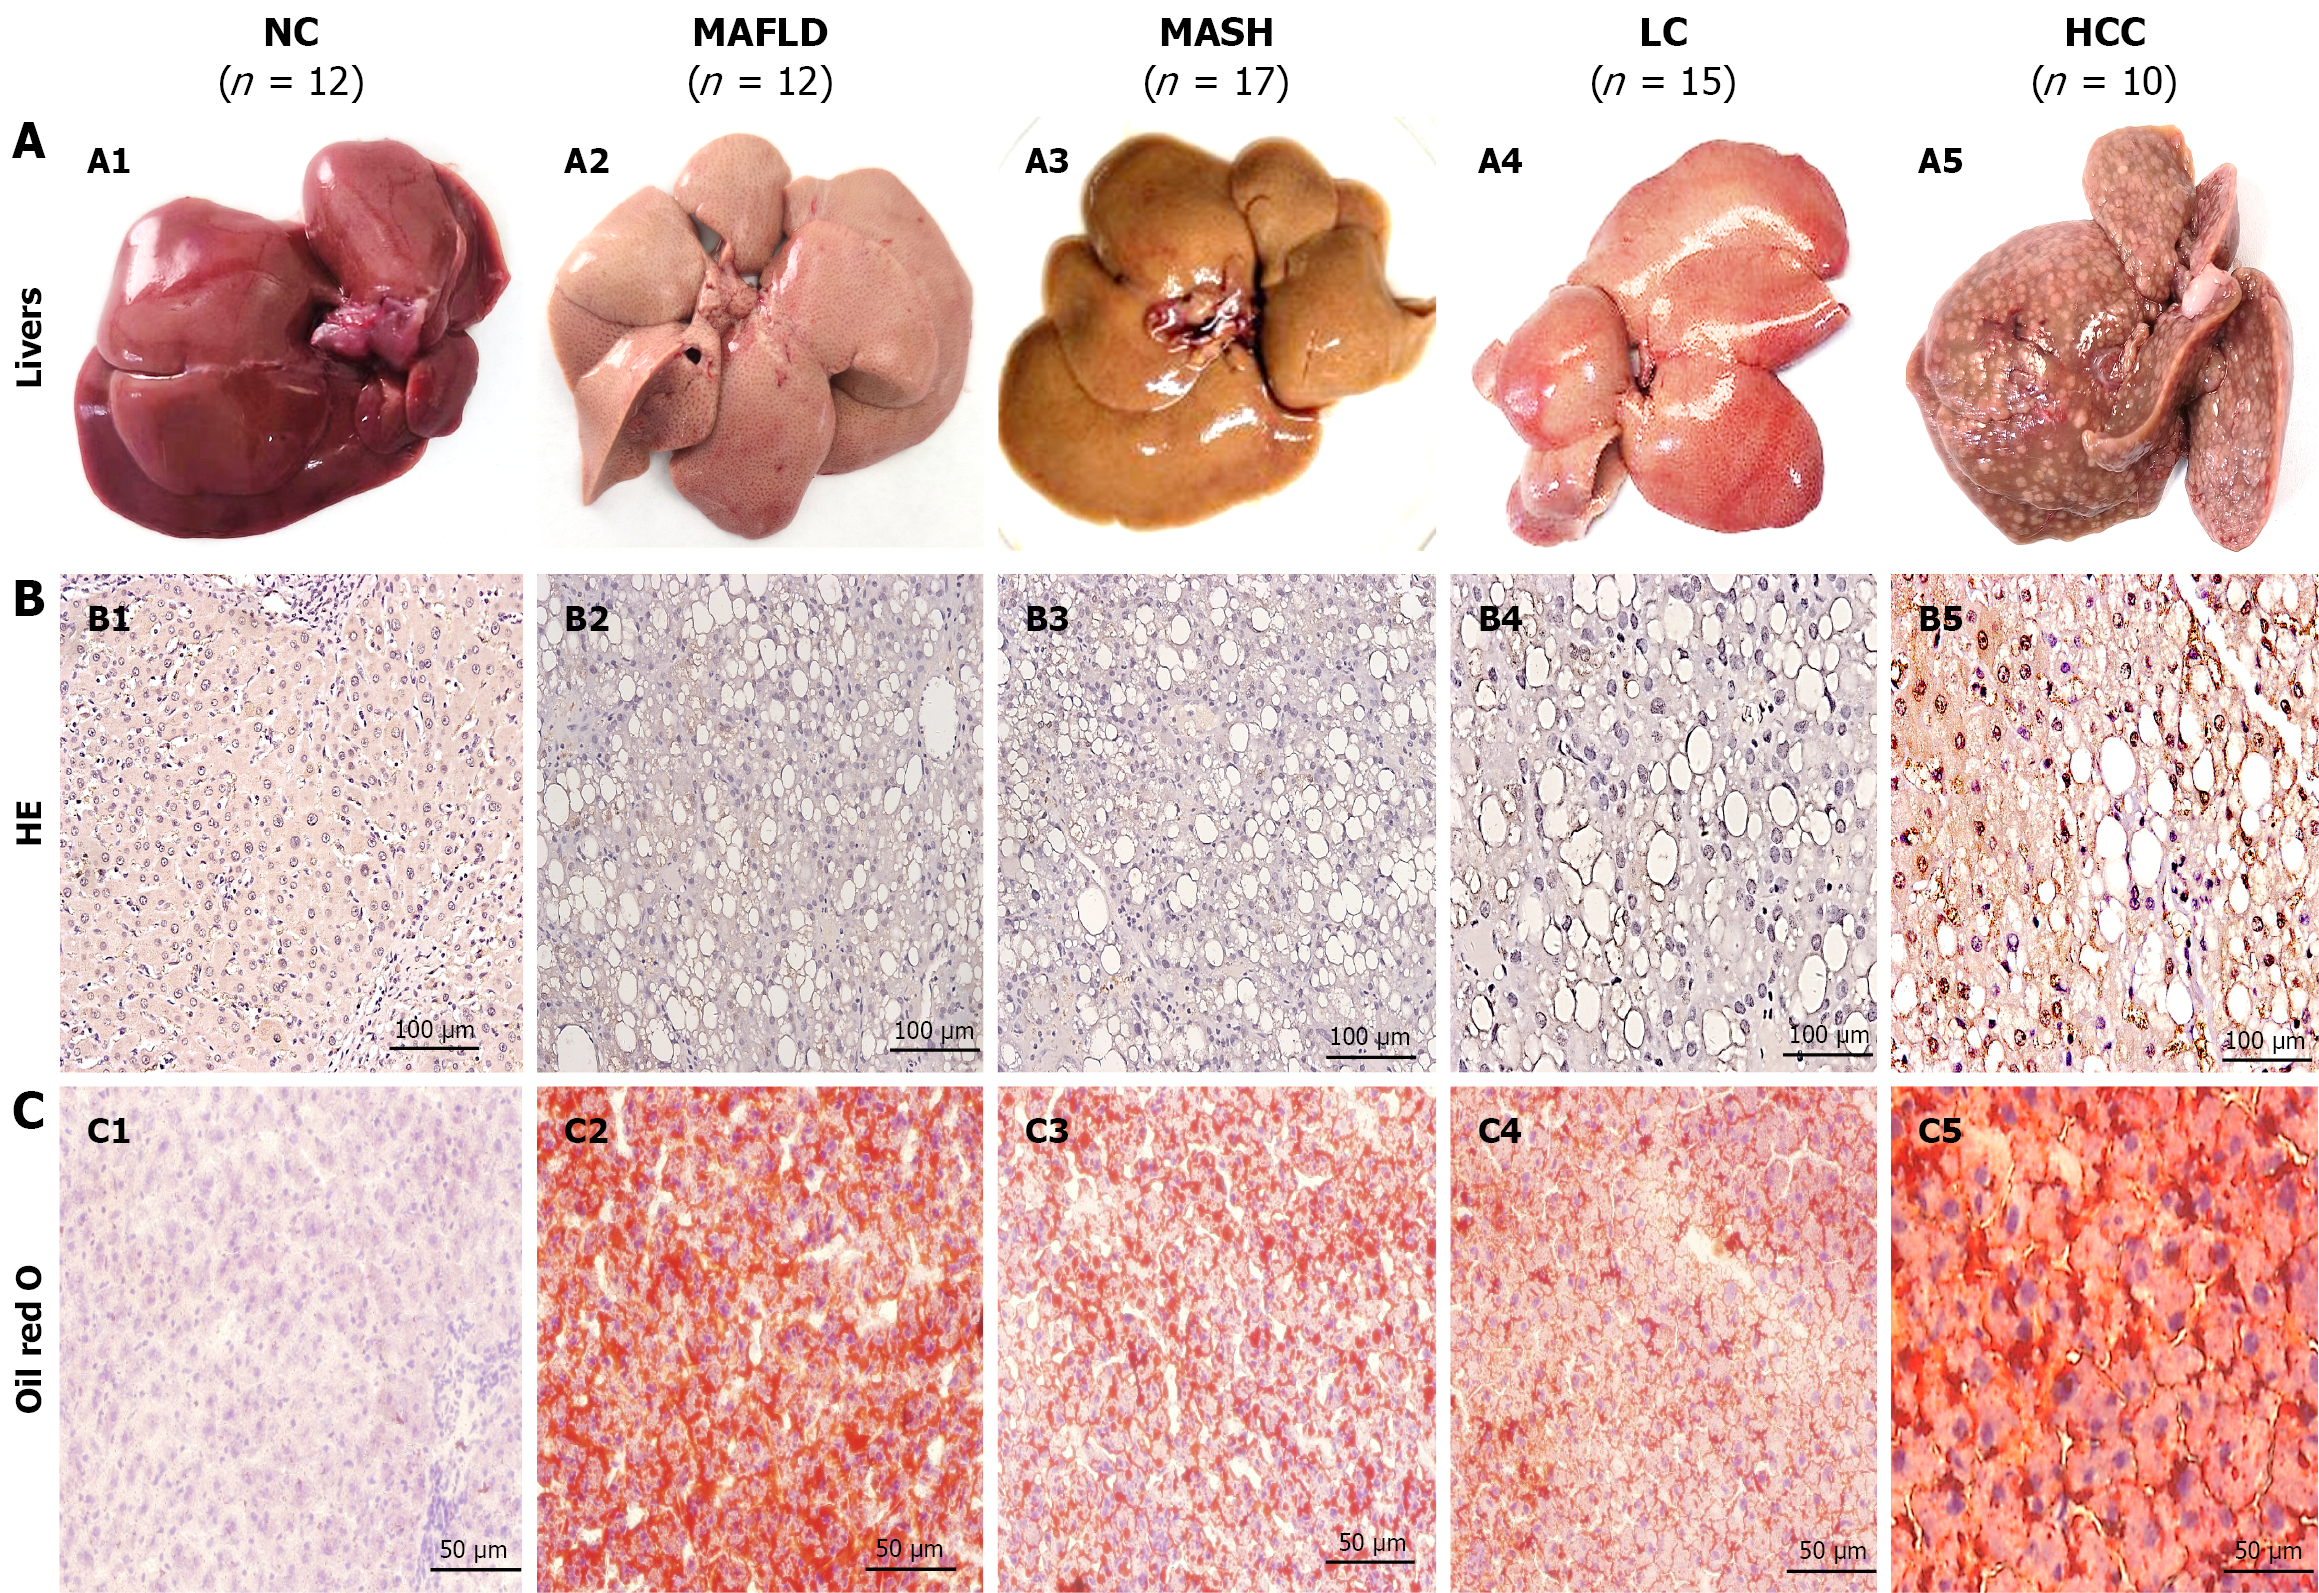
Figure 1 Rat liver histopathological grouping and lipid accumulations.
A: Livers from rats fed a normal diet (A1), a high-fat diet (HFD, A2), or a high-fat diet plus 2-fluorenyl acetamide at the early (A3), middle (A4) or last stage (A5); B: Histopathological groupings of the normal control (B1, n = 12), metabolic dysfunction-associated fatty liver disease (B2, n = 12), metabolic dysfunction-associated steatohepatitis (B3, n = 17), liver cirrhosis (B4, n = 15) and hepatocellular carcinoma (B5, n = 10) groups; C: Sections corresponding to the above livers were subjected to Oil Red O staining, and lipid accumulations in hepatocytes from metabolic dysfunction-associated steatohepatitis (C2), metabolic dysfunction-associated steatohepatitis (C3), liver cirrhosis (C4) and hepatocellular carcinoma (C5) rats but not from normal control rats (C1) were evaluated. NC: Normal control; MAFLD: Metabolic dysfunction-associated fatty liver disease; MASH: Metabolic dysfunction-associated steatohepatitis; LC: Liver cirrhosis; HCC: Hepatocellular carcinoma; HE: Hematoxylin and eosin.
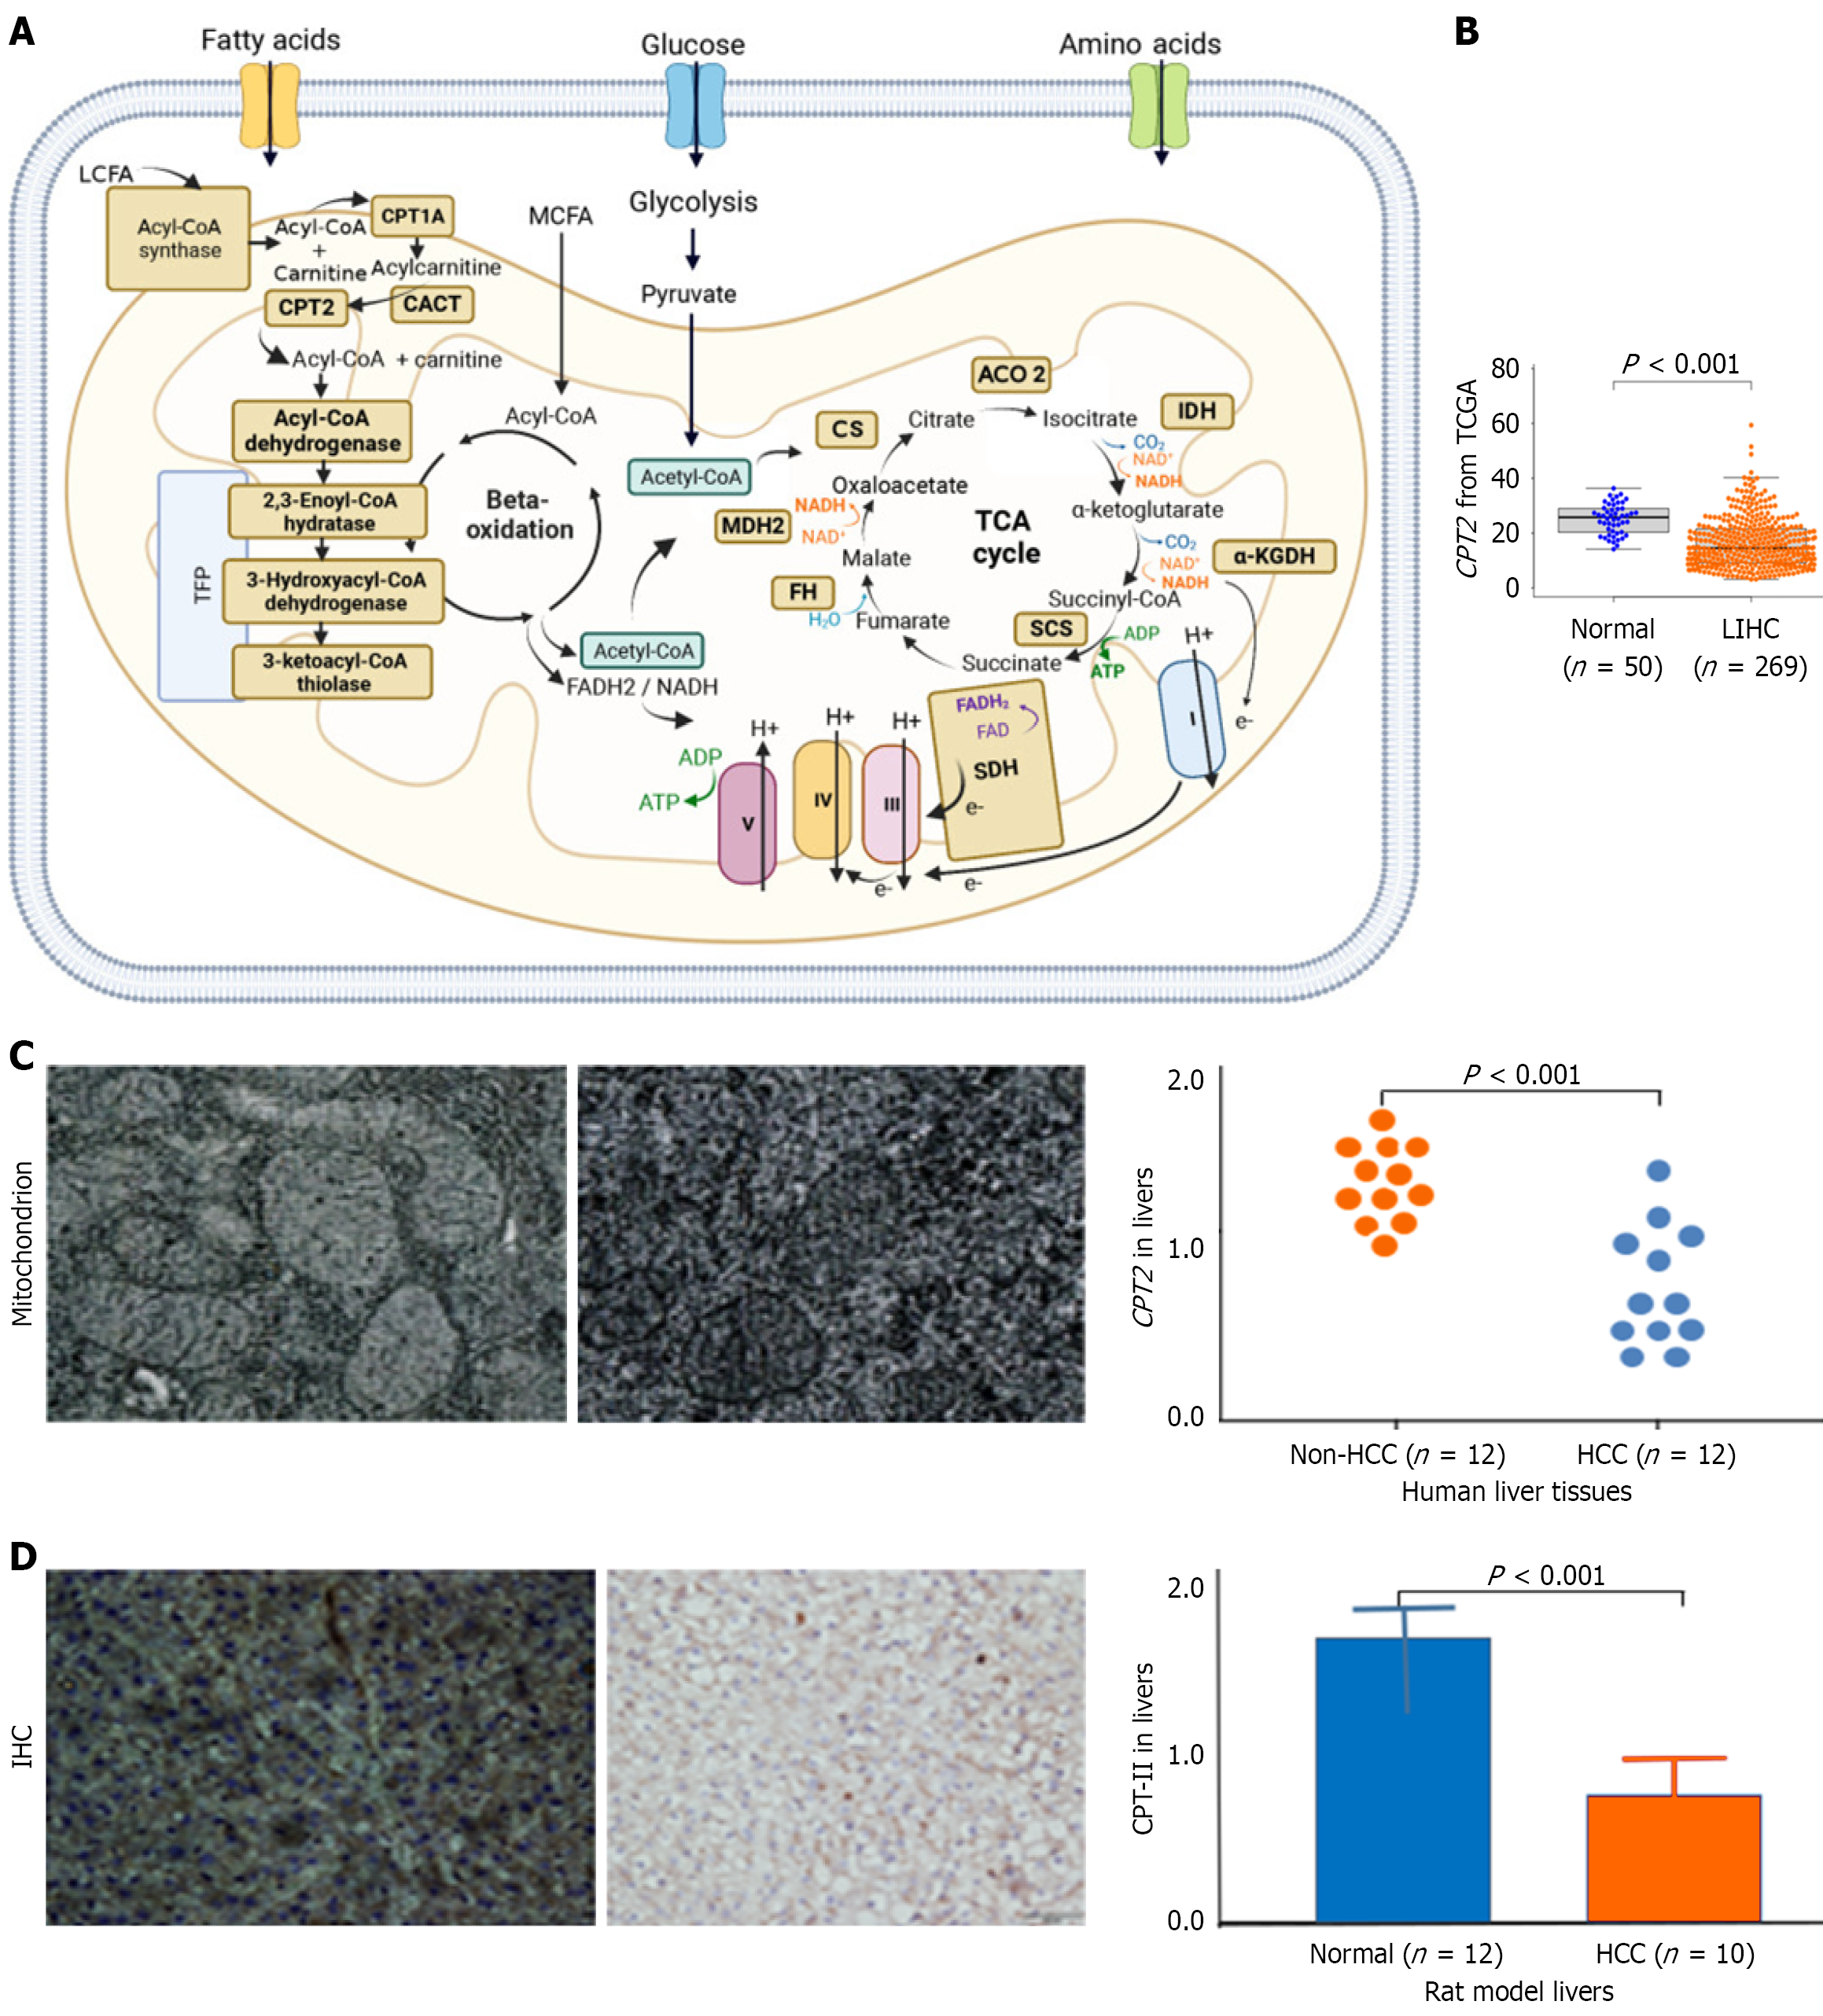
Figure 2 Mitochondrial damage and CPT2/CPT-II during lipid accumulation.
A: CPT2 located on the mitochondrial membrane; B: Comparison of liver CPT2 expressions between healthy liver (n = 50) and hepatocellular carcinoma (HCC) tissues (n = 269, liver hepatocellular carcinoma) from The Cancer Genome Atlas database; C: Damaged mitochondria and CPT2 expressions in human liver tissues: (1) Upper left: Mitochondria in non-HCC (n = 12); and (2) Upper right: Damaged mitochondria in HCC tissues (n = 12); D: CPT-II expressions between healthy liver (n = 12) and HCC (n = 10) tissues from the rat models. cP < 0.001 vs the NC or noncancerous group. LCFA: Long-chain fatty acid; CPT2: Carnitine palmitoyl transferase II gene; CPT1A: Carnitine palmitoyl transferase 1a; CACT: Carnitine acylcarnitine translocase; Acyl-CoA: Acyl coenzyme A; ACO2: Aconitase 2; IDH: Isocitrate dehydrogenase; NAD: Nicotinamide adenine dinucleotide; NADH: Nicotinamide adenine dinucleotide-1; α-KGDH: Α-Ketoglutarate dehydrogenase; MDH2: Malate dehydrogenase 2; TCA: Tricarboxylic acid cycle; FADH1: Nicotinamide adenine dinucleotide phosphate1; SDH: Saccharopine dehydrogenase; ATP: Adenosine triphosphate; ADP: Adenosine diphosphate; TCGA: The Cancer Genome Atlas; CPT-II: Carnitine palmitoyl transferase II; IHC: Immunohistochemistry; HCC: Hepatocellular carcinoma; LIHC: Liver hepatocellular carcinoma.
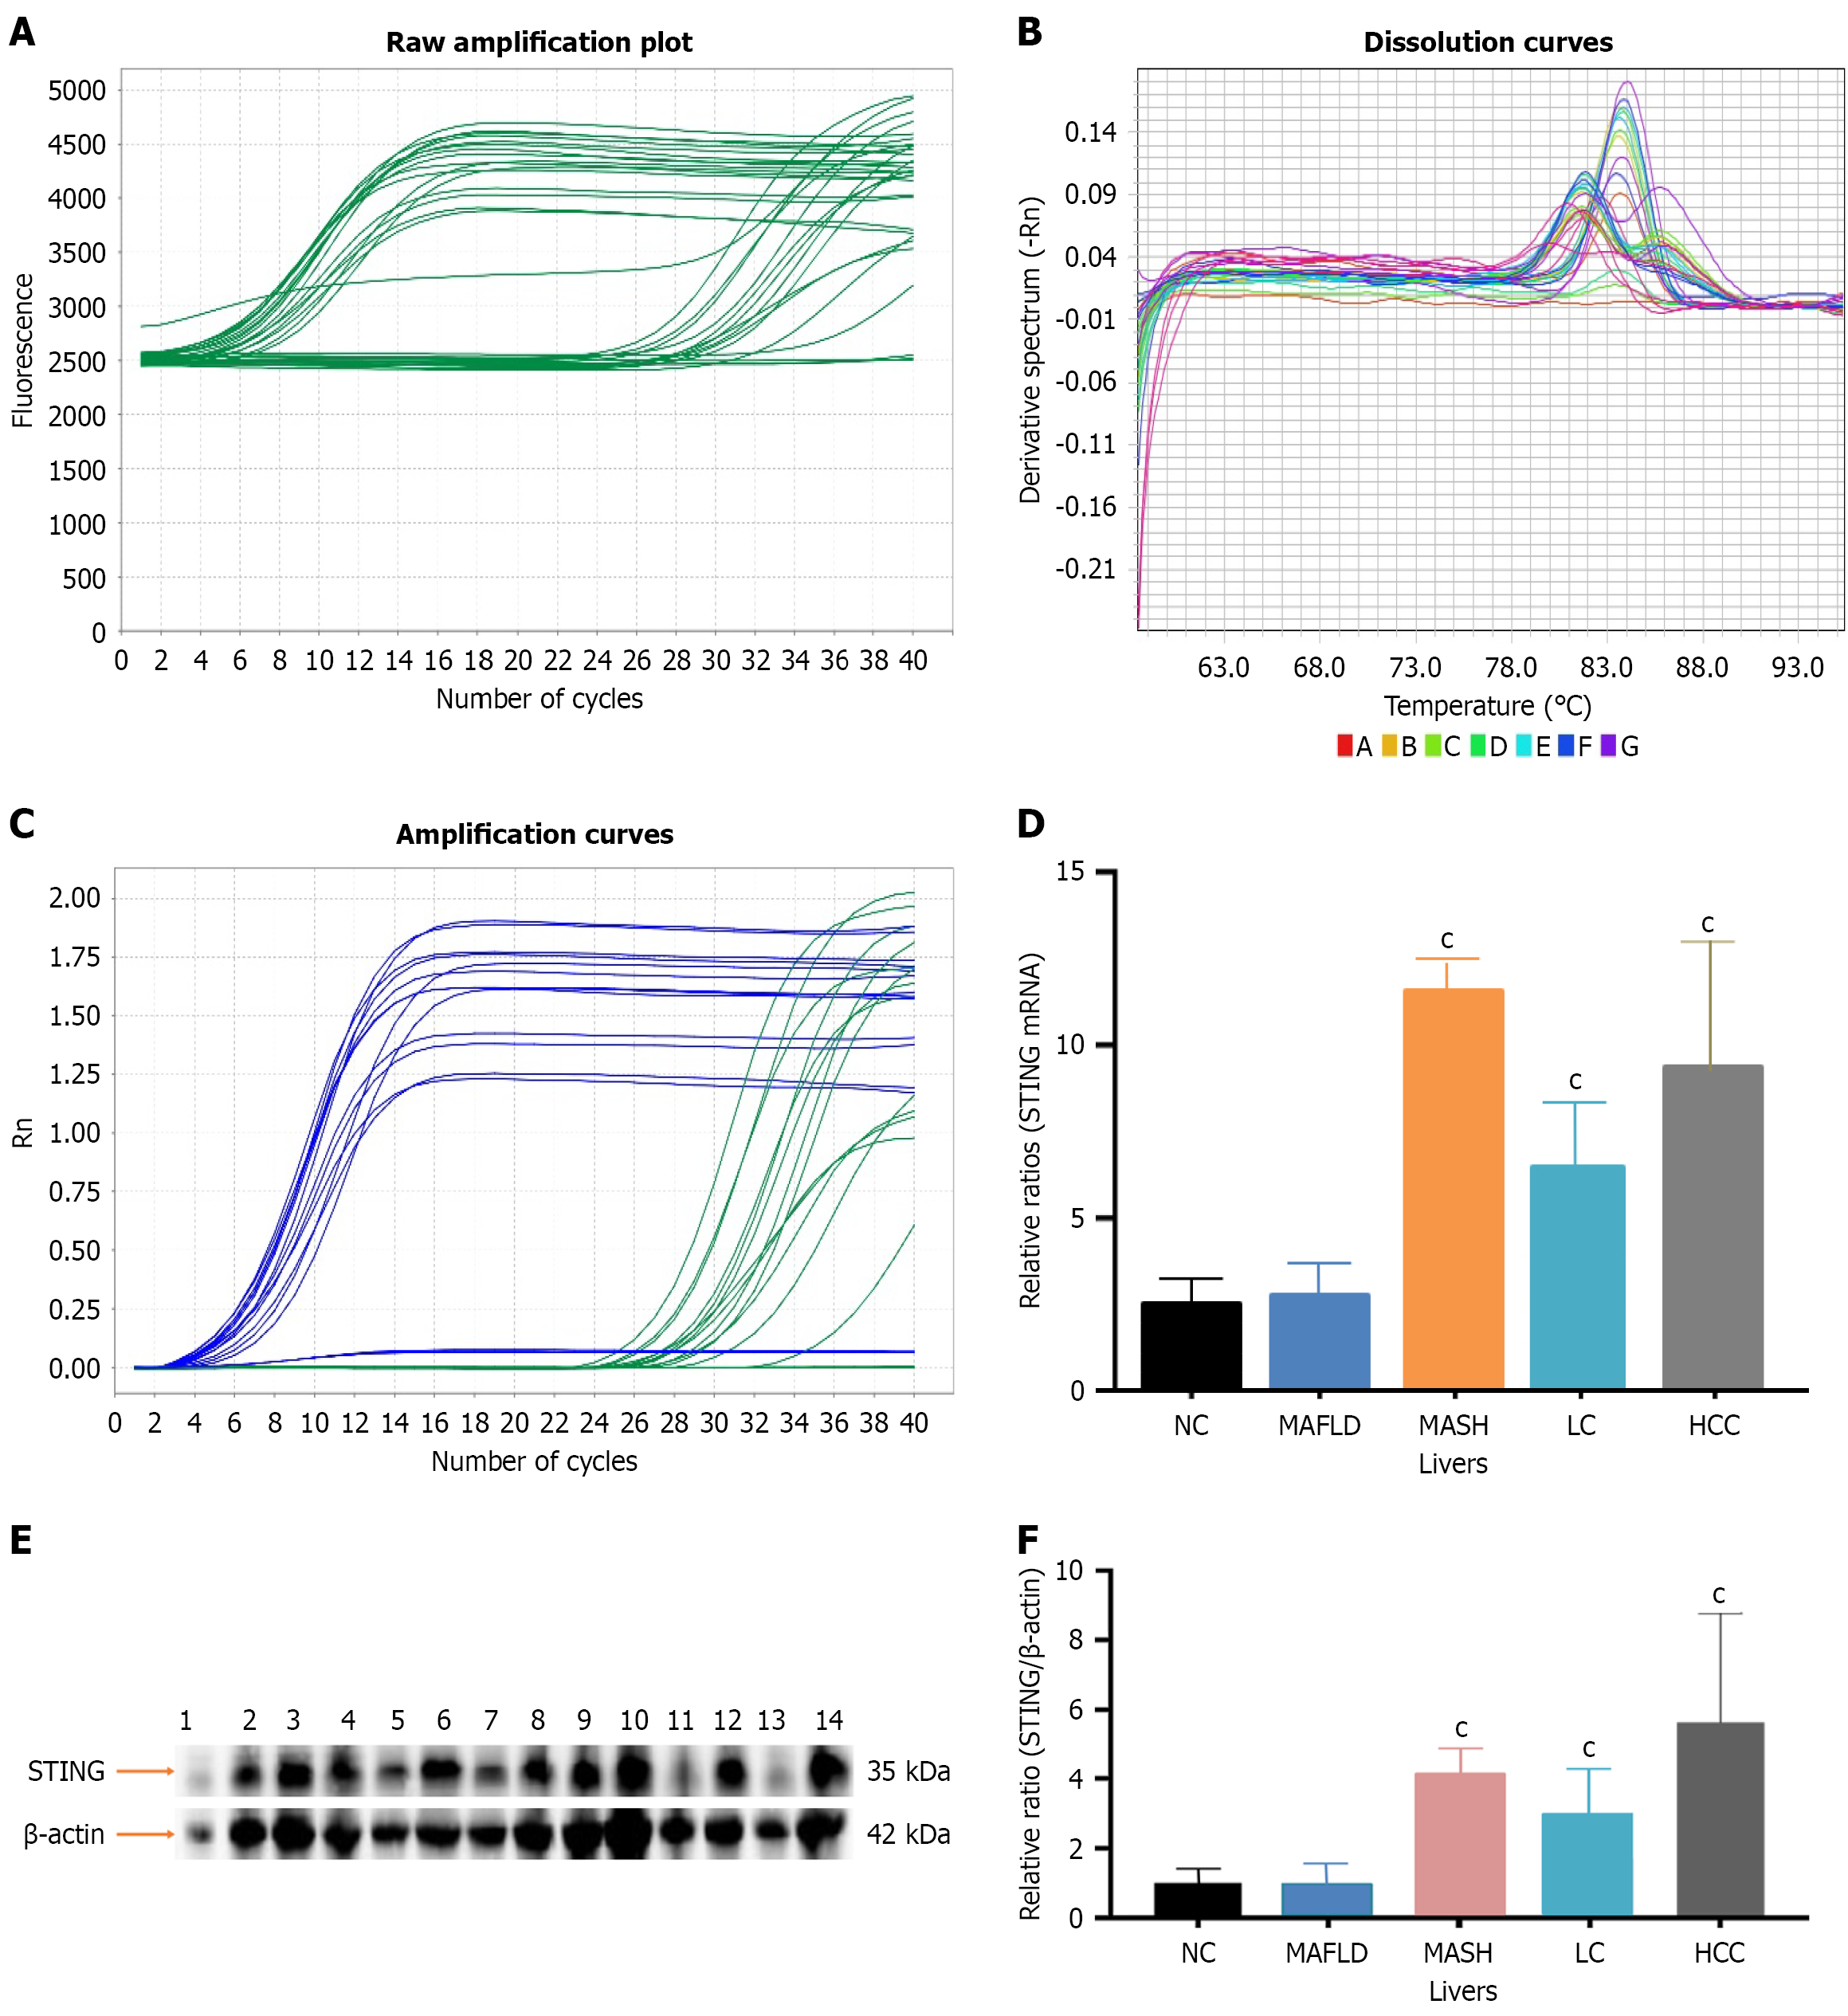
Figure 3 Dynamic changes in liver stimulator of interferon genes expressions at the mRNA or protein level.
A: Stimulator of interferon genes (STING) mRNA amplification plot by real time quantitative polymerase chain reaction; B: Melting curve of STING mRNA; C: Amplification curves of STING mRNA; D: Liver STING mRNA expressions among the different groups (n = 5/each); E: Liver STING immunoblot analysis in the normal control: 1, 11, and 13; metabolic dysfunction-associated fatty liver disease: 2, 5; metabolic dysfunction-associated steatohepatitis: 3, 4, 7; liver cirrhosis: 6, 8, 9; and hepatocellular carcinoma: 10, 12, 14 (n = 5/each) groups; F: Analysis of the relative ratios of liver STING to β-actin in the different groups. cP < 0.001 vs the control group. NC: Normal control; MAFLD: Metabolic dysfunction-associated fatty liver disease; MASH: Metabolic dysfunction-associated steatohepatitis; LC: Liver cirrhosis; HCC: Hepatocellular carcinoma; STING: Stimulator of interferon genes.
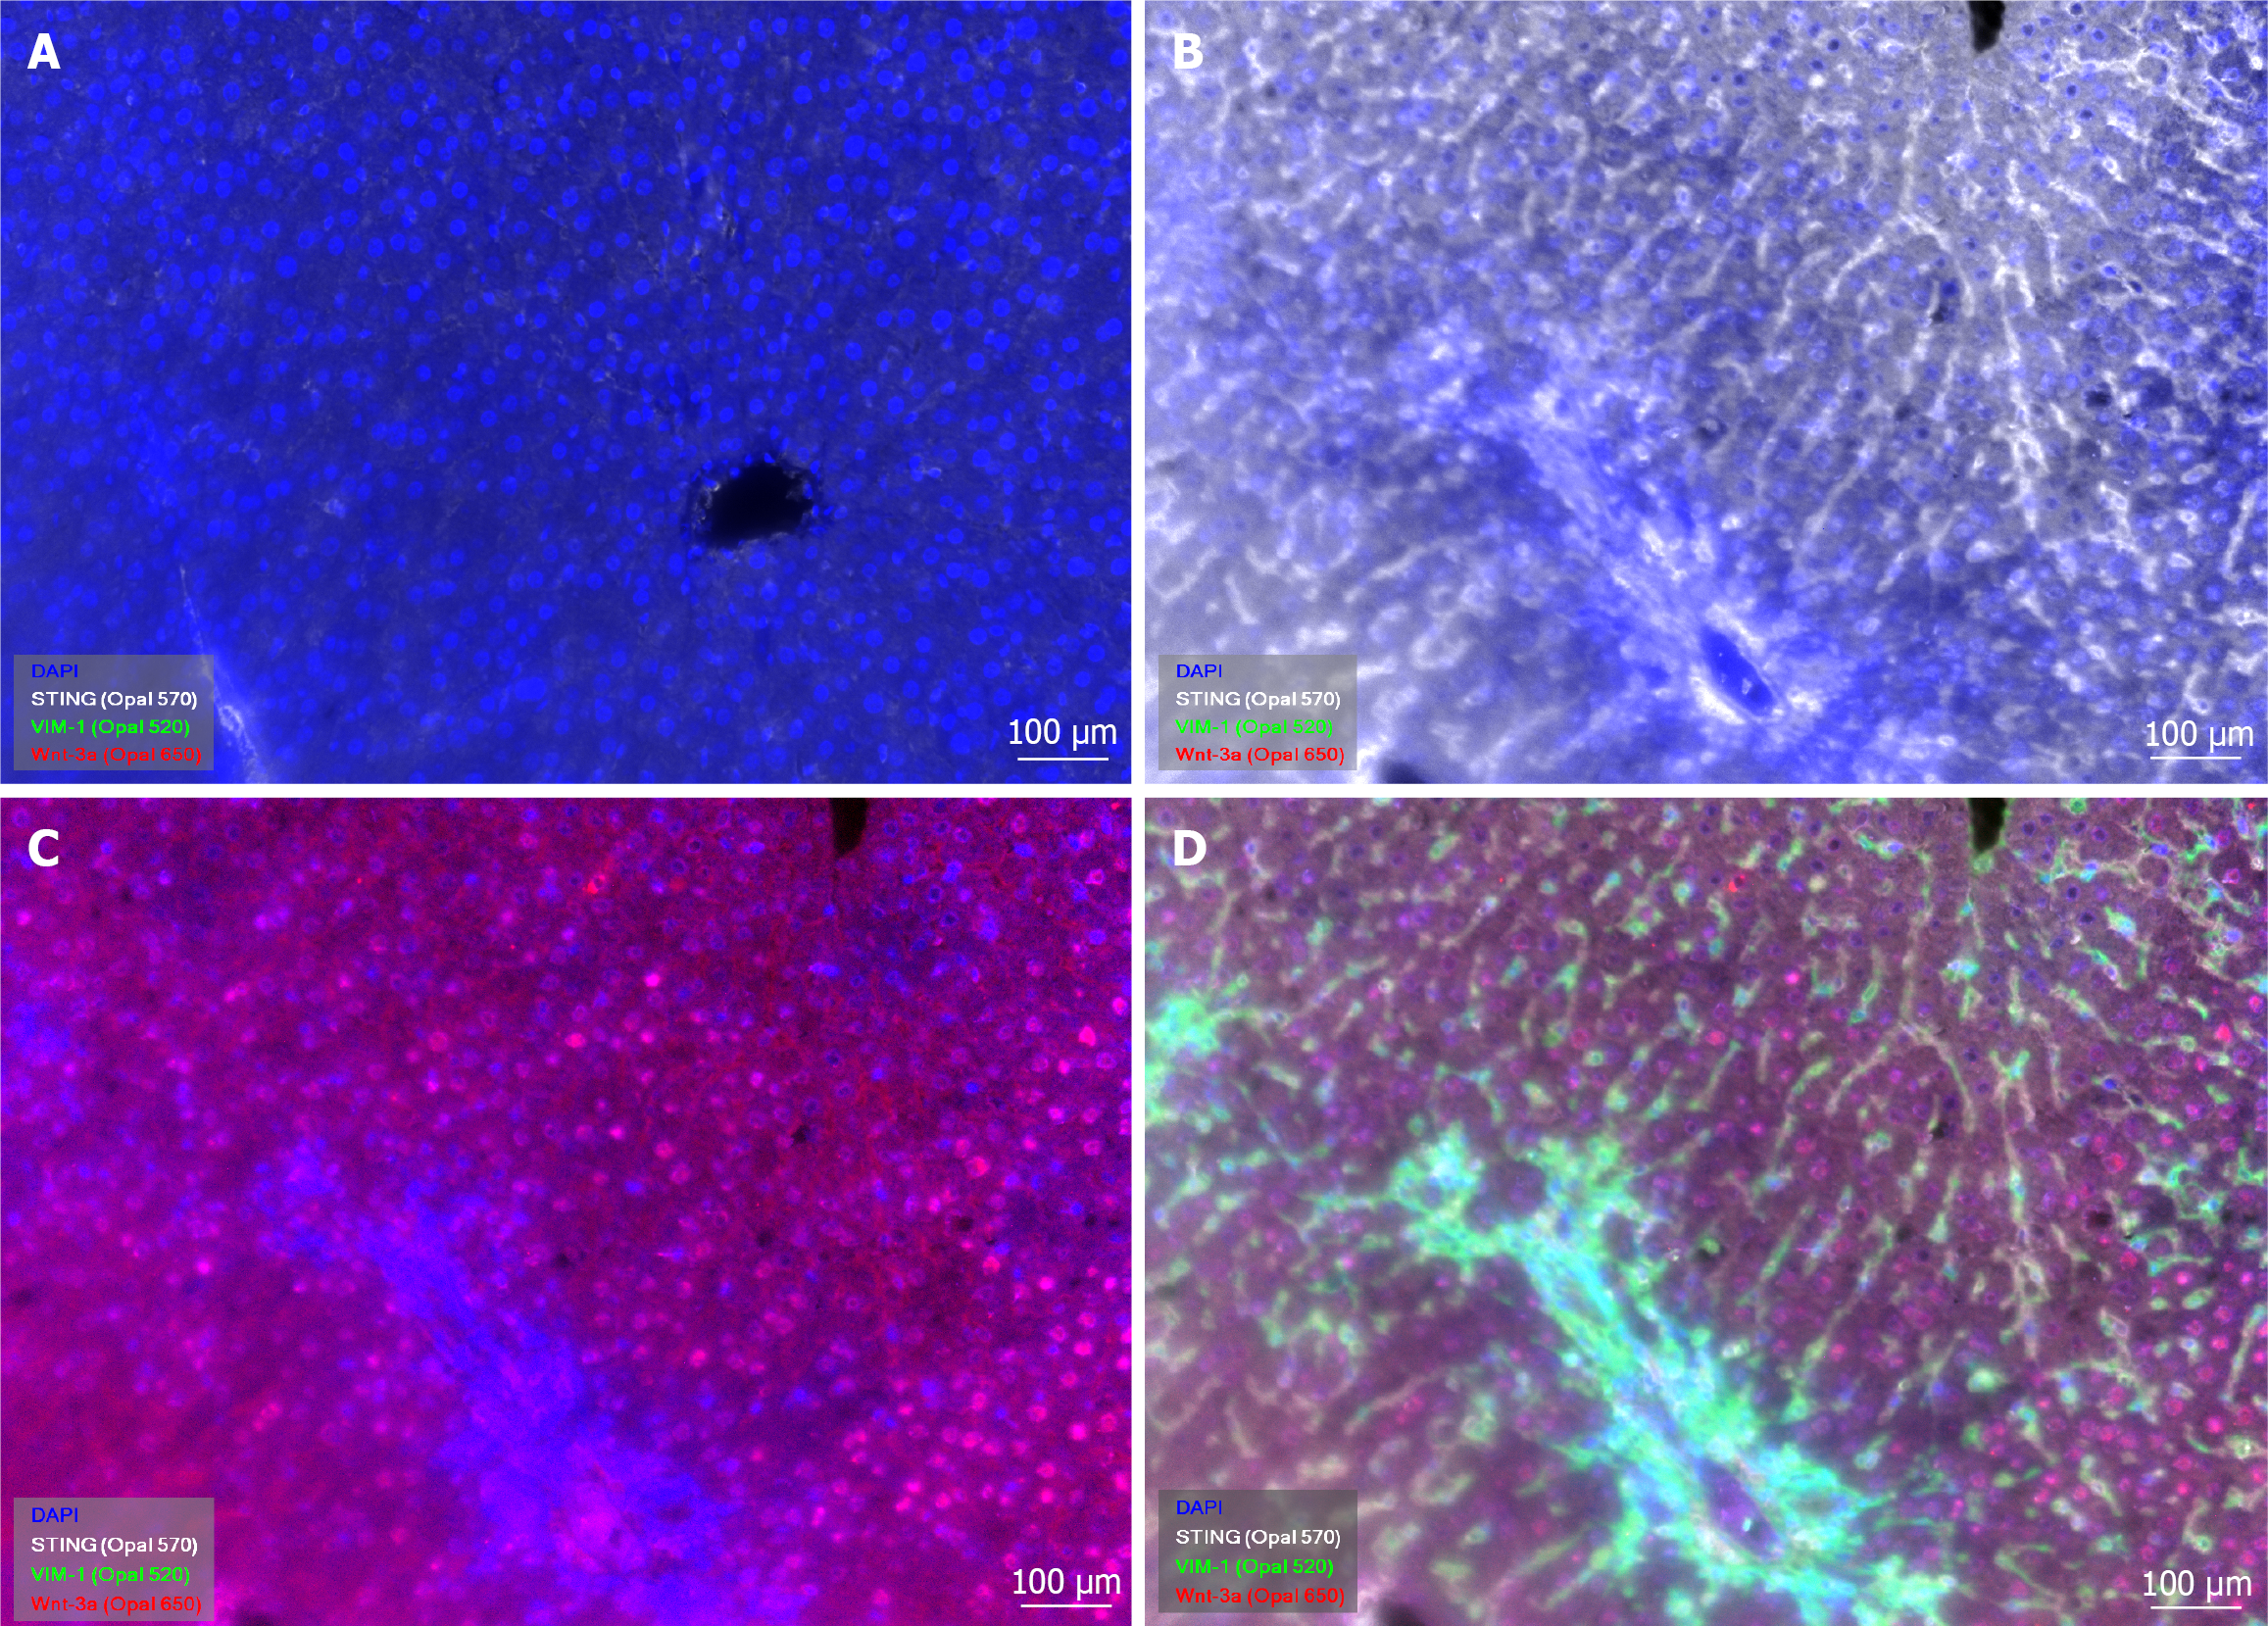
Figure 4 Hepatic stimulator of interferon genes expressions are associated with Wnt3a and vimentin-1 signaling during metabolic dysfunction-associated fatty liver disease progression.
A: Stimulator of interferon genes (STING) (white) expressions in NC livers; B: STING expressions in hepatocellular carcinoma (HCC) tissues; C: Wnt3a (red) in HCC tissues; D: Merged vimentin-1 (green) with STING and Wnt3a signals in HCC tissues. STING: Stimulator of interferon genes; VIM-1: Vimentin-1; DAPI: 4’,6-Diamidino-2-phenylindole.
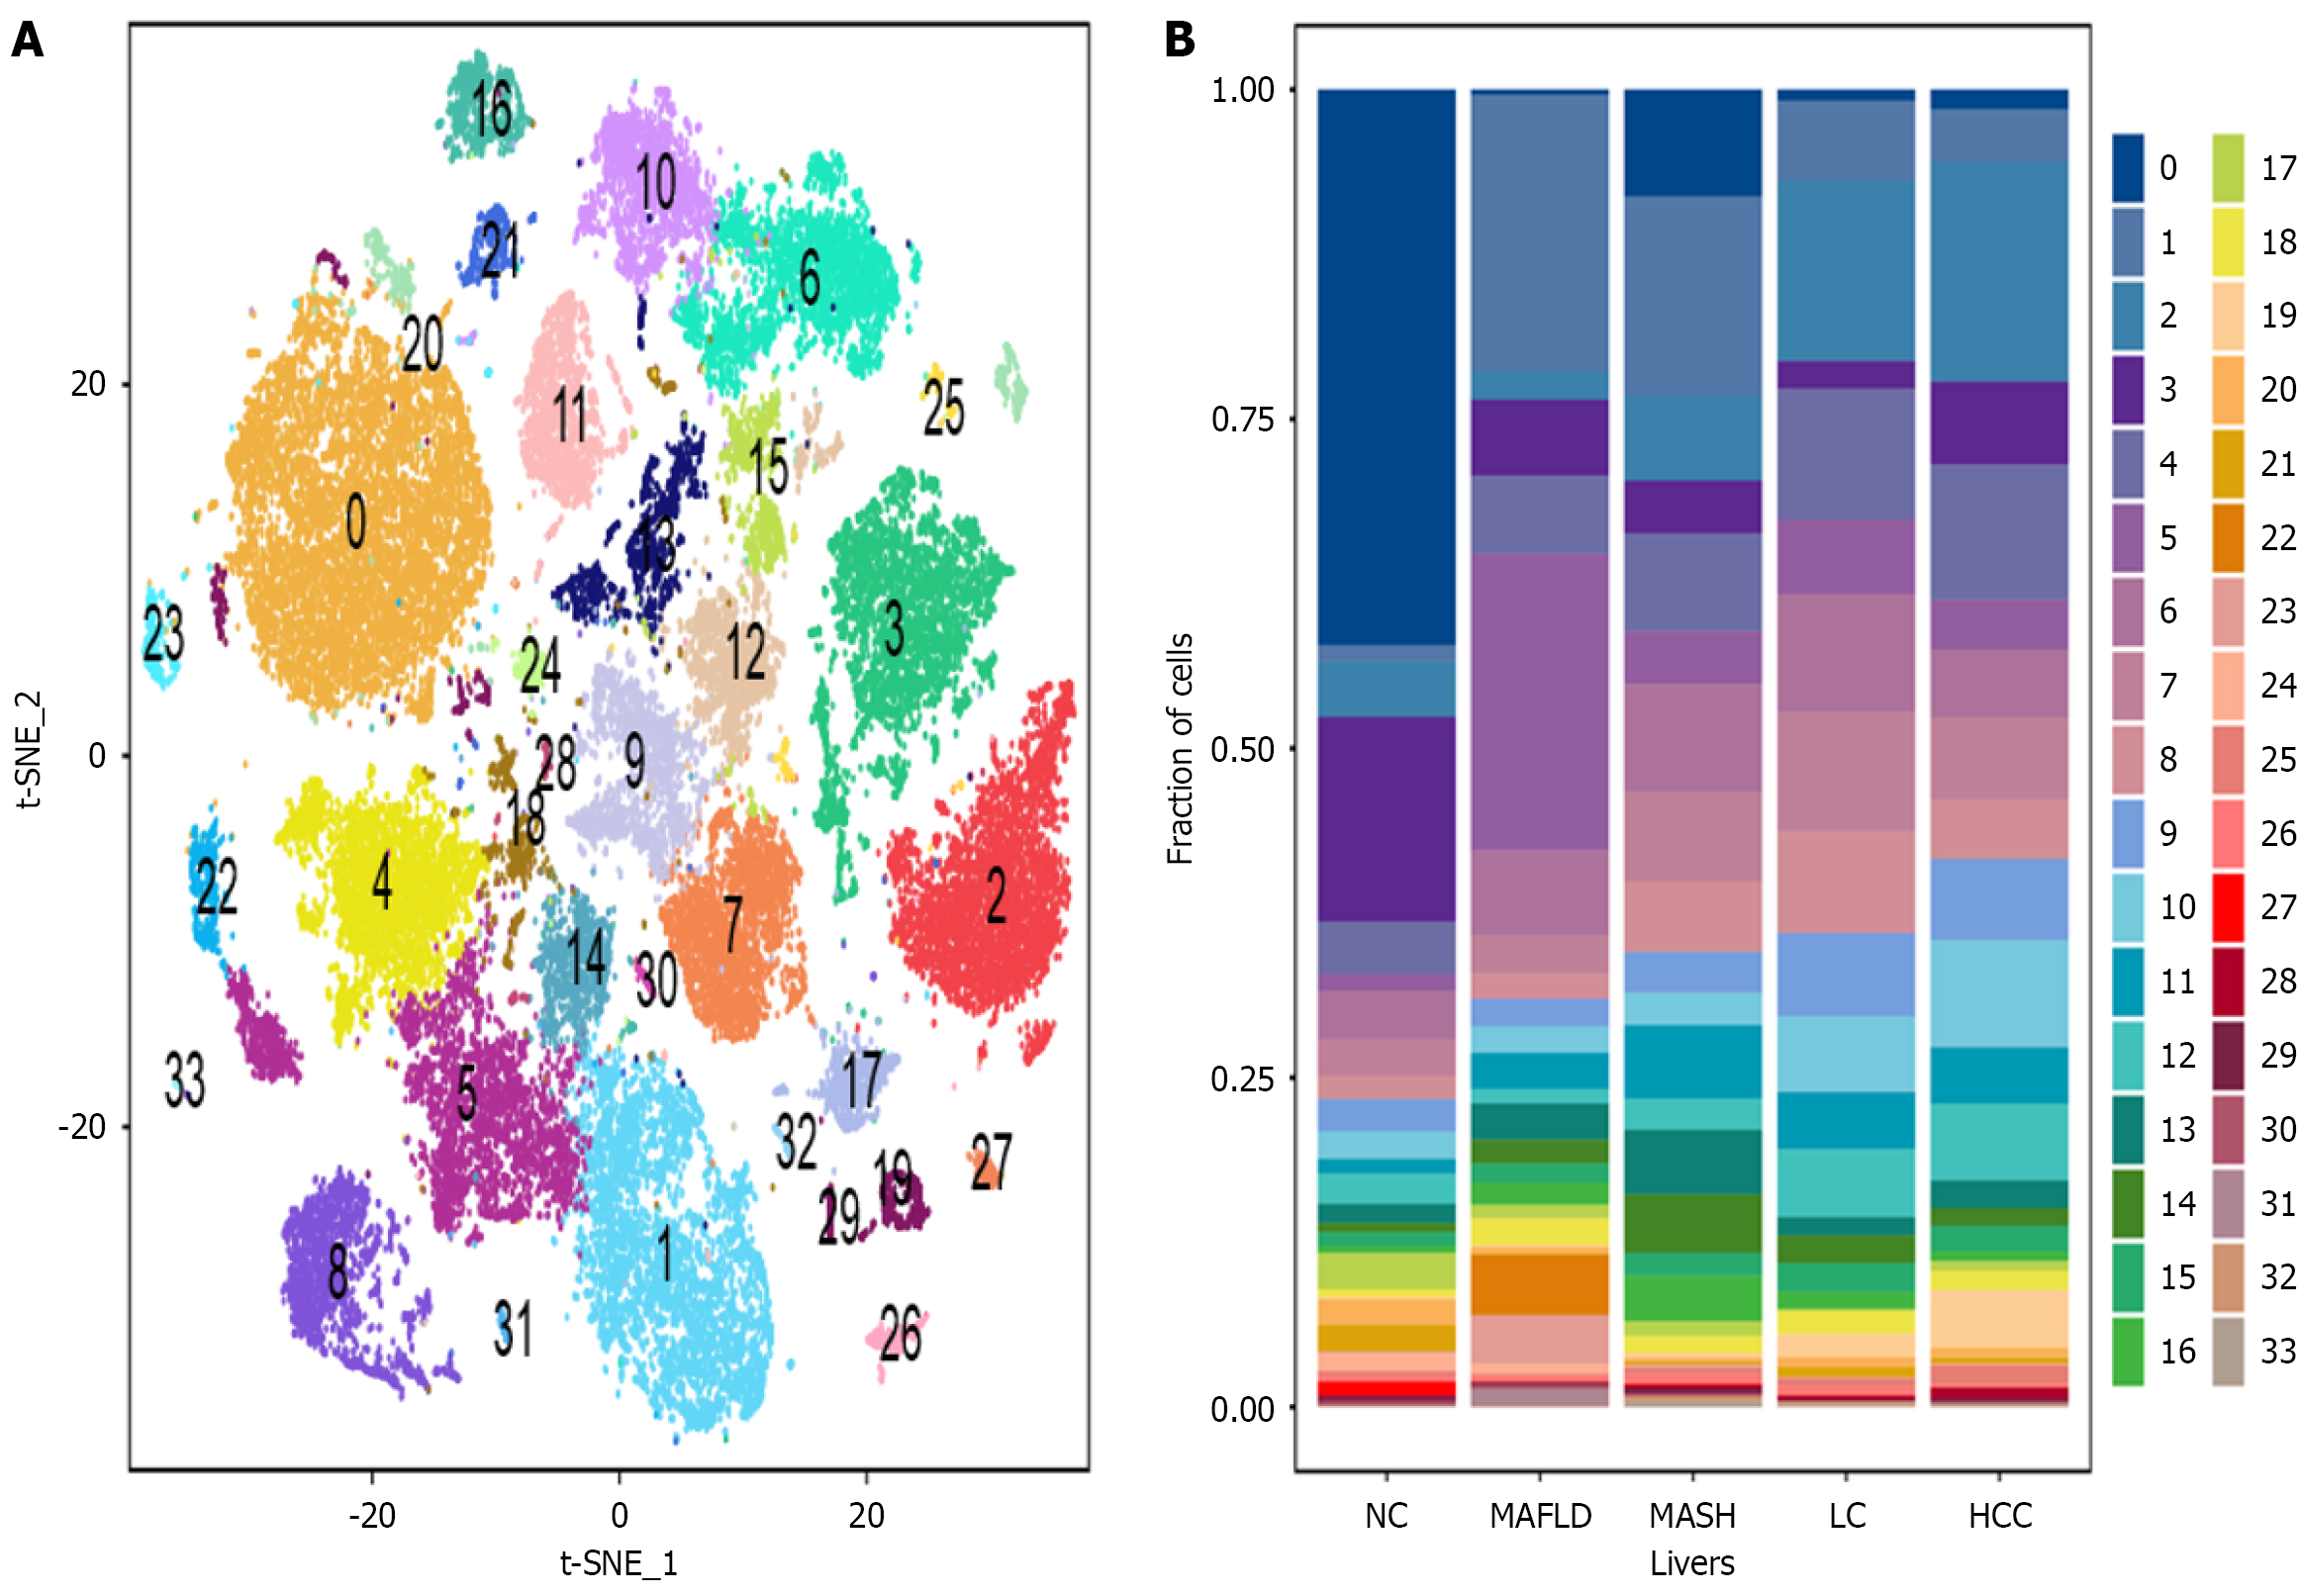
Figure 5 Dynamic alteration of cell clustering in the liver.
A: Clustering of liver cells in control rats; the numbers of cells in liver cell subpopulations; B: Dynamic changes in cell subpopulations in different livers (n = 5; that is, normal control, metabolic dysfunction-associated fatty liver disease, metabolic dysfunction-associated steato-hepatitis, liver cirrhosis and hepatocellular carcinoma) during malignant progression. The following cell types were identified: Hepatocytes (0, 20, 23, 24, 27); B cells (2, 25, 28); endothelial cells (3, 1; natural killer cells (6, 10, 13); T cells, monocytes, macrophages (7, 9, 12, 15); dendritic cells (8); neutrophils (11); epithelial cells (19); red blood cells (21); plasma cells (26); hepatocytes (29); and dendritic cells (33). Unidentified cells (1, 4, 5, 14, 16, 18, 22, 30, 31, 32). t-SNE-1: T-distributed stochastic neighbor embedding-1; t-SNE-2: T-distributed stochastic neighbor embedding-2; NC: Normal control; MAFLD: Metabolic dysfunction-associated fatty liver disease; MASH: Metabolic dysfunction-associated steatohepatitis; LC: Liver cirrhosis; HCC: Hepatocellular carcinoma.
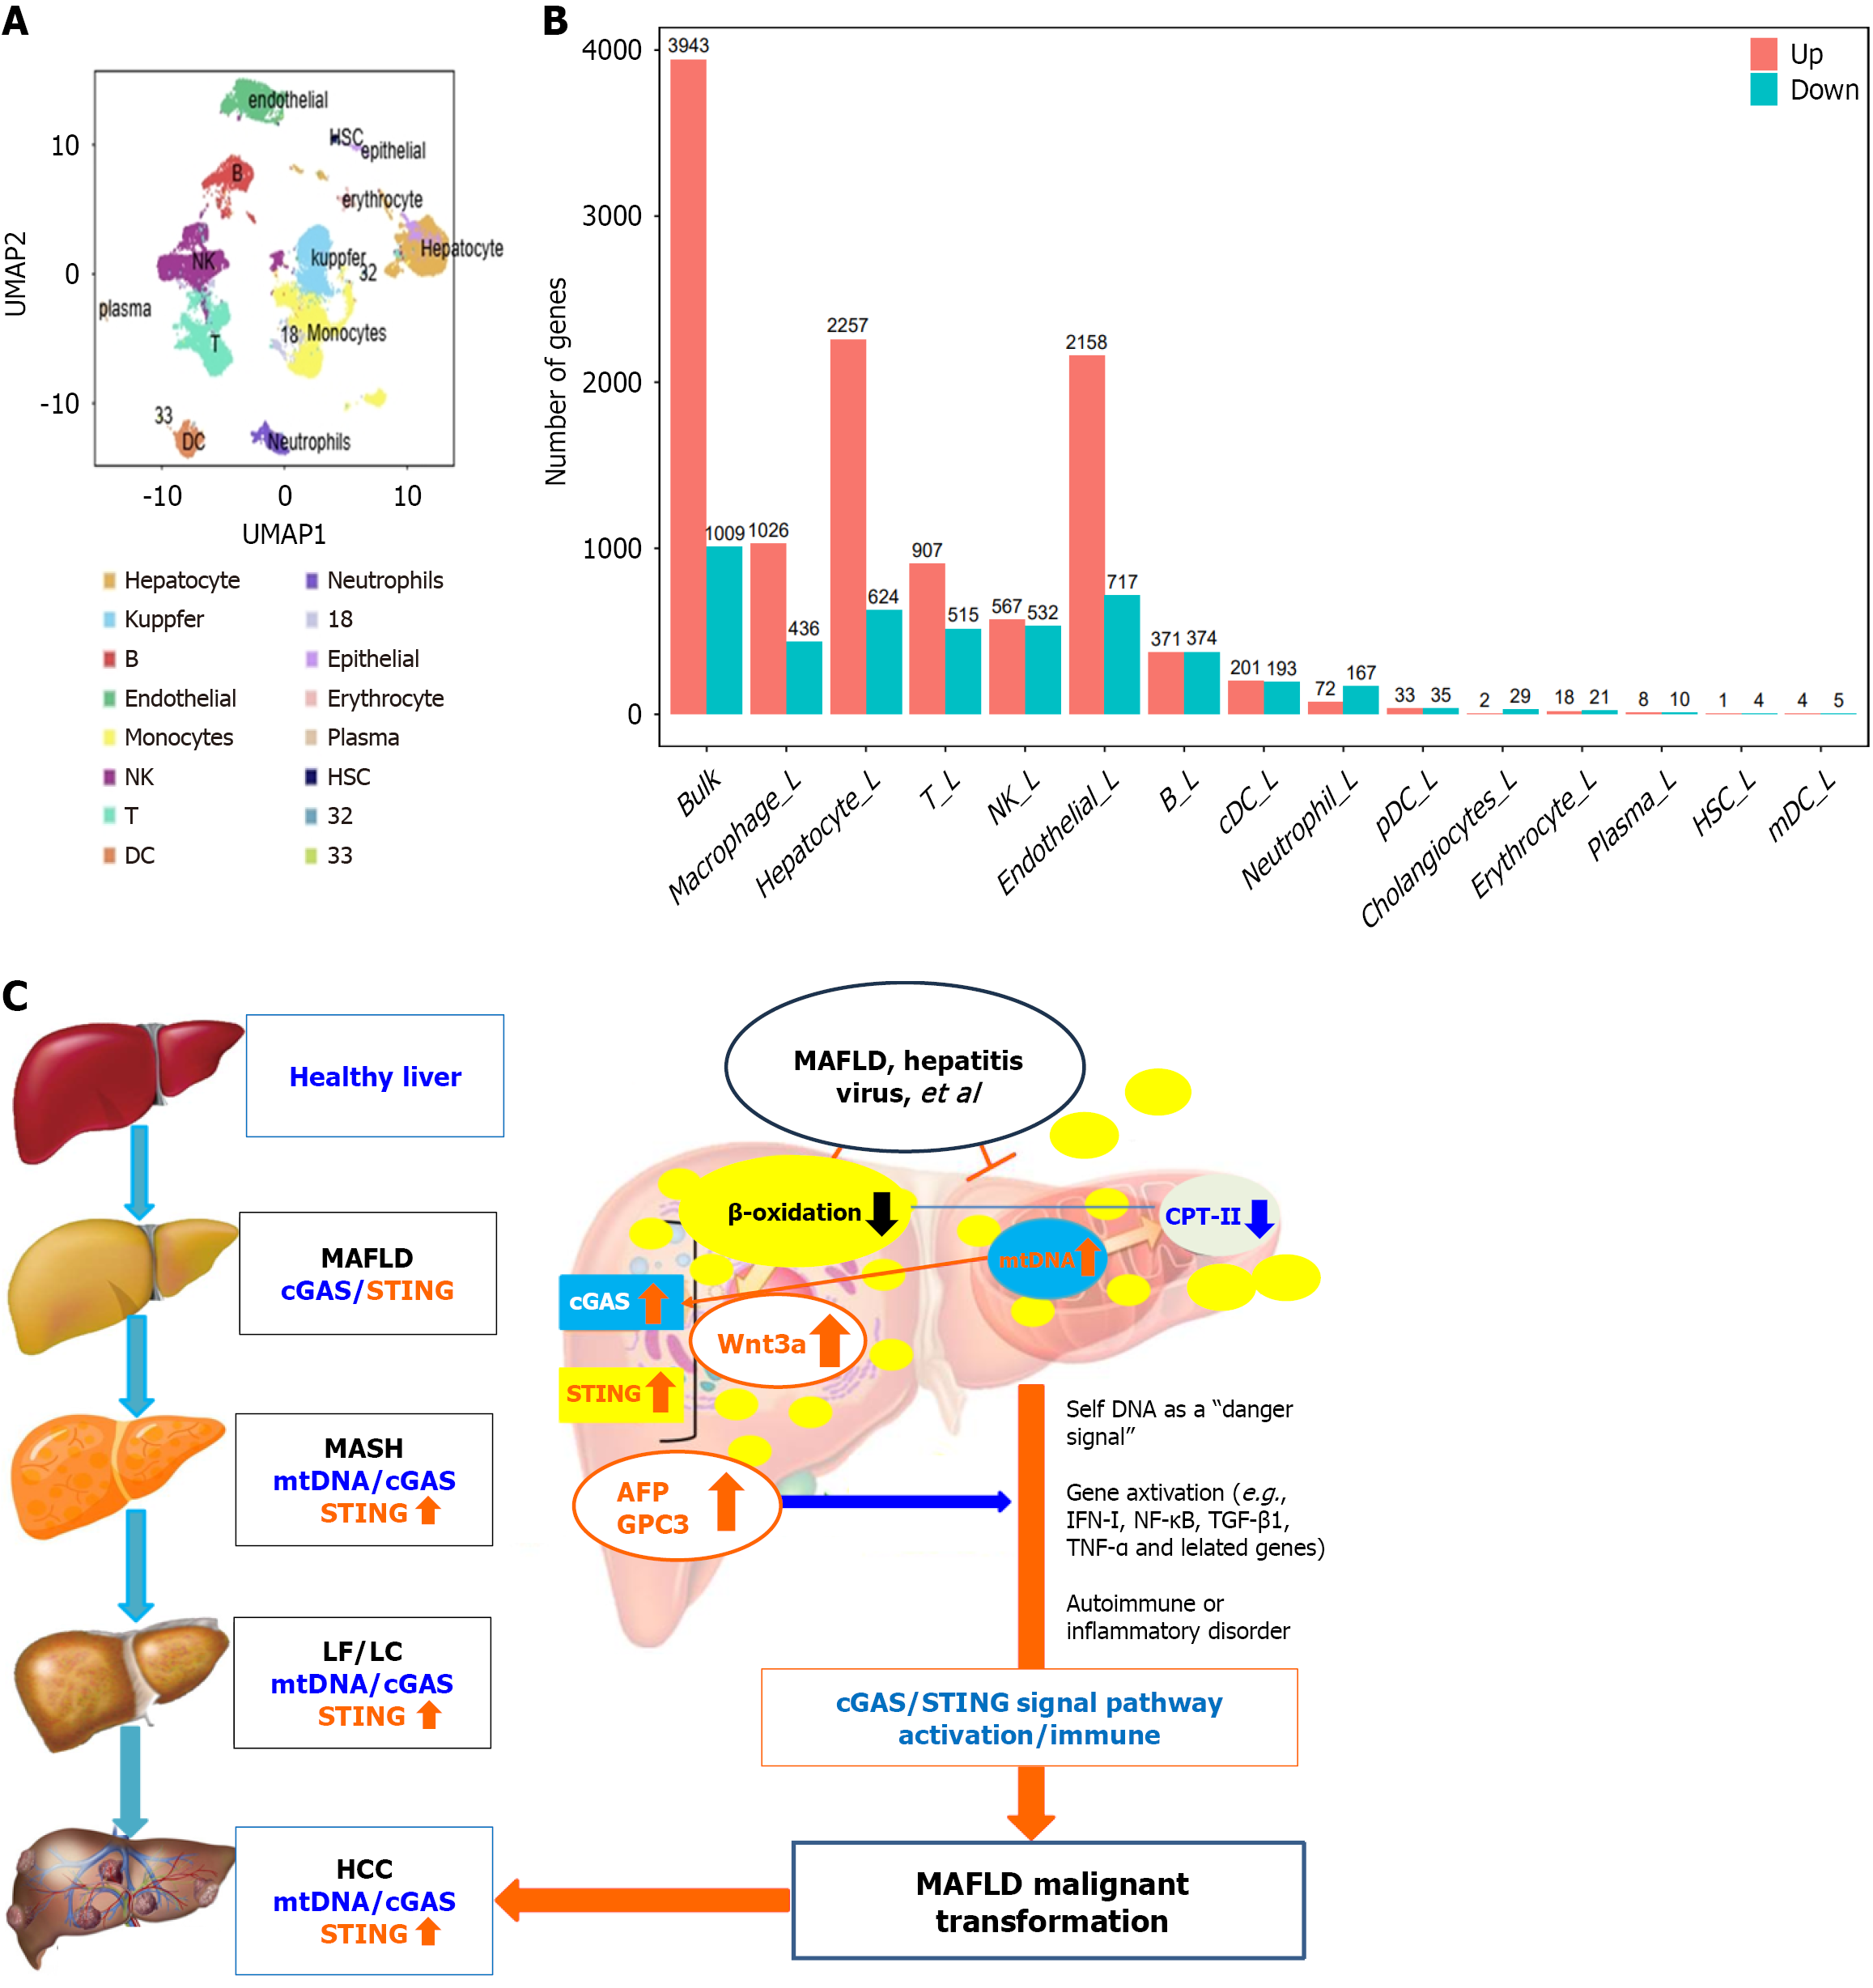
Figure 6 Alterations in immune cells and a possible mechanism of cyclic guanosine monophosphate-adenosine monophosphate synthase-stimulator of interferon genes activation.
A: Clustering of liver immune cells. The cell types identified were hepatocytes, B cells, endothelial cells, natural killer cells, T cells, monocytes, dendritic cells, neutrophils, epithelial cells, red blood cells, plasma cells, hepatocytes, and dendritic cells. Unidentified cells (8, 32, 33); B: Gene transcription of immune cells in metabolic dysfunction-associated fatty liver disease; C: A possible mechanism by which metabolic dysfunction-associated fatty liver disease malignancy is promoted. NK: Natural killer; DC: Dendritic cell; HSC: Hepatic stellate cells; UMAP: Uniform manifold approximation and projection; cGAS: Cyclic guanosine monophosphate-adenosine monophosphate synthase; STING Stimulator of interferon genes; mtDNA: Mitochondrial DNA; LF: Liver fibrosis; AFP: Alpha-fetoprotein; GPC3: Glypican-3; CPT-II: Carnitine palmitoyl transferase II; INF-I: Interferon-I; NF-κB: Nuclear factor kappa-B; TGF-β1: Transforming growth factor β1; TNF-α: Tumor necrosis factor α; MAFLD: Metabolic dysfunction-associated fatty liver disease; LC: Liver cirrhosis.
- Citation: Zhou MY, Fang RF, Tang H, Xia XX, Xie Q, Yao DF, Sai WL, Yao M. Activated cGAS-STING signaling promotes malignancy in metabolic dysfunction-associated fatty liver disease via mitochondrial DNA and immune cell dysfunction. World J Hepatol 2026; 18(7): 121423
- URL: https://www.wjgnet.com/1948-5182/full/v18/i7/121423.htm
- DOI: https://dx.doi.org/10.4254/wjh.121423