
















Copyright: ©Author(s) 2026.
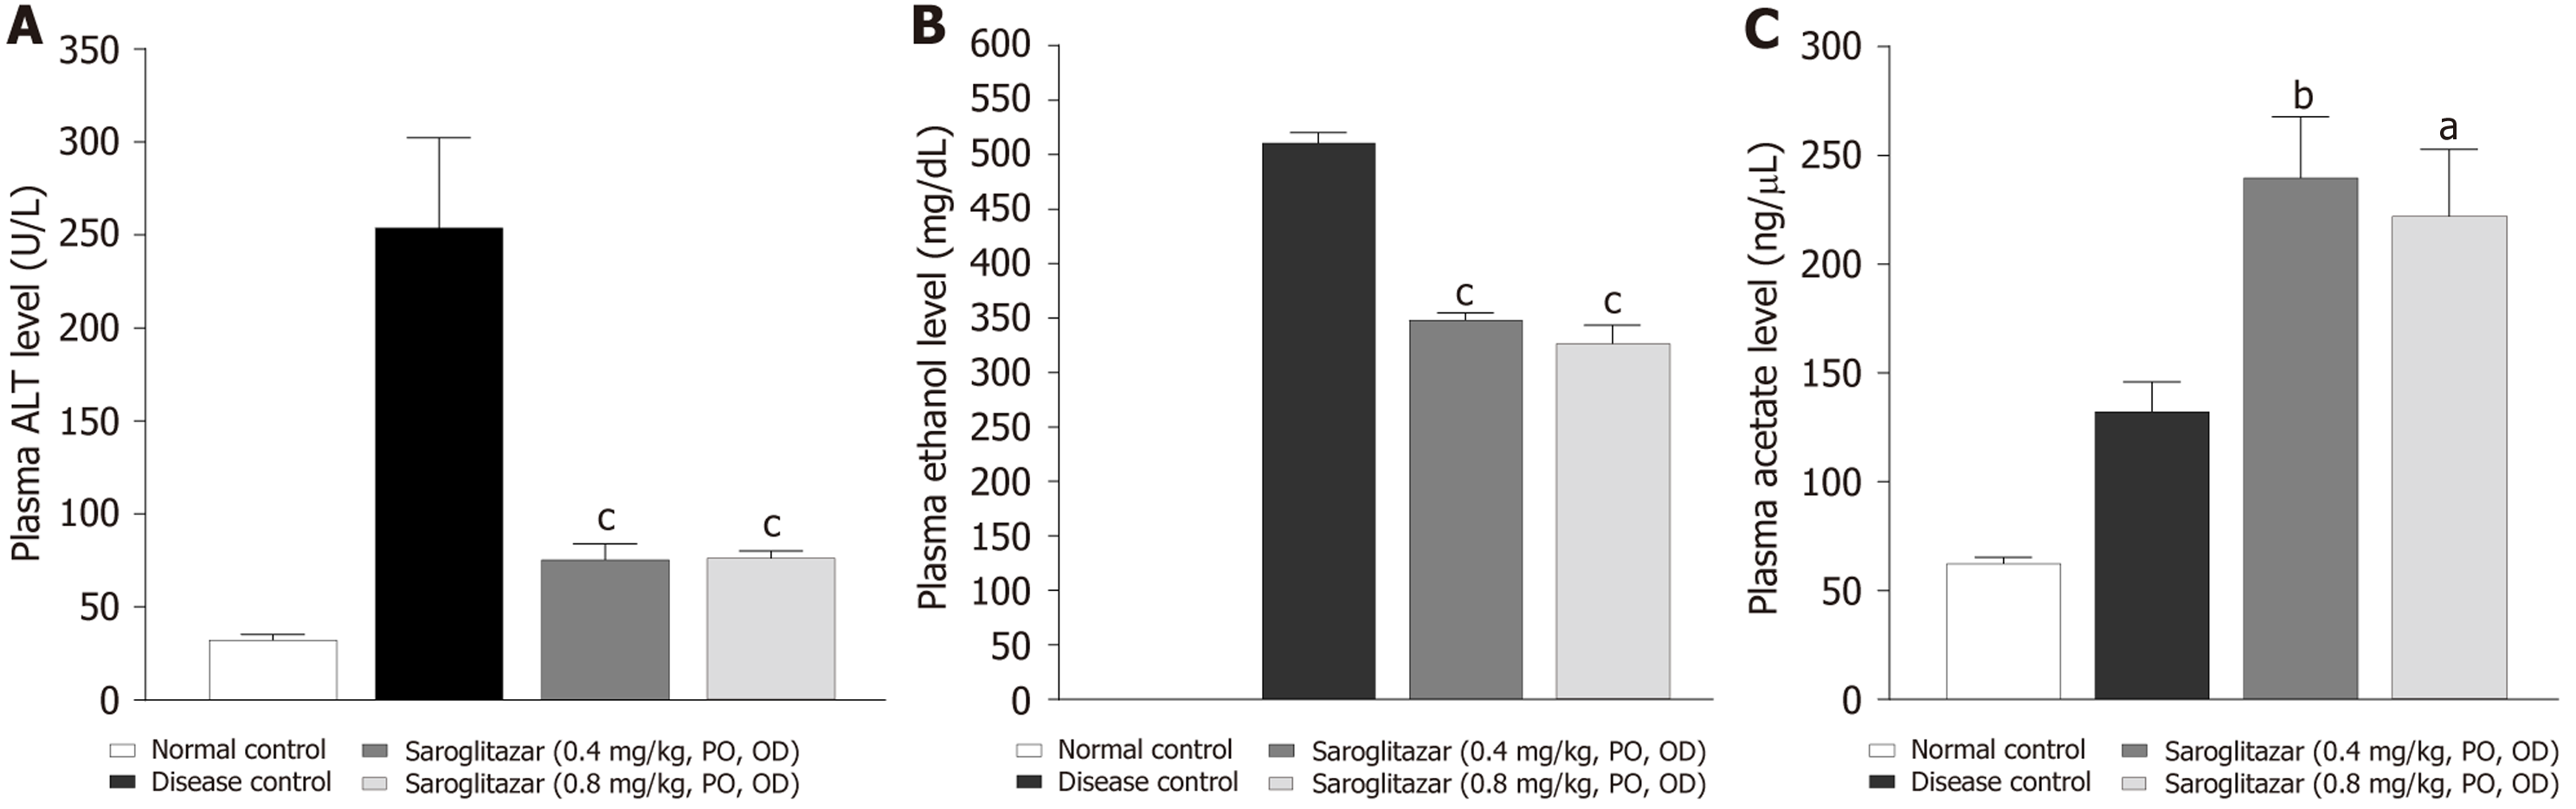
Figure 1 Effect of saroglitazar on plasma alanine aminotransferase, ethanol, and acetate levels in the preventive study design.
Mice were administered saroglitazar or vehicle during a 10-day ethanol-feeding protocol. Blood samples were collected 2 hours after the ethanol binge to measure plasma ethanol and acetate levels, and 9 hours after the binge to assess plasma alanine aminotransferase. A: It shows plasma alanine aminotransferase concentrations; B: It shows plasma ethanol levels; C: It shows plasma acetate levels. Data are presented as mean ± SEM (n = 9). Statistical analysis was performed using one-way analysis of variance followed by Dunnett’s multiple comparison test. aP < 0.05, bP < 0.01, cP < 0.001 vs disease control group. ALT: Alanine aminotransferase; PO: Orally; OD: Once daily.
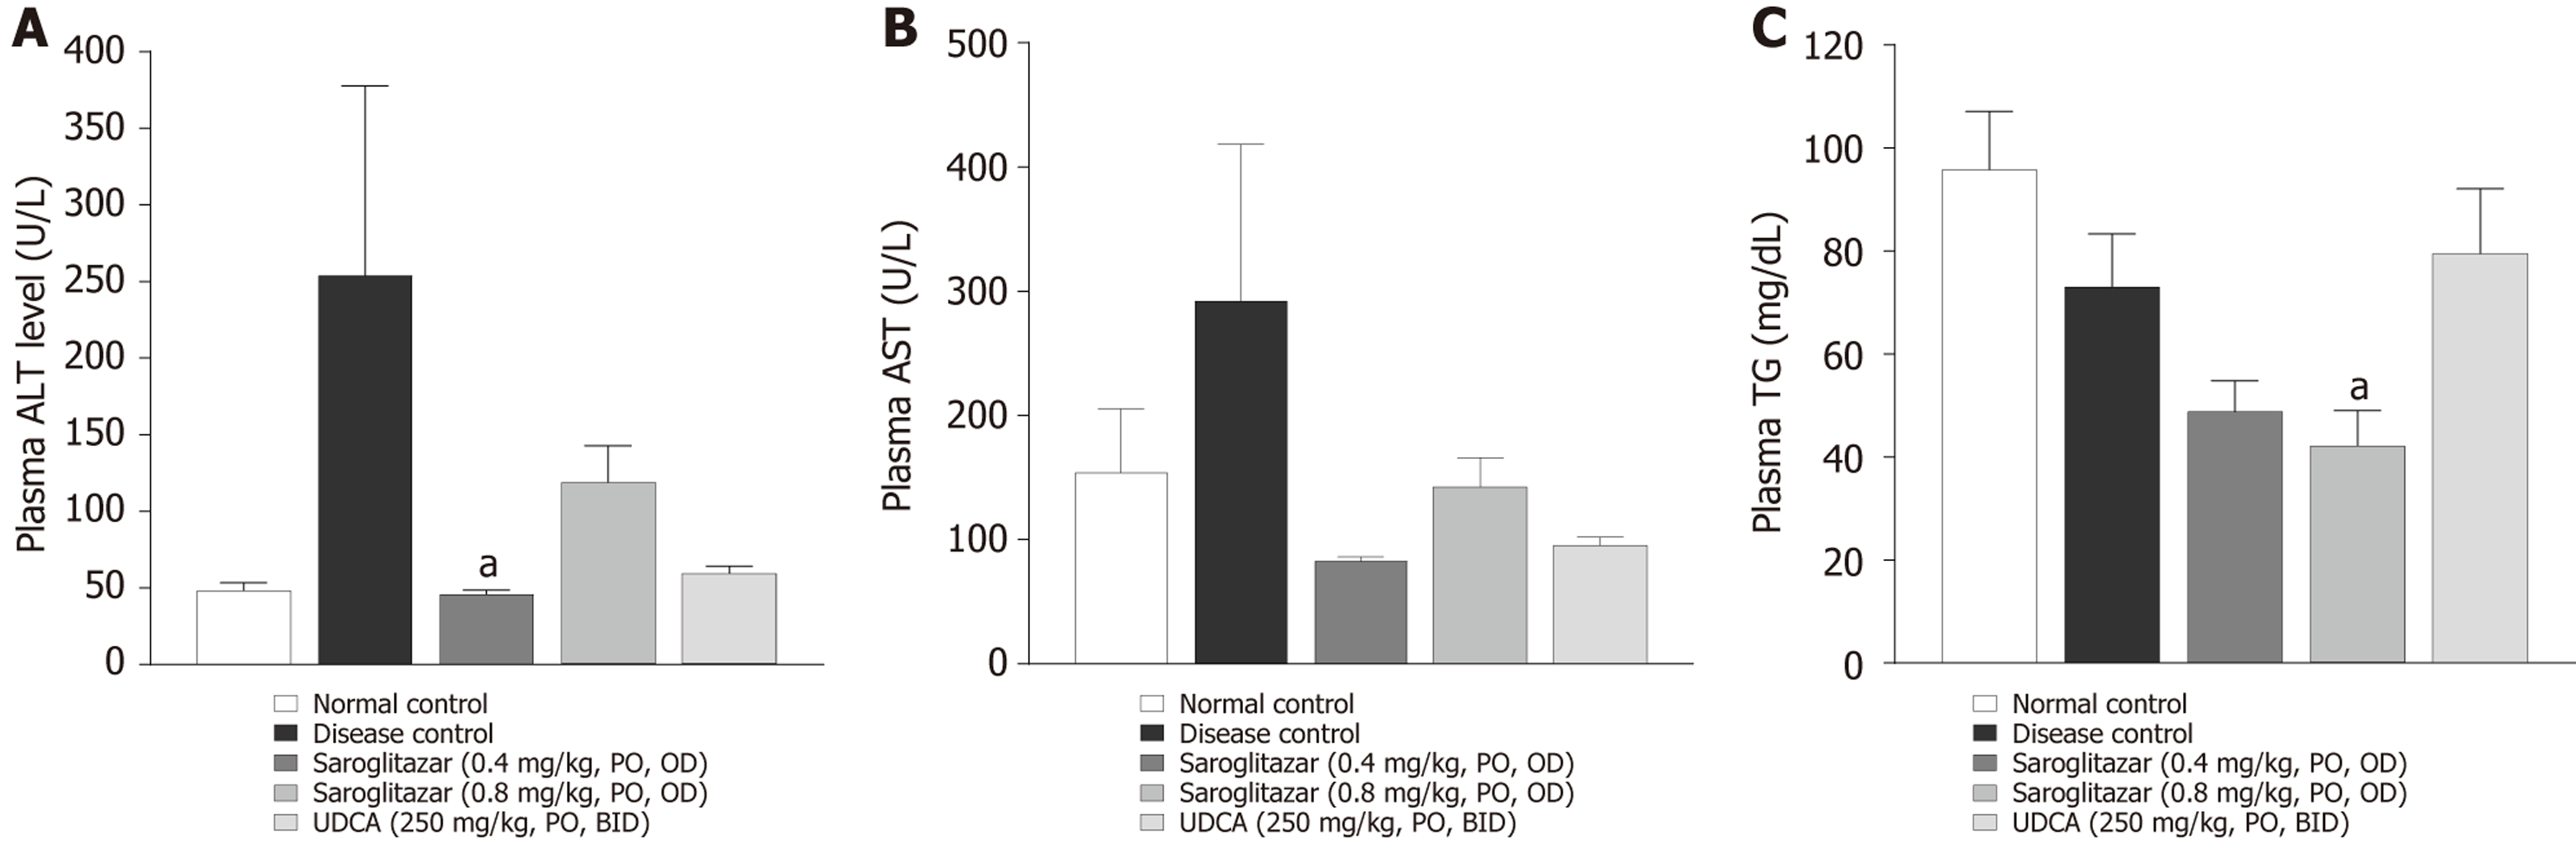
Figure 2 Effect of saroglitazar on liver injury markers and plasma triglyceride in therapeutic study design.
Mice were treated with saroglitazar or vehicle for 4 weeks during ethanol feeding. Blood samples were collected 9 hours after the ethanol binge to measure plasma alanine aminotransferase, aspartate aminotransferase, and triglyceride levels. A: It shows plasma alanine aminotransferase concentrations; B: It shows plasma aspartate aminotransferase levels; C: It shows plasma triglyceride levels. Data are presented as mean ± SEM (n = 8 for normal control and n = 9 disease control and treatments). Statistical analysis was performed using one-way analysis of variance followed by Dunnett’s multiple comparison test. aP < 0.05 vs disease control group. ALT: Alanine aminotransferase; PO: Orally; OD: Once daily; UDCA: Ursodeoxycholic acid; AST: Aspartate aminotransferase; TG: Triglyceride.
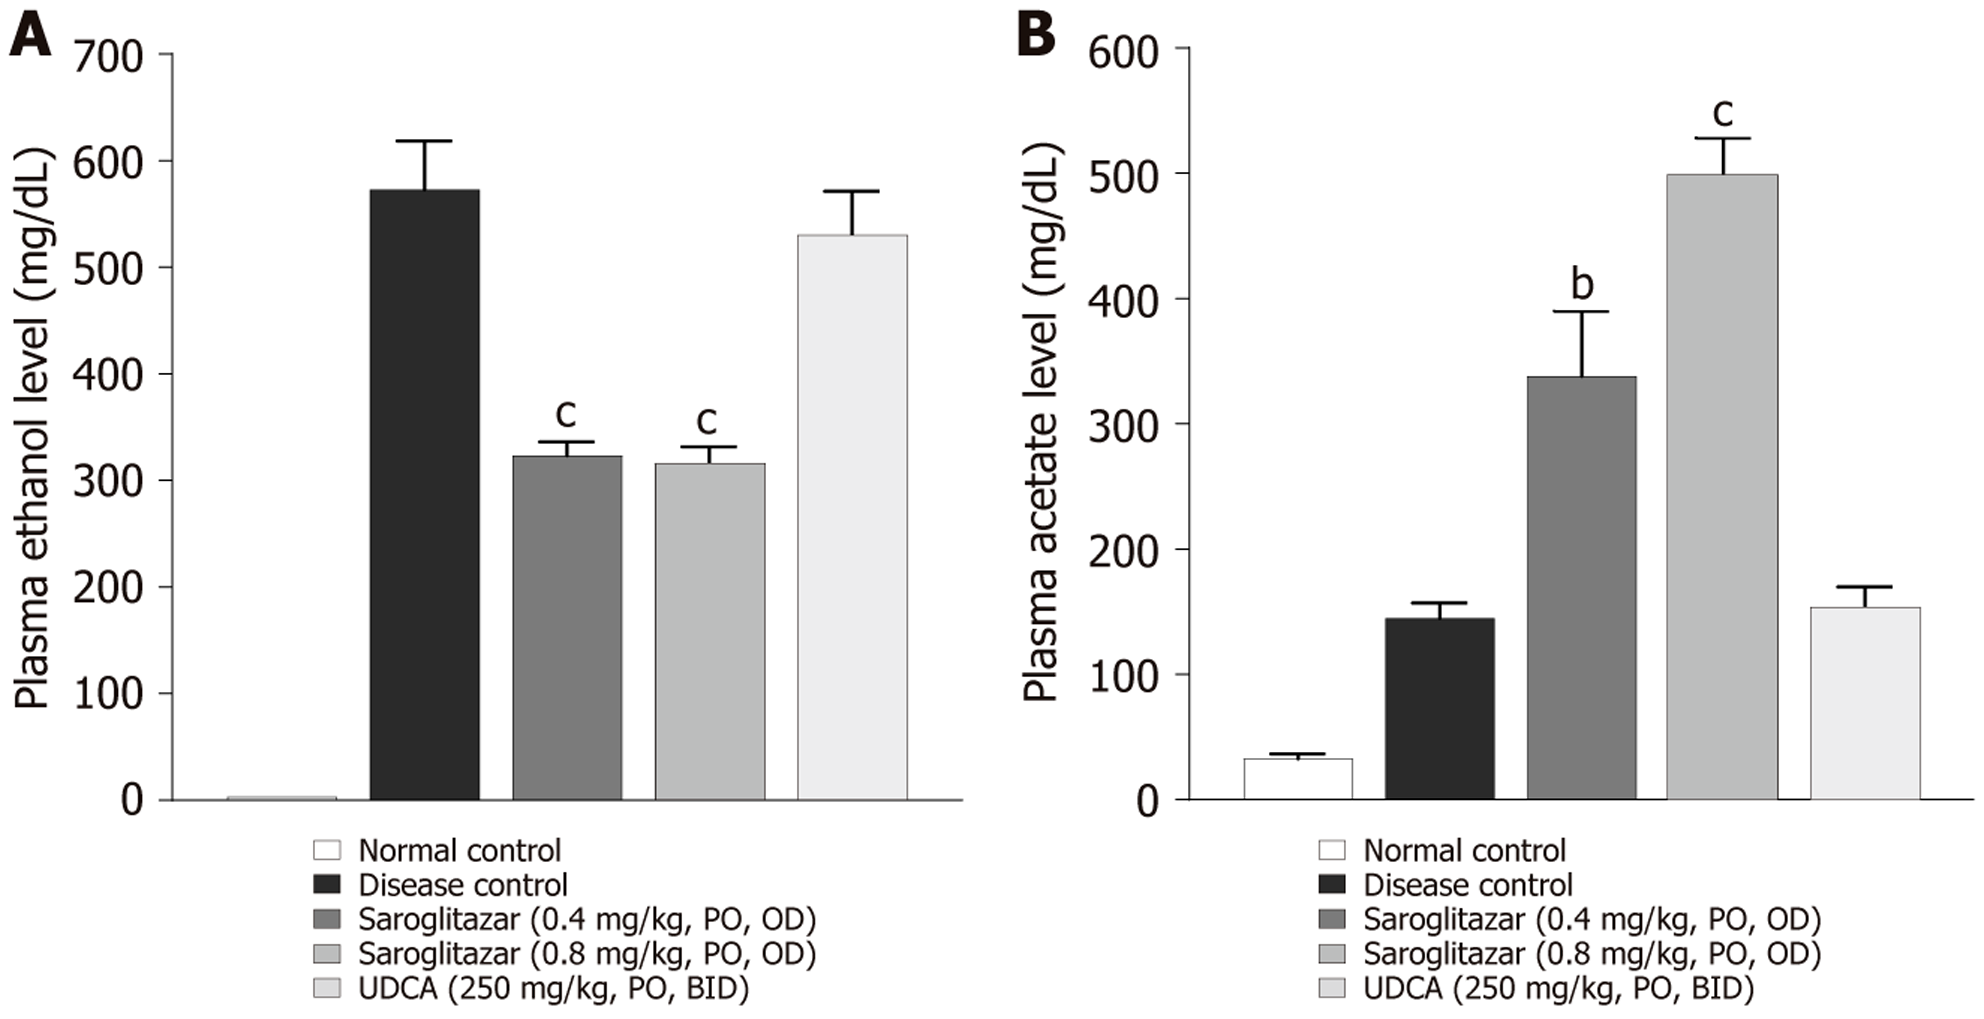
Figure 3 Effect of saroglitazar on plasma ethanol and acetate levels in the therapeutic study design.
Mice received saroglitazar or vehicle during a 4-week ethanolfeeding protocol. Blood samples were collected 2 hours after the ethanol binge to determine plasma ethanol and acetate levels. A: It shows plasma ethanol concentrations; B: It shows plasma acetate levels. Data are presented as mean ± SEM (n = 8 for normal control and n = 9 disease control and treatments). Statistical analysis was performed using one-way analysis of variance followed by Dunnett’s multiple comparison test. bP < 0.01, cP < 0.001 vs disease control group. PO: Orally; OD: Once daily; BID: Twice daily; UDCA: Ursodeoxycholic acid.
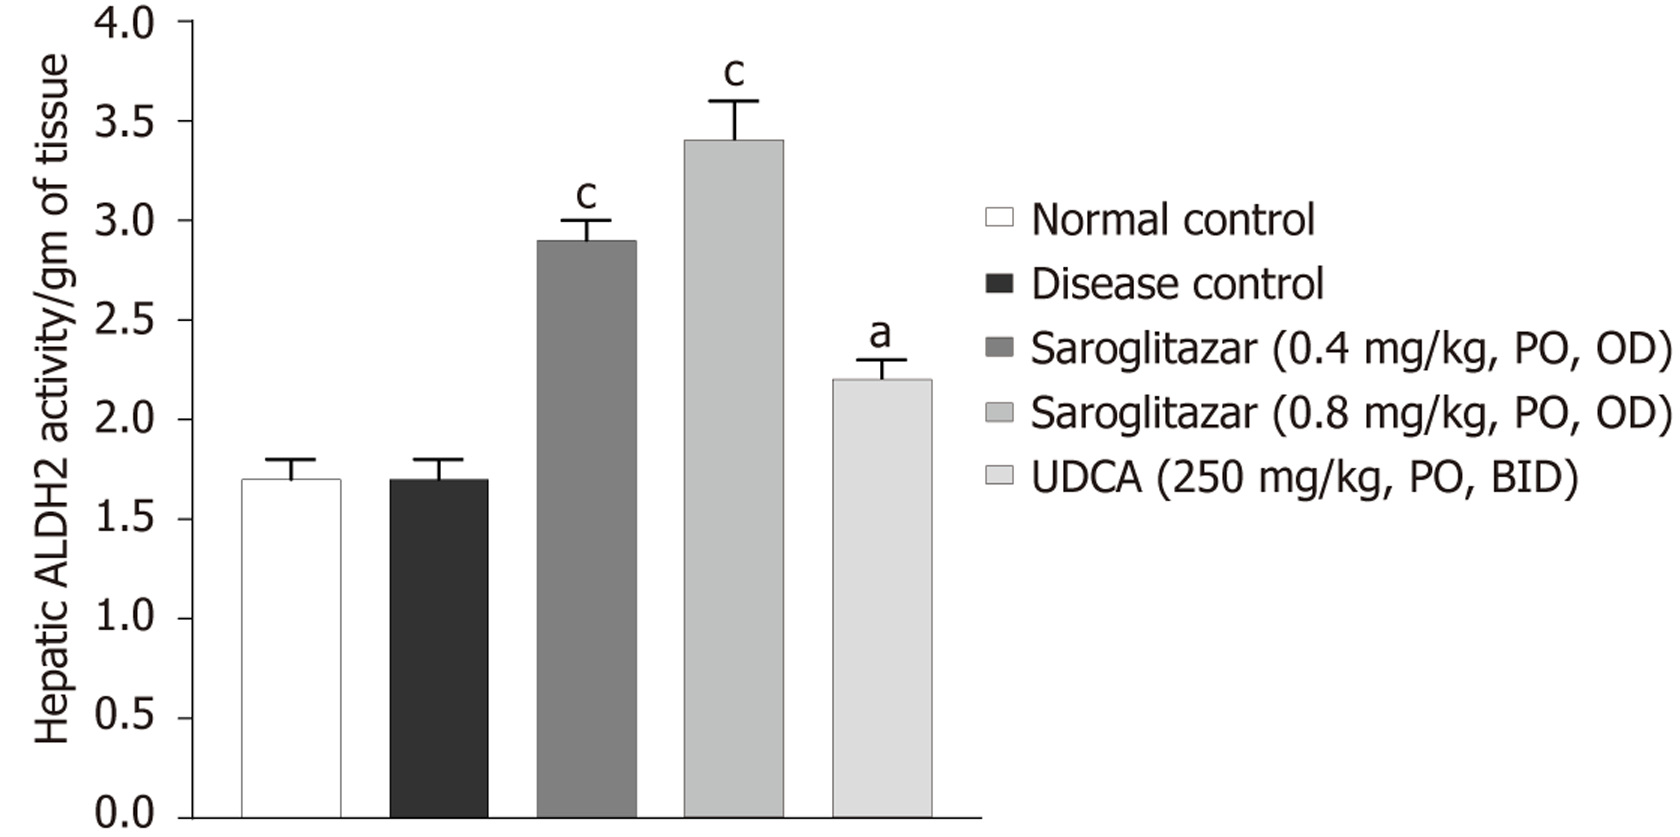
Figure 4 Effect of saroglitazar on liver aldehyde dehydrogenase 2 activity in therapeutic study design: Mice received saroglitazar or vehicle during a 4-week ethanol-feeding protocol.
Liver samples were collected 9 hours after the ethanol binge to determine aldehyde dehydrogenase 2 activity using an enzyme-linked immunosorbent assay-based assay. It shows hepatic aldehyde dehydrogenase 2 activity expressed as mean ± SEM (n = 8 for normal control and n = 9 disease control and treatments). Statistical analysis was performed using one-way analysis of variance followed by Dunnett’s multiple comparison test. aP < 0.05, cP < 0.001 vs disease control group. PO: Orally; OD: Once daily; BID: Twice daily; UDCA: Ursodeoxycholic acid; ALDH2: Aldehyde dehydrogenase 2.
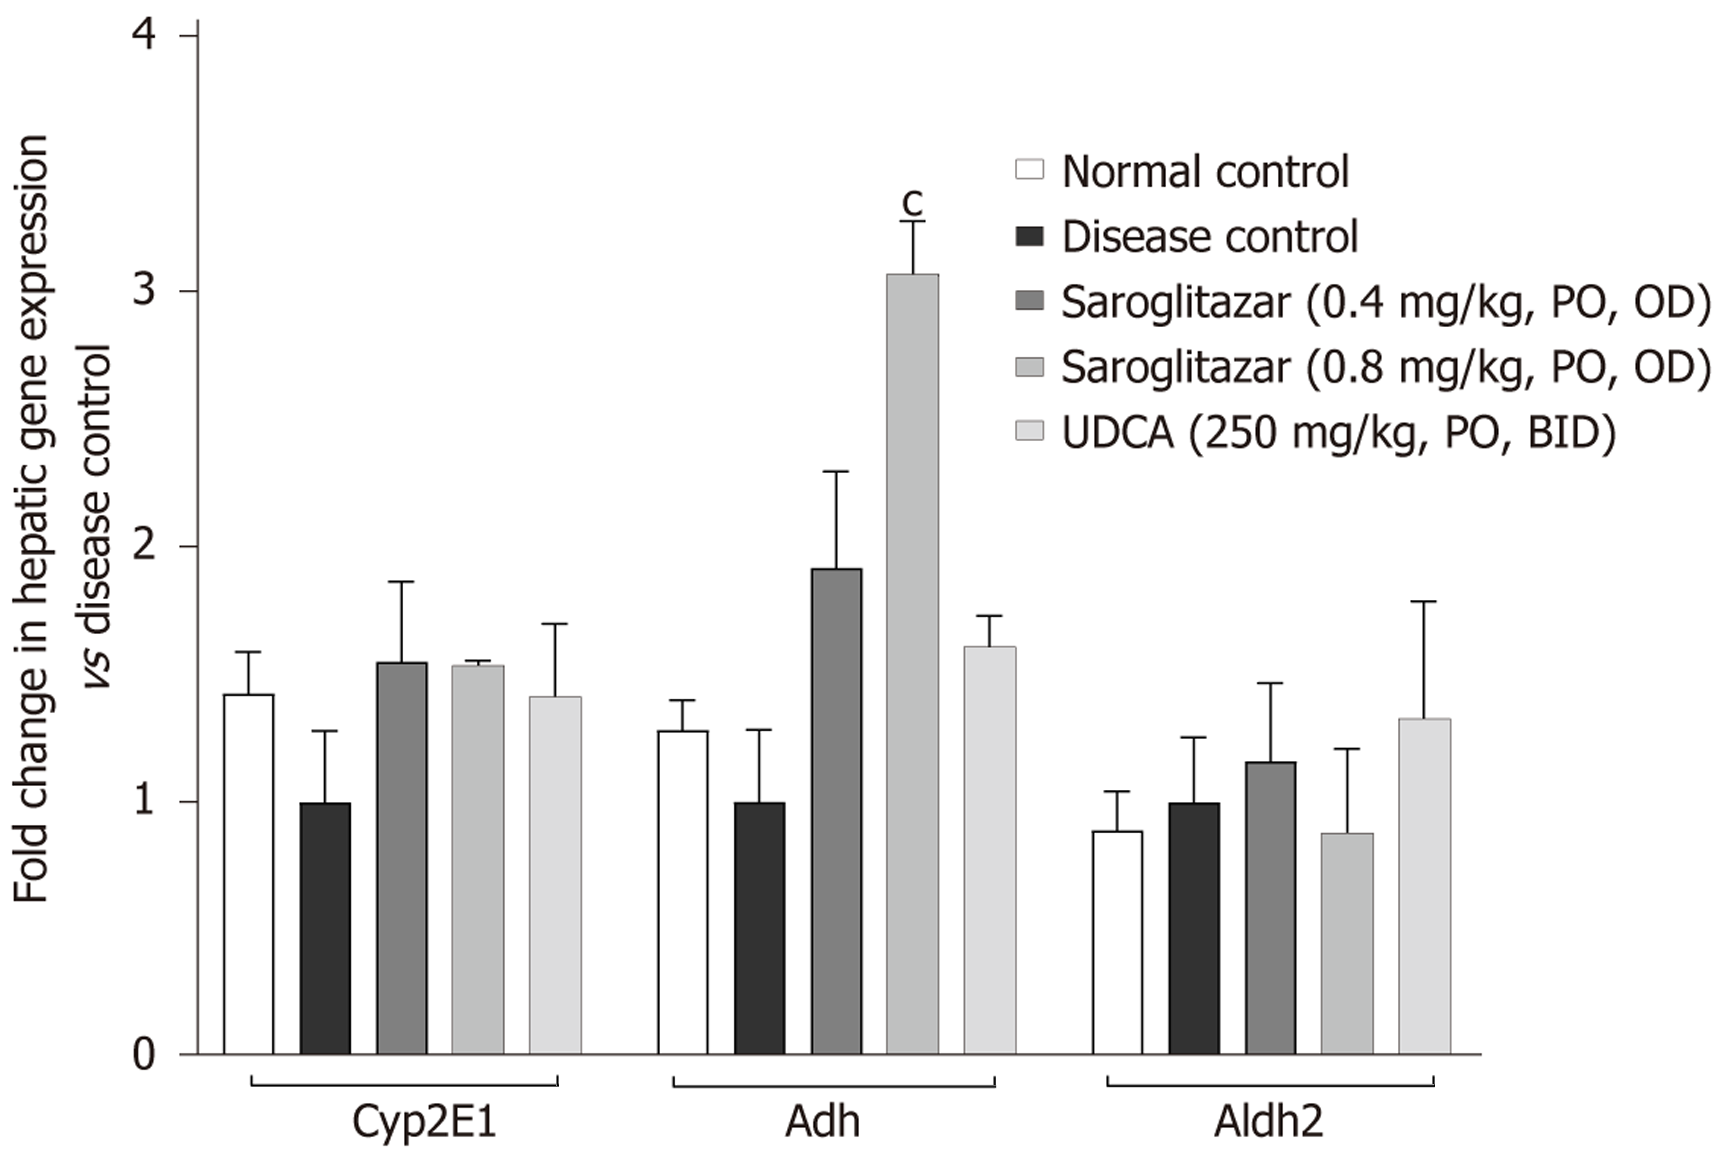
Figure 5 Effect of saroglitazar on hepatic genes involved in alcohol metabolism.
Liver mRNA expression of genes involved in alcohol metabolism was assessed by quantitative polymerase chain reaction. It shows the expression levels of key metabolic genes, including Cyp2E1, Adh and Aldh2, in liver tissue from mice treated with saroglitazar or vehicle. Data are presented as mean ± SEM (n = 8 for normal control and n = 9 disease control and treatments). Statistical analysis was performed using one-way analysis of variance followed by Dunnett’s multiple comparison test. cP < 0.001 vs disease control group. PO: Orally; OD: Once daily; BID: Twice daily; UDCA: Ursodeoxycholic acid.
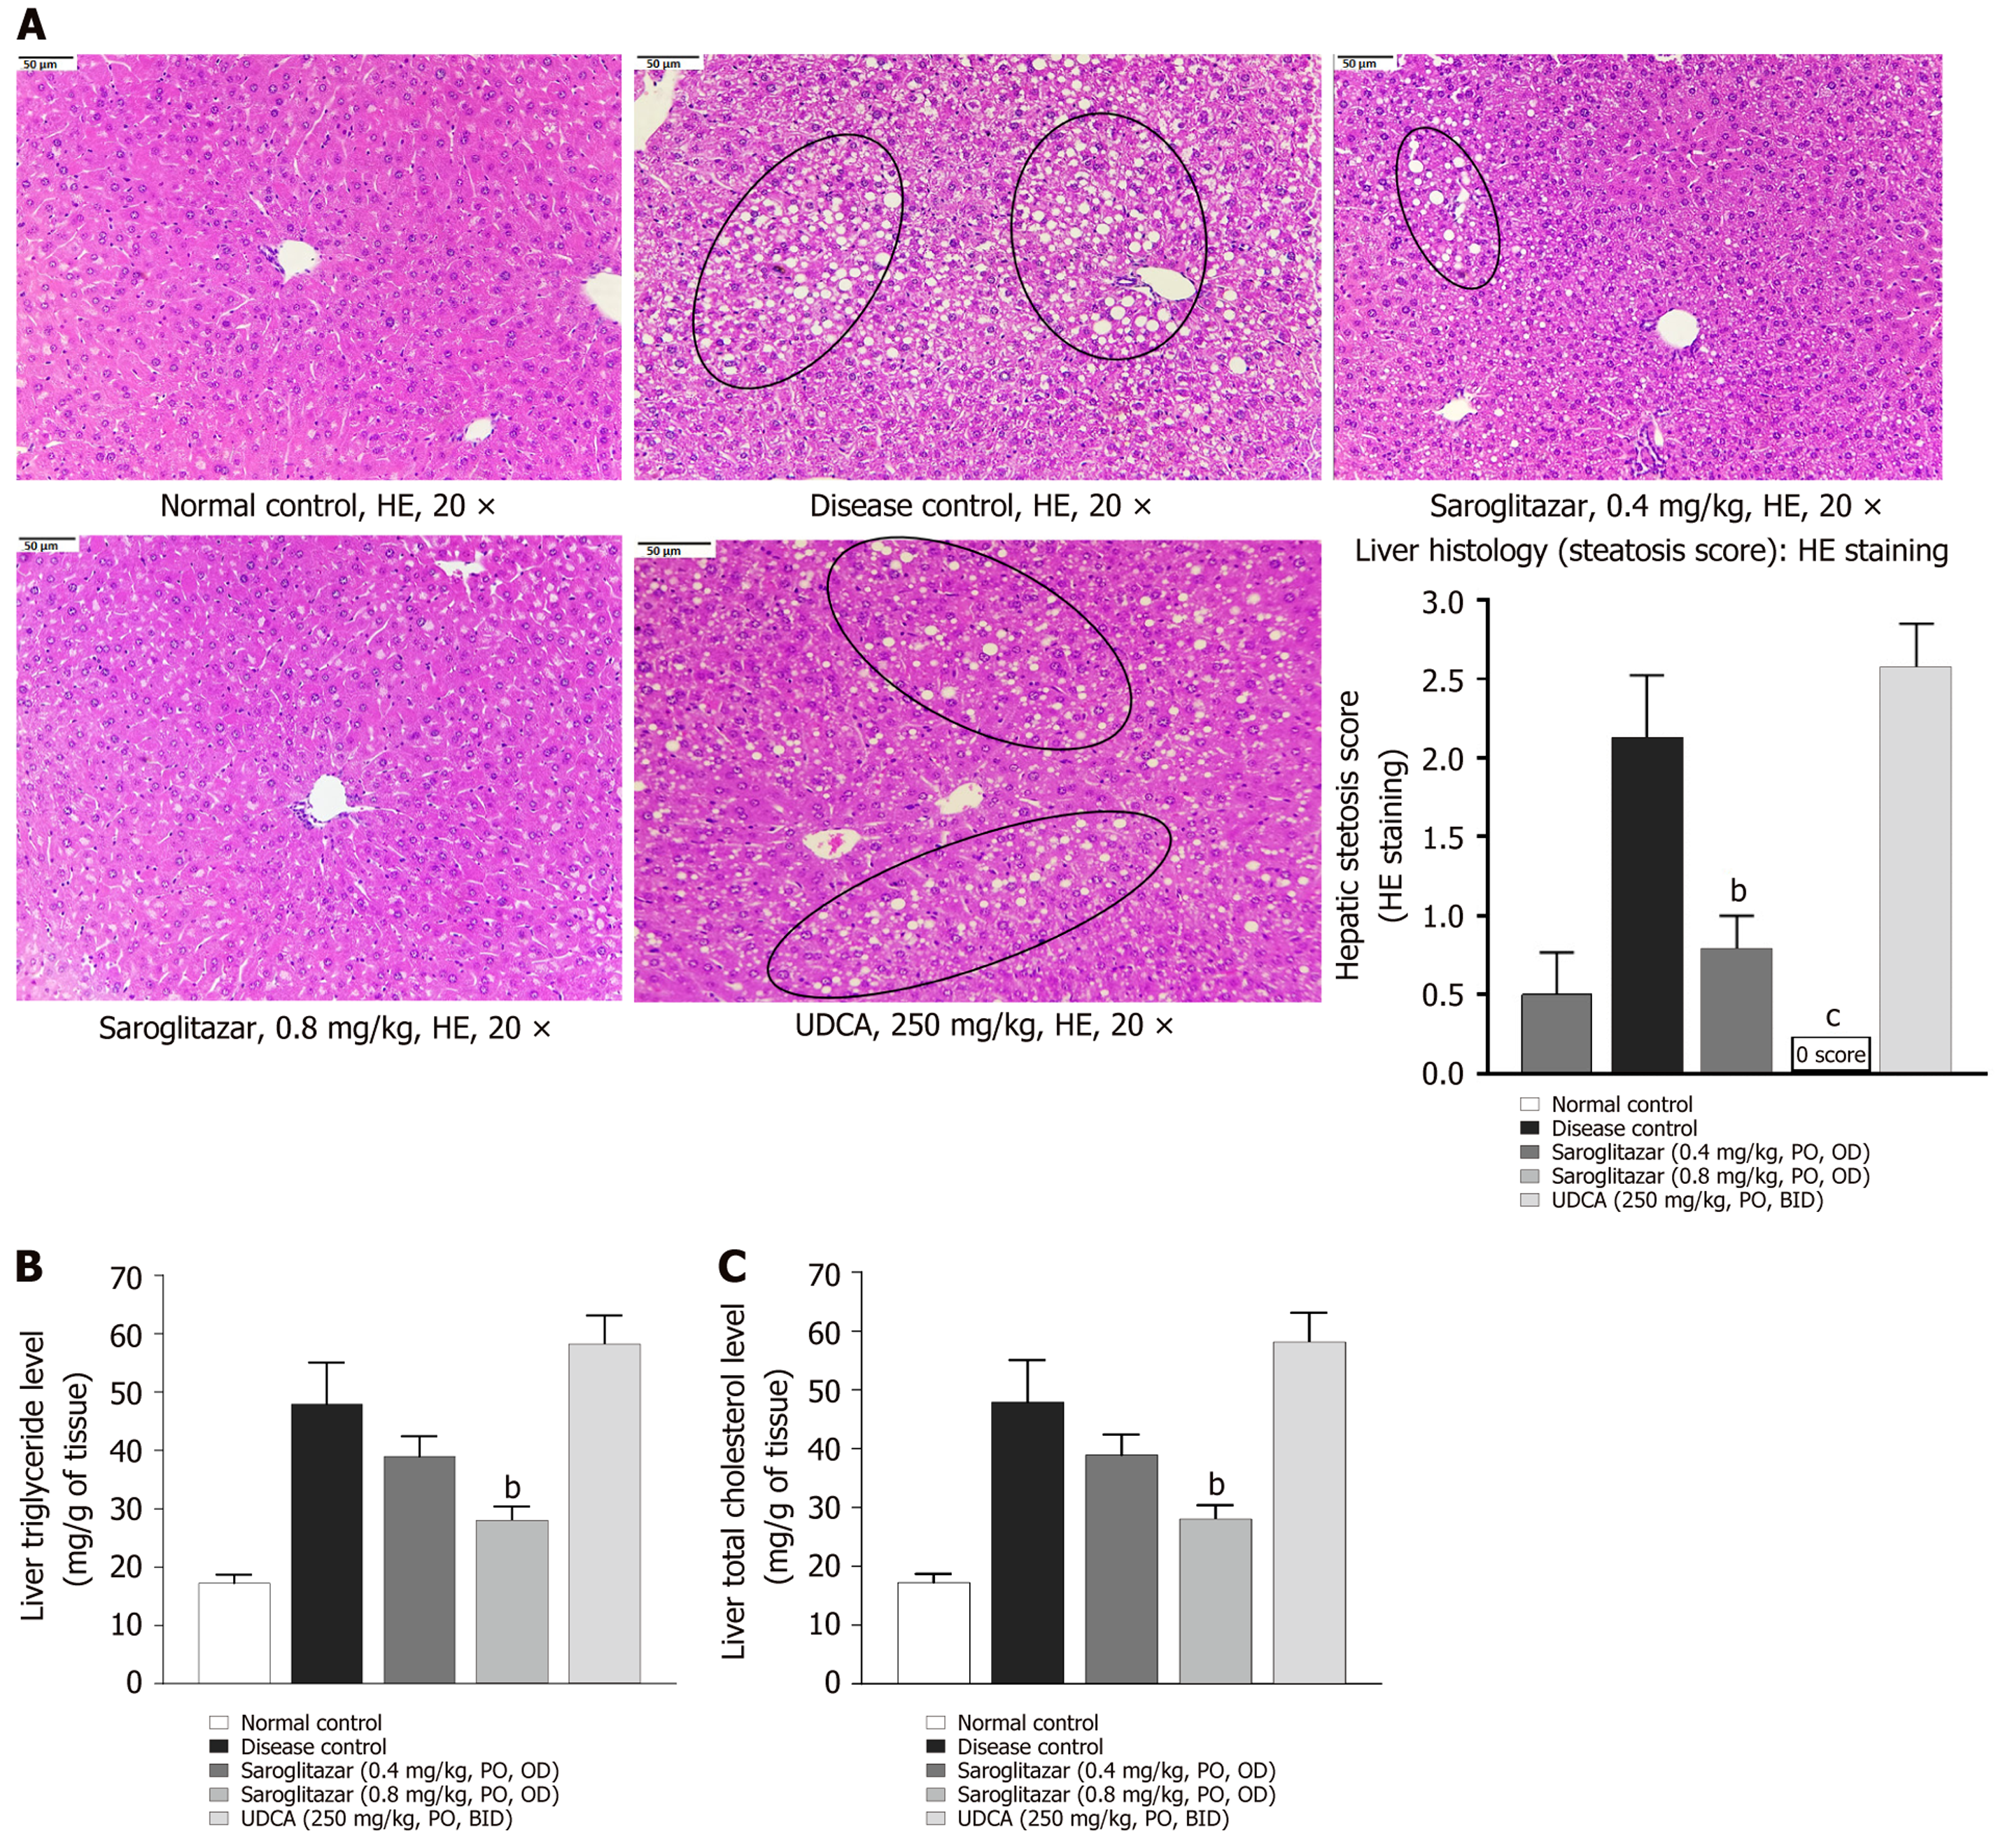
Figure 6 Effect of saroglitazar on hepatic steatosis and lipid accumulation in therapeutic study design.
A: Liver histology was evaluated using hematoxylin and eosin staining to assess the degree of steatosis. bP < 0.01, cP < 0.001; B and C: Liver tissue samples were homogenized to quantify hepatic triglyceride and total cholesterol levels. Data are presented as mean ± SEM (n = 8 for normal control and n = 9 disease control and treatments). Statistical analysis was performed using oneway analysis of variance followed by Dunnett’s multiple comparison test. bP < 0.01 vs disease control group. HE: Hematoxylin and eosin; PO: Orally; OD: Once daily; BID: Twice daily; UDCA: Ursodeoxycholic acid.
- Citation: Giri SR, Bhoi B, Trivedi C, Rath A, Jadhav V, Palode S, Ranvir R, Patel A, Sundar R, Patel H, Jain MR. Saroglitazar ameliorates alcoholic liver disease and is associated with enhanced ethanol metabolism. World J Hepatol 2026; 18(7): 120153
- URL: https://www.wjgnet.com/1948-5182/full/v18/i7/120153.htm
- DOI: https://dx.doi.org/10.4254/wjh.120153