
















Copyright: ©Author(s) 2026.
World J Hepatol. Oct 27, 2026; 18(10): 124709
Published online Oct 27, 2026. doi: 10.4254/wjh.124709
Published online Oct 27, 2026. doi: 10.4254/wjh.124709
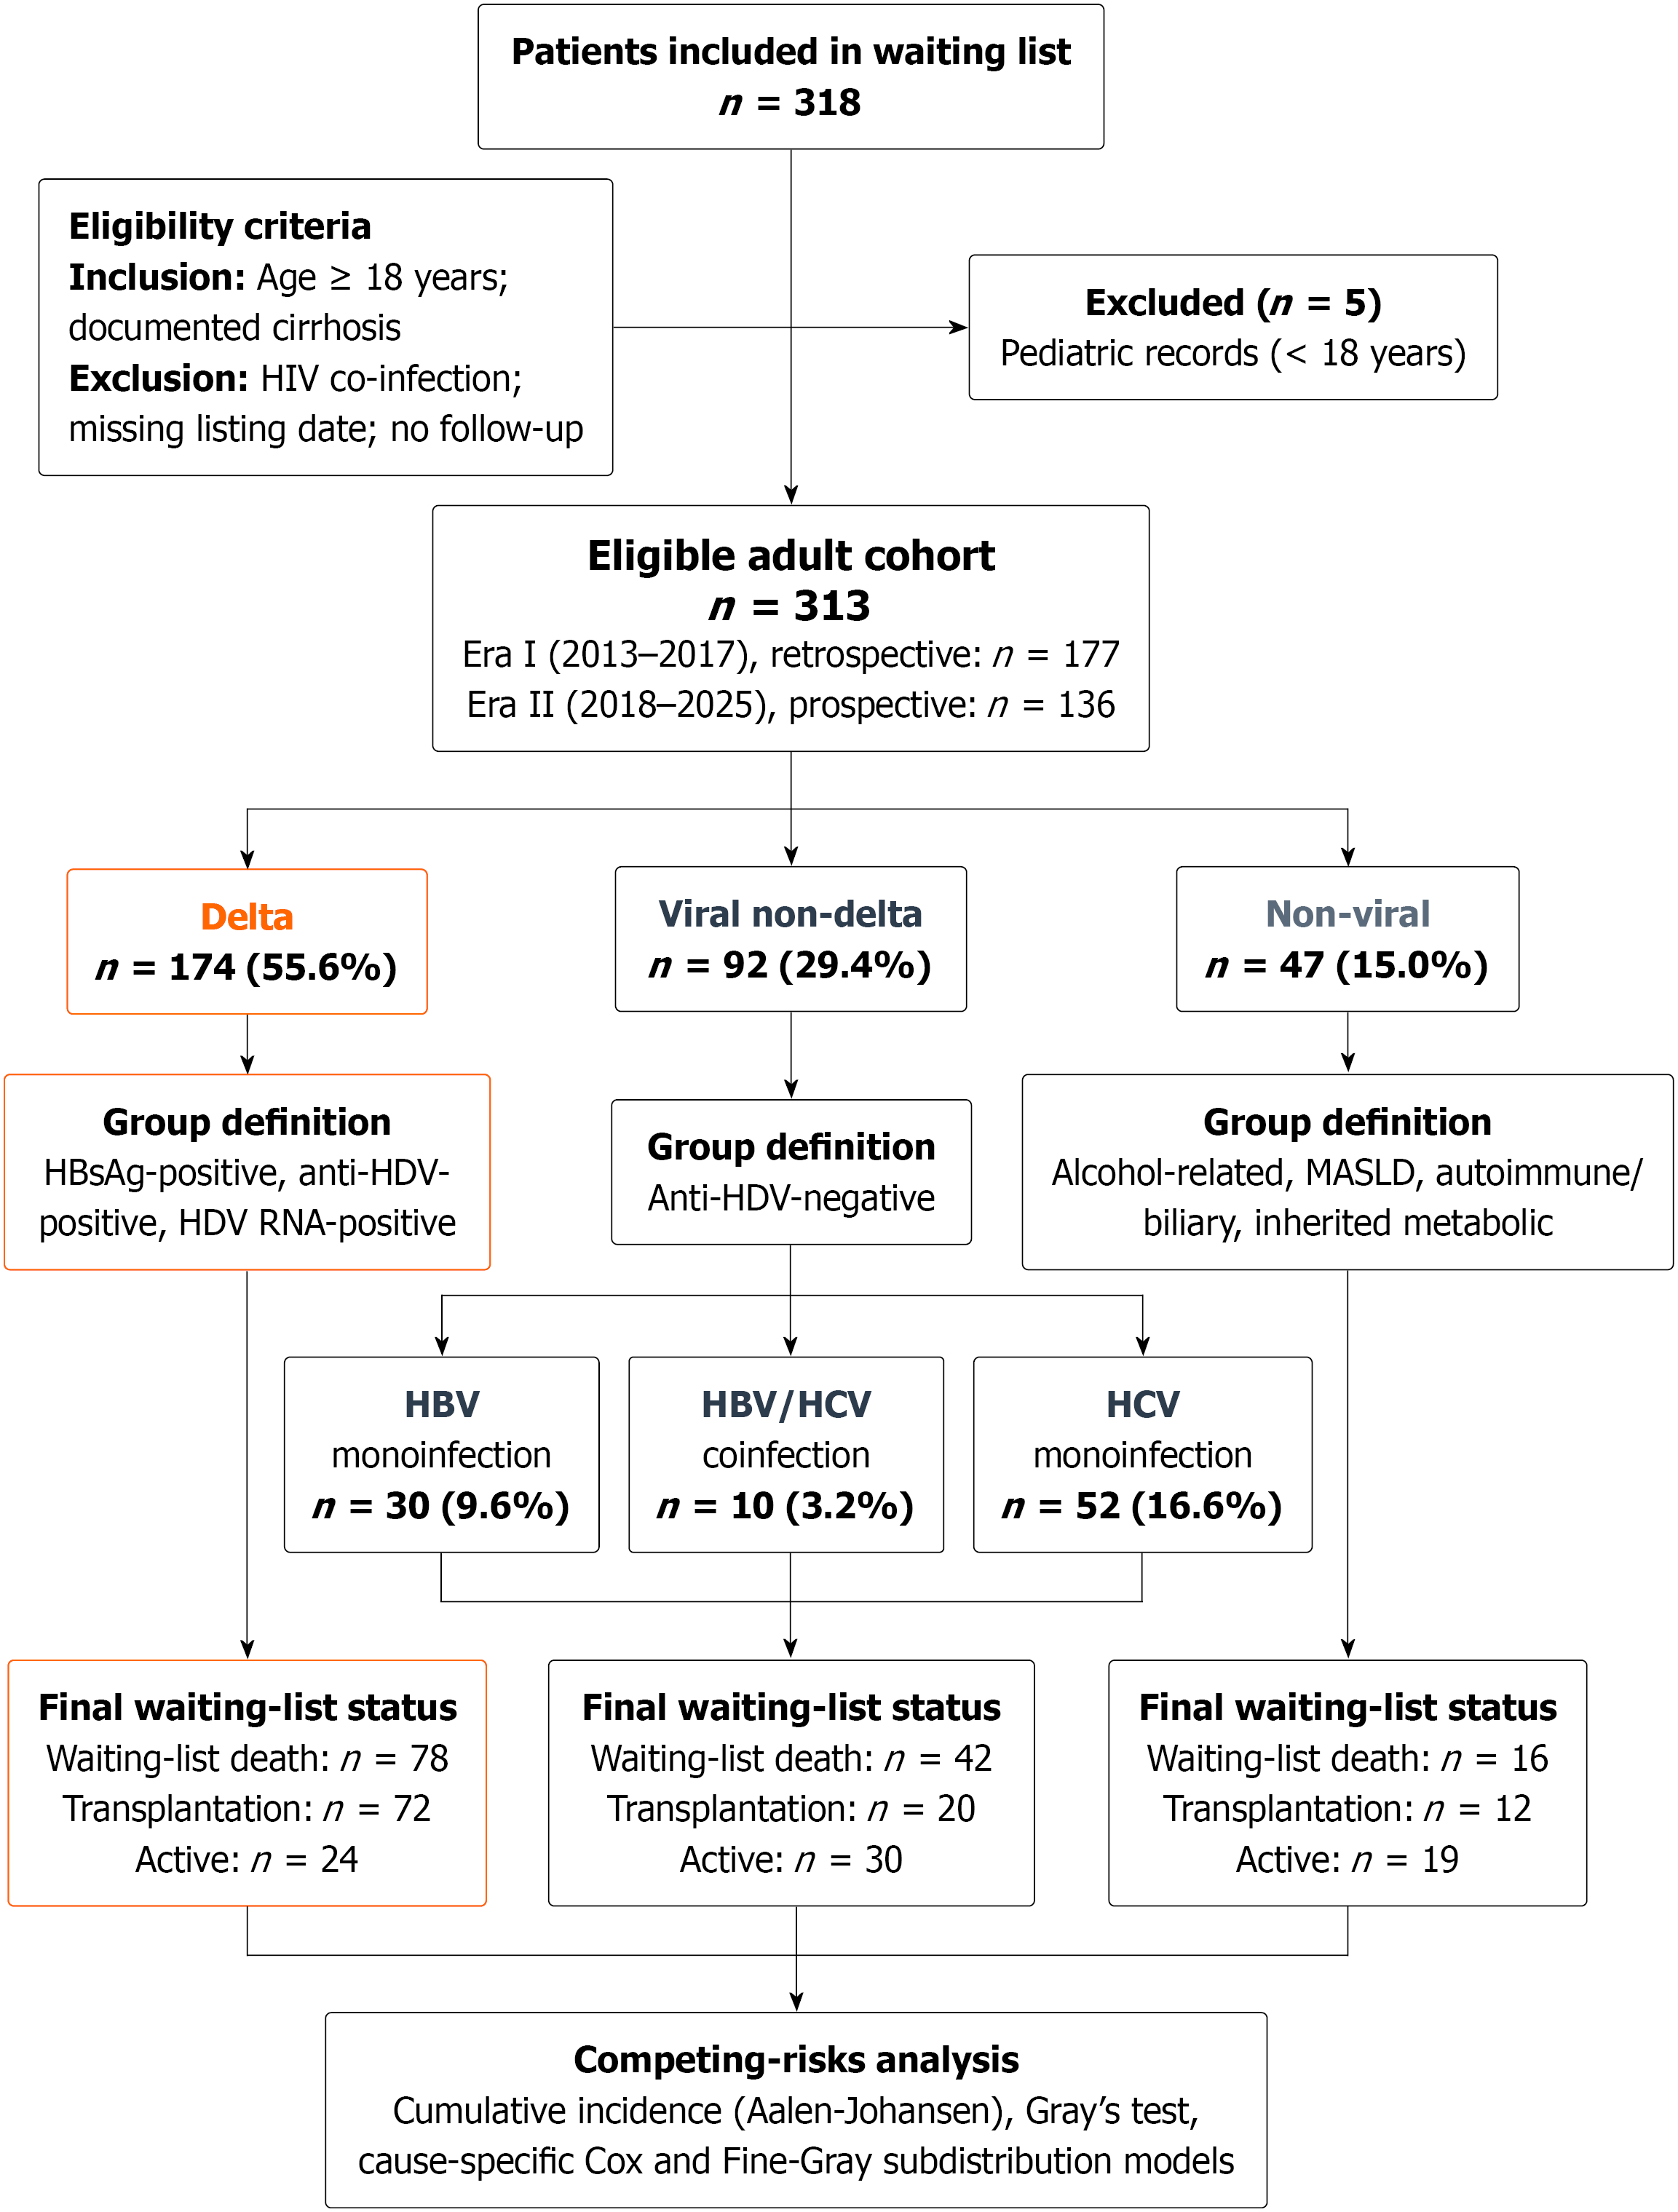
Figure 1 Flow diagram of the national liver transplant cohort.
Of 318 patients screened, five pediatric patients were excluded, resulting in a final study cohort of 313 adults. Patients were classified into three etiological groups: The delta group (anti- hepatitis delta virus (HDV) positive with detectable HDV RNA; n = 174, 55.6%), the non-delta viral group (n = 92, 29.4%), and the non-viral group (n = 47, 15.0%). The non-delta viral group included only anti-HDV-negative patients with hepatitis B virus (HBV) monoinfection (HBsAg positive with detectable HBV DNA; n = 30, 9.6%), HBV/hepatitis C virus (HCV) coinfection (n = 10, 3.2%), or HCV monoinfection (anti-HCV positive with detectable HCV RNA; n = 52, 16.6%). HCV: Hepatitis C virus; HBV: Hepatitis B virus.
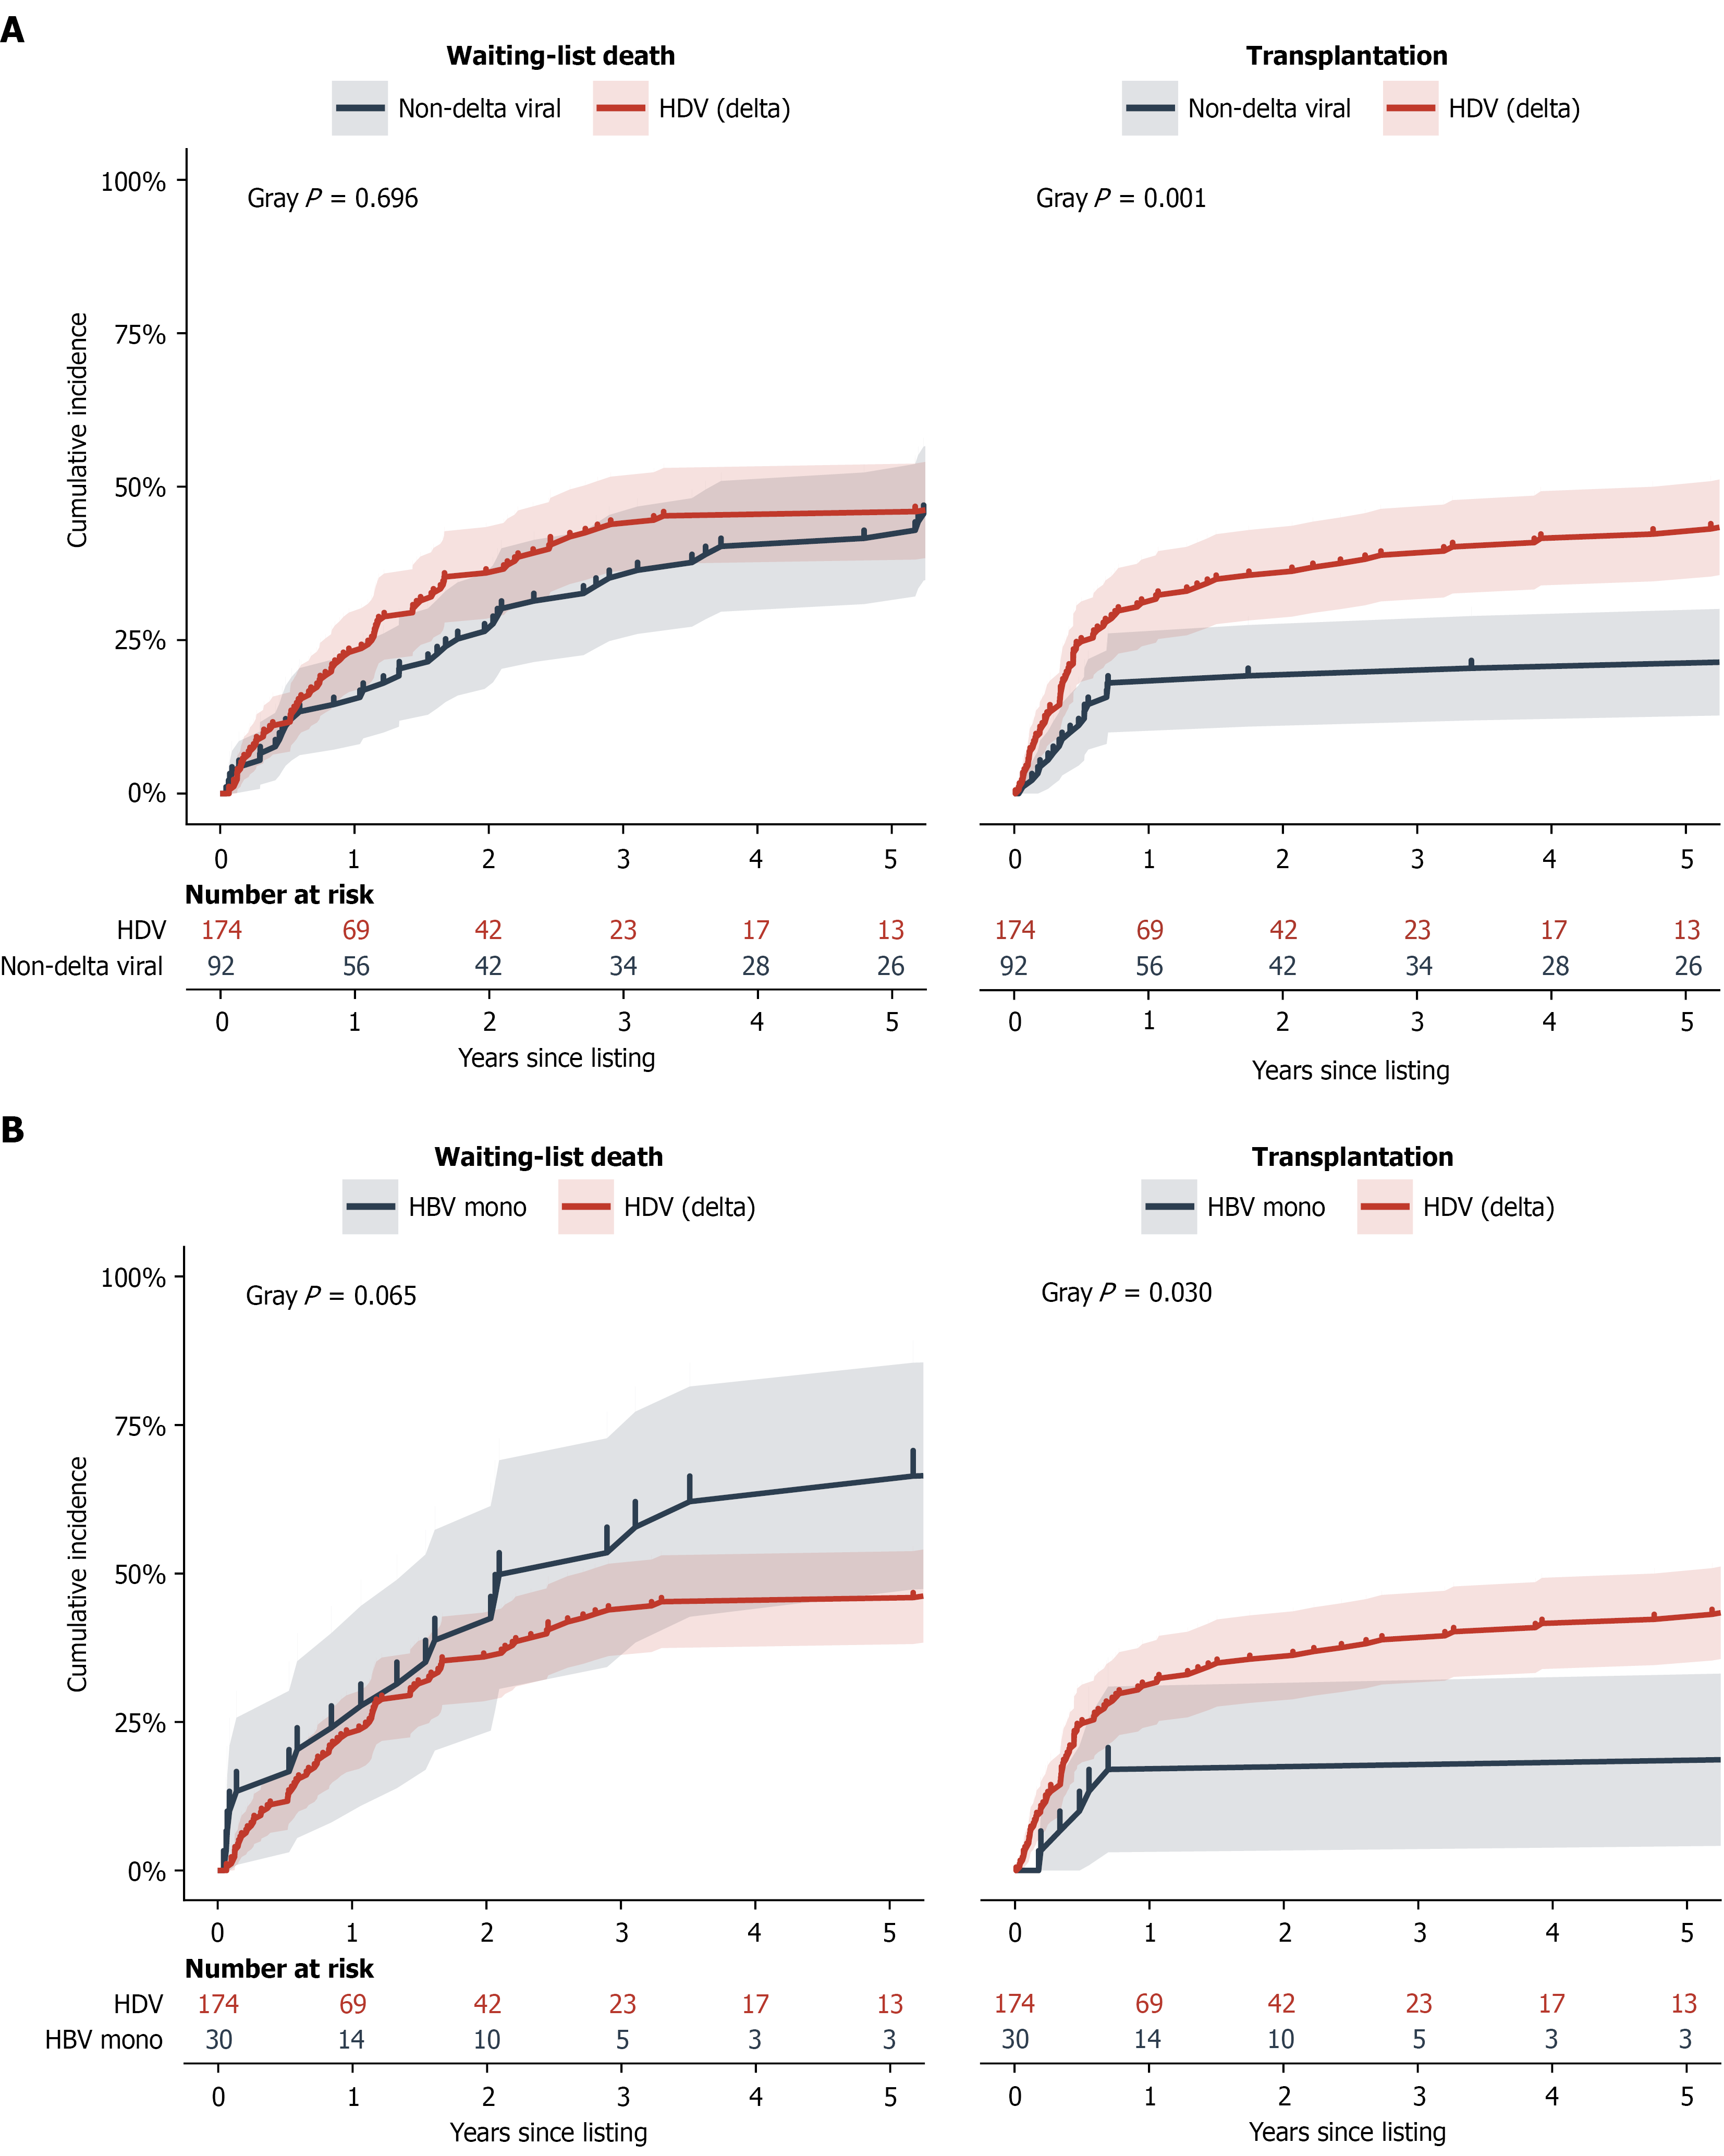
Figure 2 Cumulative incidence of waiting-list death and liver transplantation.
A: In the delta group and non-delta viral group. Cumulative incidence functions were estimated using the Aalen-Johansen method for 266 patients with viral liver disease and stratified by infection status as delta group and non-delta viral group, with waiting-list death and liver transplantation treated as competing events. Shaded areas represent 95%CI. The cumulative incidence of waiting-list death was similar between groups (Gray’s test, P = 0.696), whereas transplantation occurred significantly more frequently in the hepatitis delta virus group (Gray’s test, P = 0.001); B: In the delta group and hepatitis B virus monoinfection group. Cumulative incidence functions were estimated using the Aalen-Johansen method in 204 patients and stratified by infection status, with waiting-list death and liver transplantation treated as competing events. Shaded areas represent 95%CI. Owing to the small number of patients in hepatitis B virus monoinfection group (n = 30), the confidence intervals are wide, particularly for waiting-list death; therefore, mortality findings in this subgroup should be interpreted cautiously and regarded as exploratory. HDV: Hepatitis delta virus; HBV: Hepatitis B virus.
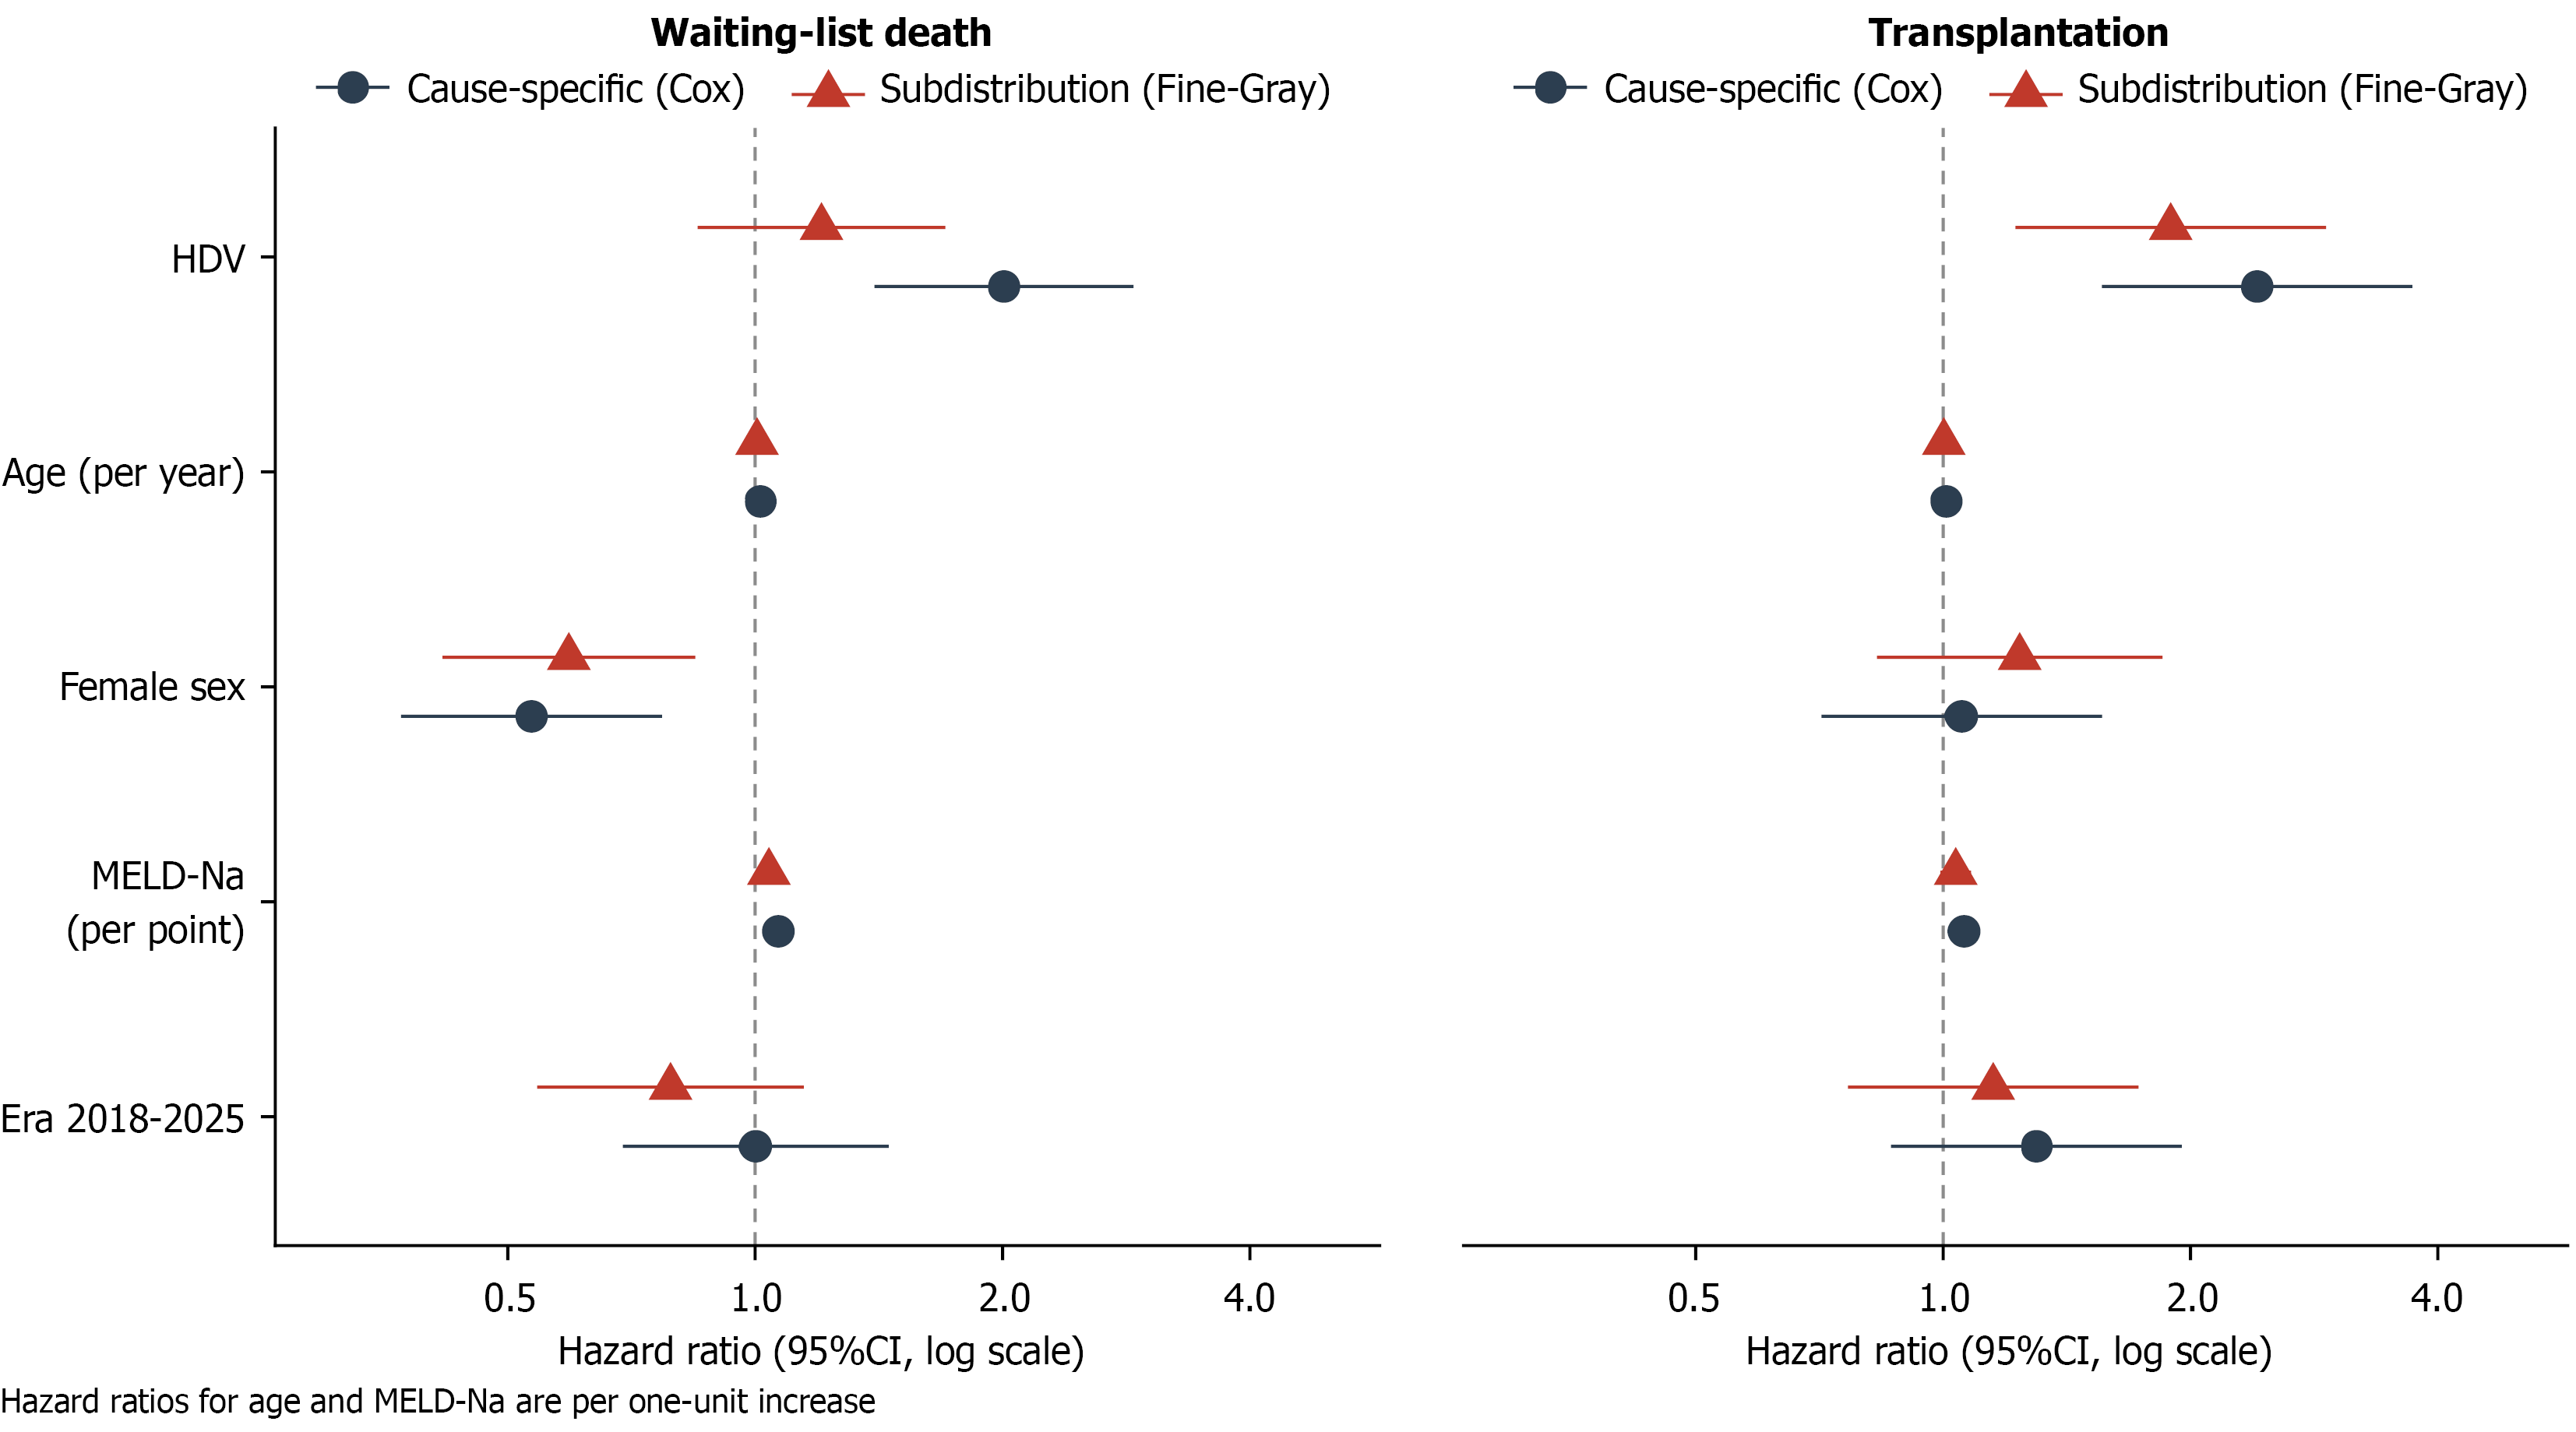
Figure 3 Multivariable cause-specific and subdistribution hazard models for waiting-list death and liver transplantation.
The forest plot presents adjusted cause-specific hazard ratios from Cox regression and adjusted subdistribution hazard ratios from Fine-Gray regression in 313 patients (all cohort). Hepatitis D virus (HDV) infection was associated with an approximately twofold higher cause-specific hazard of death, whereas the corresponding subdistribution hazard ratio was closer to unity, indicating attenuation of the cumulative incidence of death by the competing effect of more frequent transplantation in patients with HDV. For transplantation, HDV infection was associated with hazard ratios above unity in both models, indicating higher instantaneous and cumulative transplantation rates. Female sex was associated with a lower hazard of waiting-list death. Age and model for end-stage liver disease-sodium were modeled per one-year and one-point increase, respectively. Circles indicate cause-specific hazard ratios, triangles indicate subdistribution hazard ratios, and horizontal bars represent 95%CI. Estimates are shown on a logarithmic scale, with the dashed vertical line at 1 indicating no association. HDV: Hepatitis delta virus; MELD-Na: Model for end-stage liver disease–sodium.
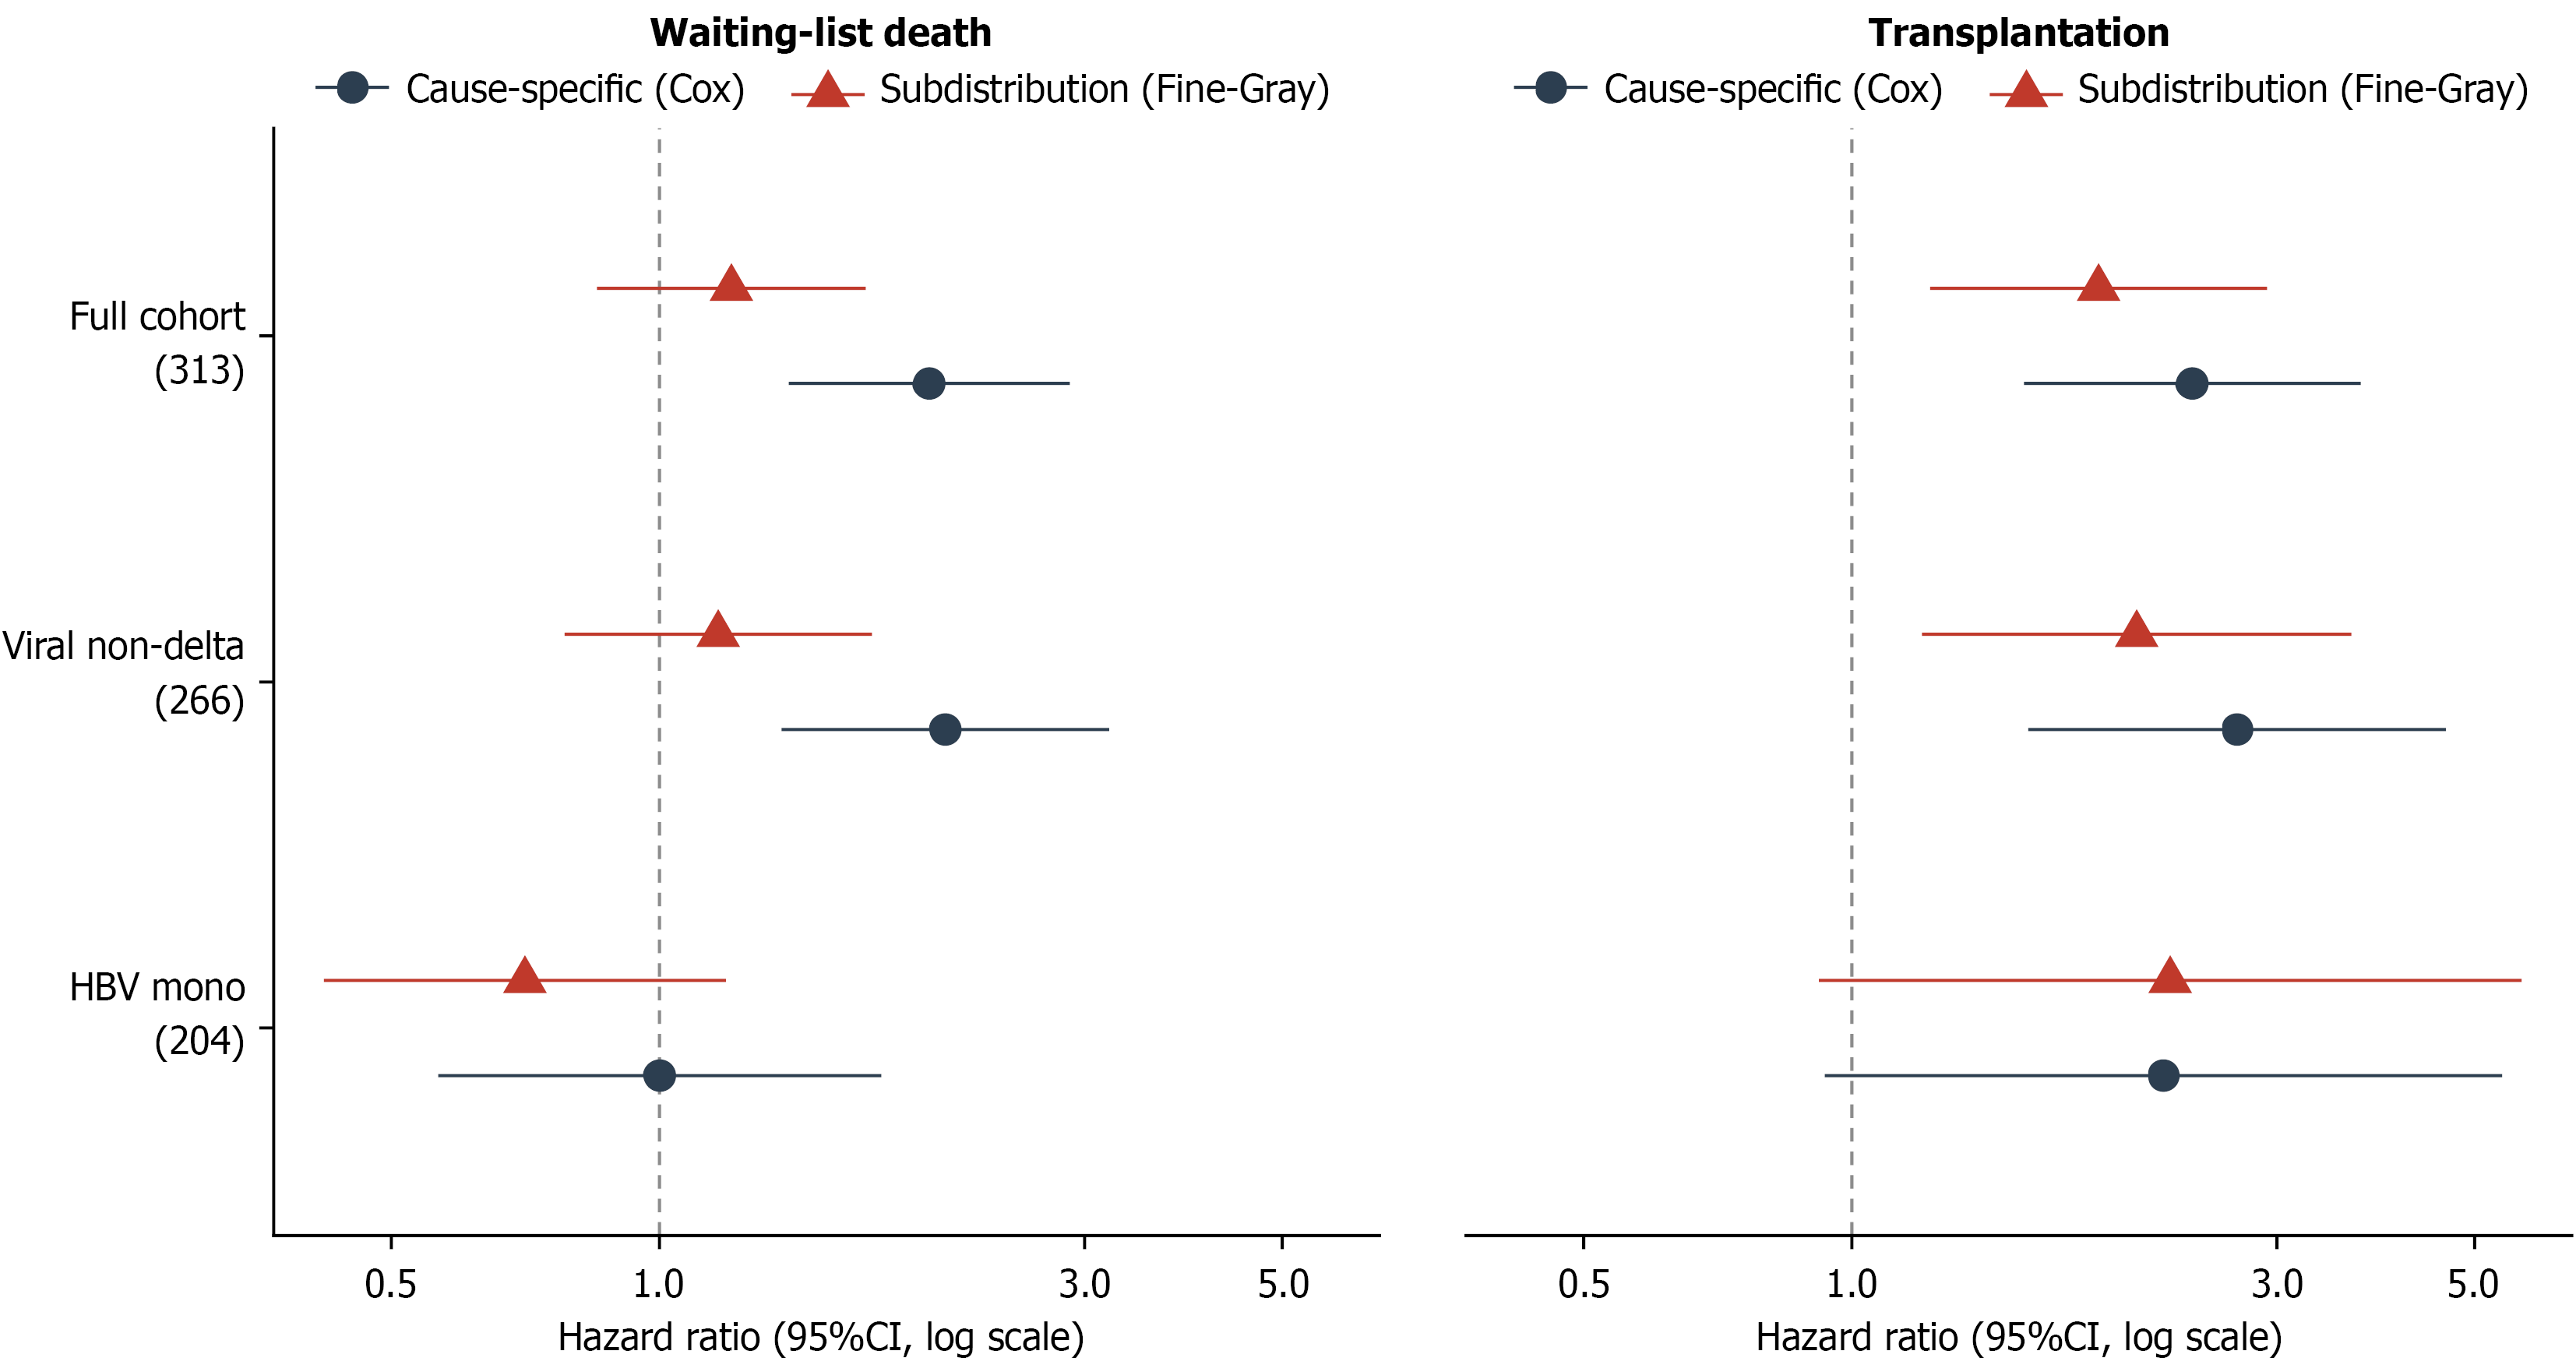
Figure 4 Sensitivity analysis of the association between hepatitis delta virus infection and competing waiting-list outcomes across alternative comparison cohorts.
Adjusted cause-specific and Fine-Gray hazard ratios with 95%CI are shown for waiting-list death and liver transplantation in the full cohort (313 patients-all patient included in study), the viral nondelta cohort (266 patients-patients from delta and nondelta viral groups), and the hepatitis B virus (HBV) mono cohort (204 patients-delta and HBV monoinfection group). Hepatitis delta virus infection was associated with higher cause-specific mortality in the full and viral non-delta cohorts and with higher transplantation hazards across all comparisons. The dashed vertical line indicates a hazard ratio of 1. HBV: Hepatitis B virus.
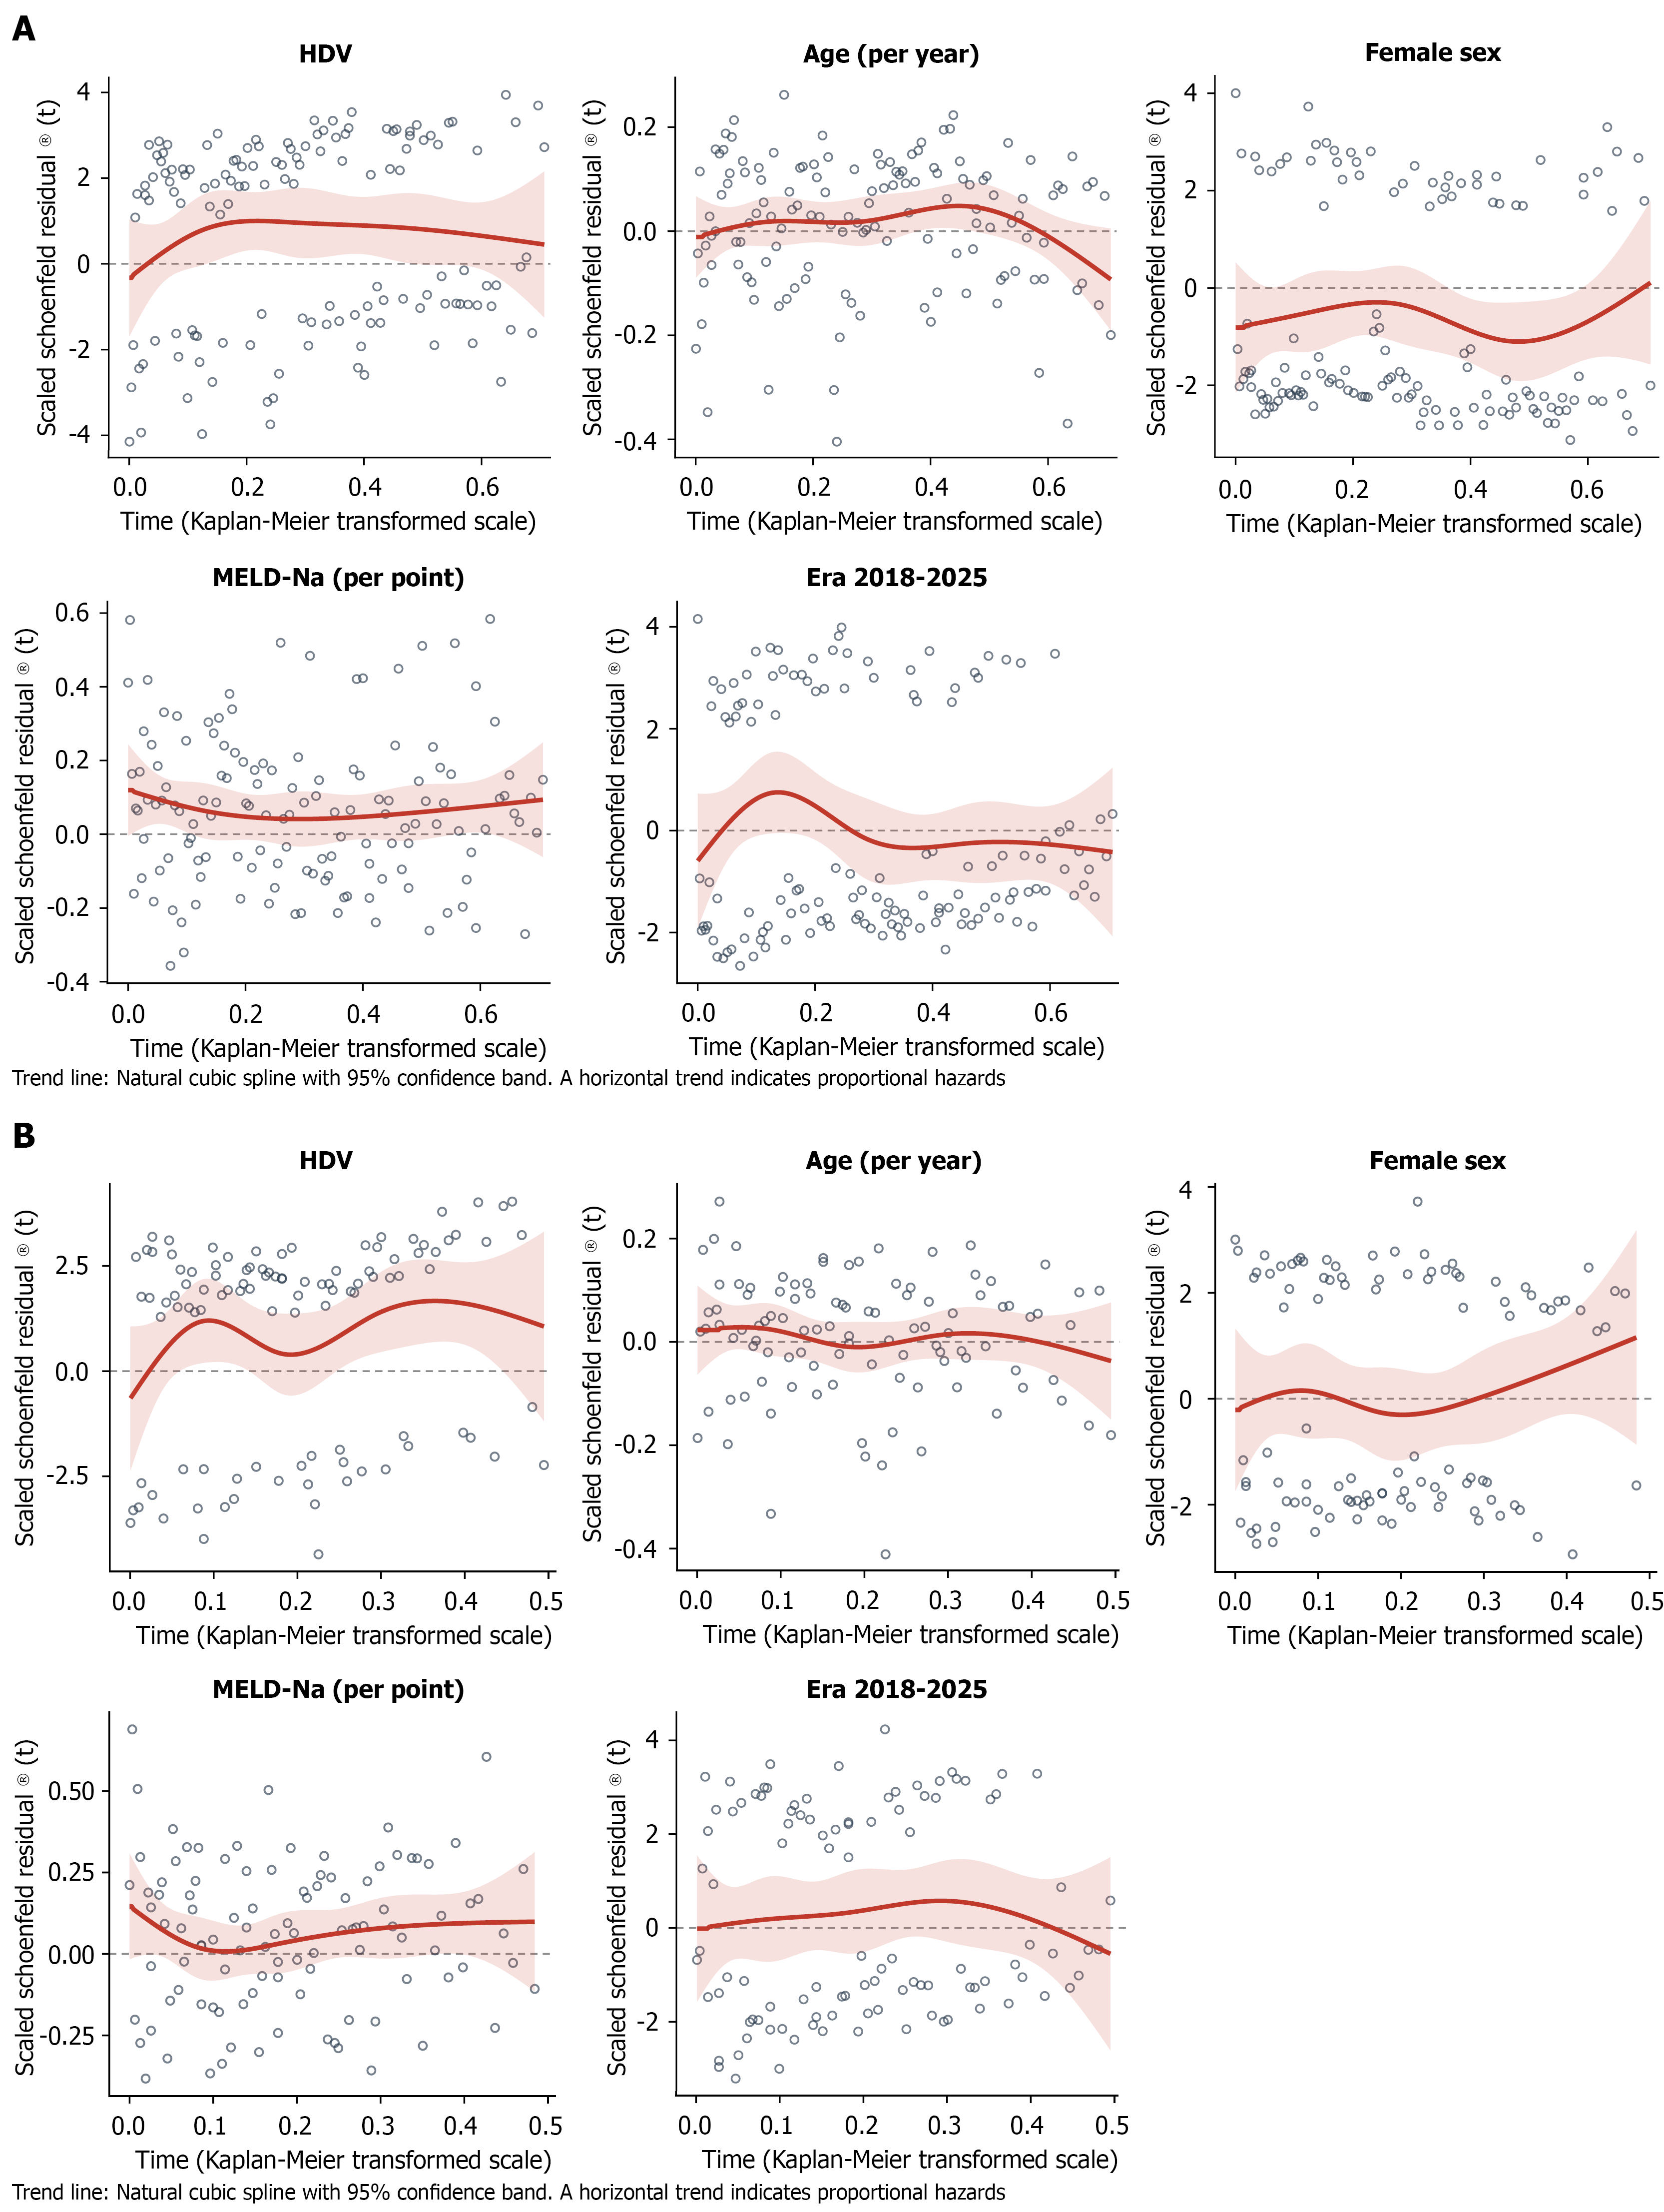
Figure 5 Assessment of the proportional hazard assumption for the cause-specific Cox model.
A: For Waiting-list death. Scaled Schoenfeld residuals are plotted against Kaplan-Meier-transformed follow-up time for each covariate. Open circles represent the residuals, solid lines show smoothed time-varying effects, and dashed lines indicate 95% confidence bands. Approximately horizontal trends support the proportional hazards assumption. No significant time-dependent effect was observed for hepatitis delta virus infection (P = 0.479) or for the model overall (global test, P = 0.819). Minor fluctuations late in follow-up should be interpreted cautiously because of the smaller number of patients at risk and greater uncertainty; B: For liver transplantation. Most covariates showed no relevant variation in their effects over follow-up. Hepatitis D virus (HDV) infection displayed a modest upward trend, consistent with a stronger transplantation effect after the first year and a Schoenfeld test that approached, but did not reach, statistical significance (P = 0.061). This finding suggests a possible temporal variation in the HDV-associated transplantation hazard without providing formal evidence of non-proportionality. HDV: Hepatitis delta virus; MELD-Na: Model for end-stage liver disease–sodium.
- Citation: Peltec A, Buga D, Hotineanu A, Wedemeyer H. Impact of hepatitis delta virus infection on waiting list outcomes: A competing-risks analysis. World J Hepatol 2026; 18(10): 124709
- URL: https://www.wjgnet.com/1948-5182/full/v18/i10/124709.htm
- DOI: https://dx.doi.org/10.4254/wjh.124709