
















Copyright: ©Author(s) 2026.
World J Hepatol. Oct 27, 2026; 18(10): 124577
Published online Oct 27, 2026. doi: 10.4254/wjh.124577
Published online Oct 27, 2026. doi: 10.4254/wjh.124577
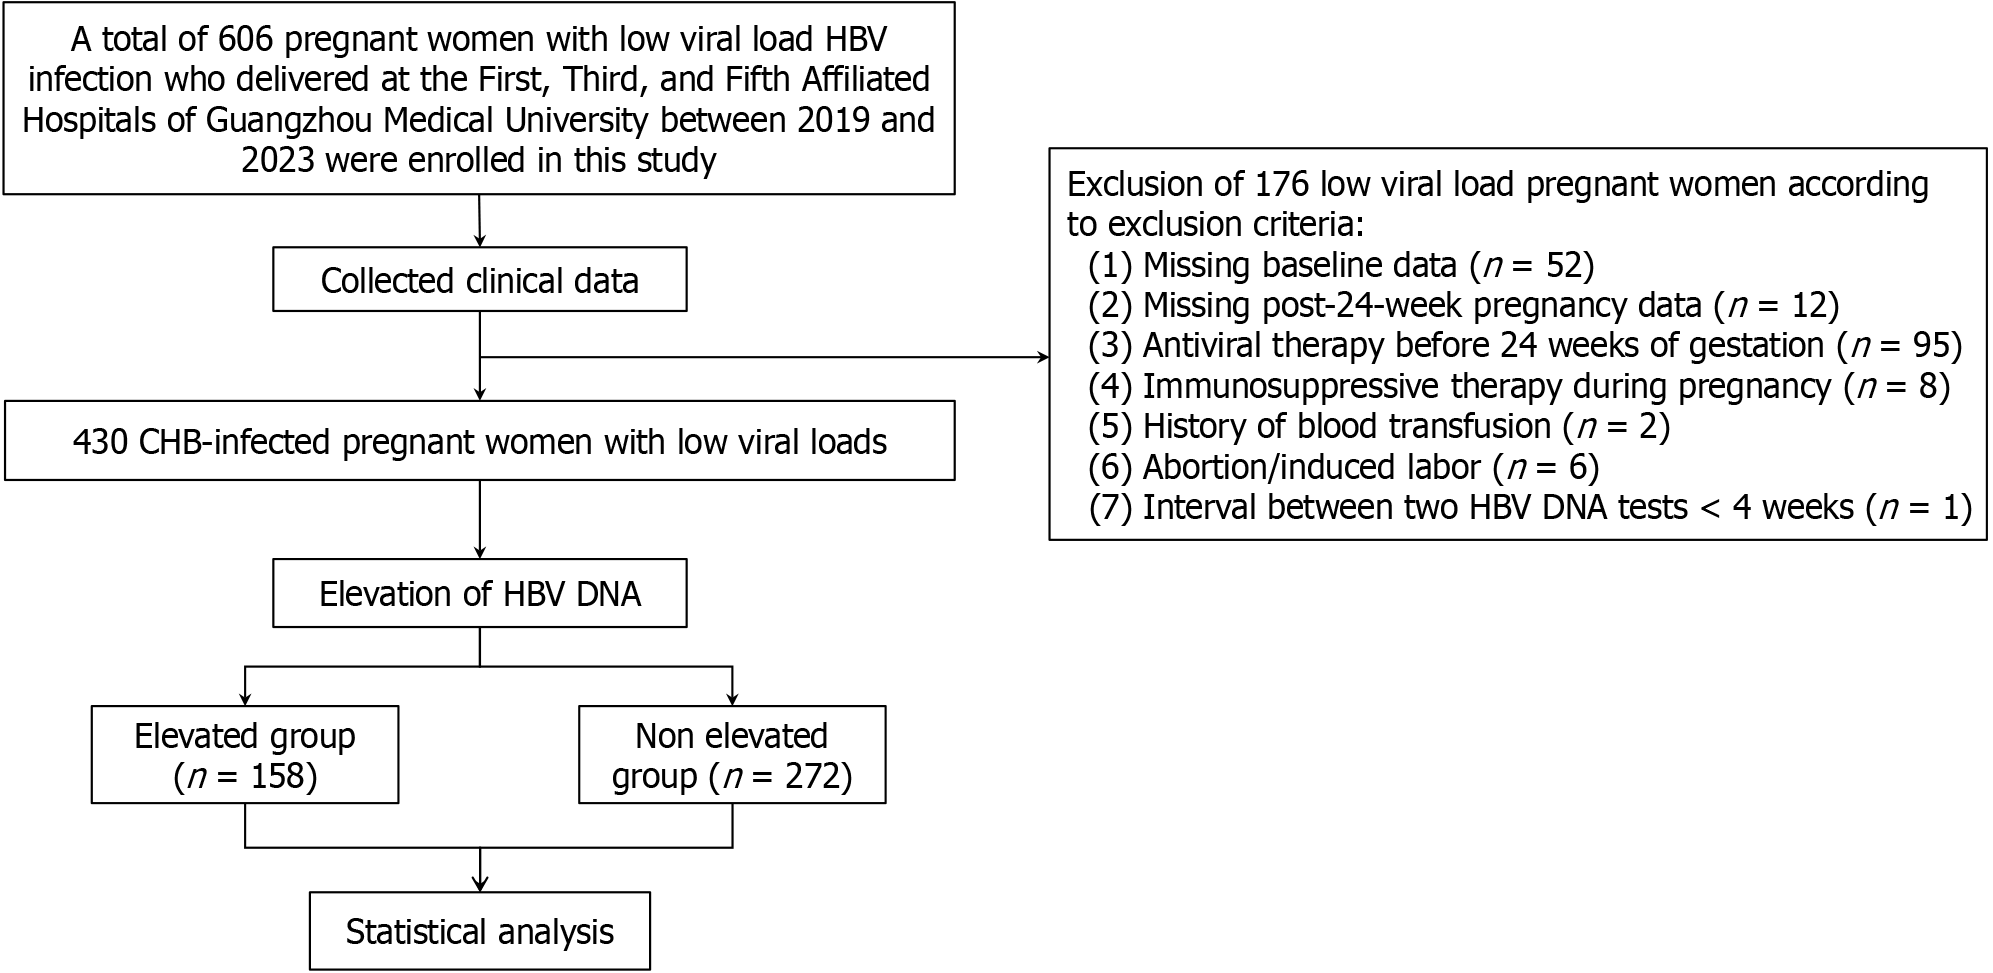
Figure 1 Enrollment flowchart.
HBV: Hepatitis B virus; CHB: Chronic hepatitis B.
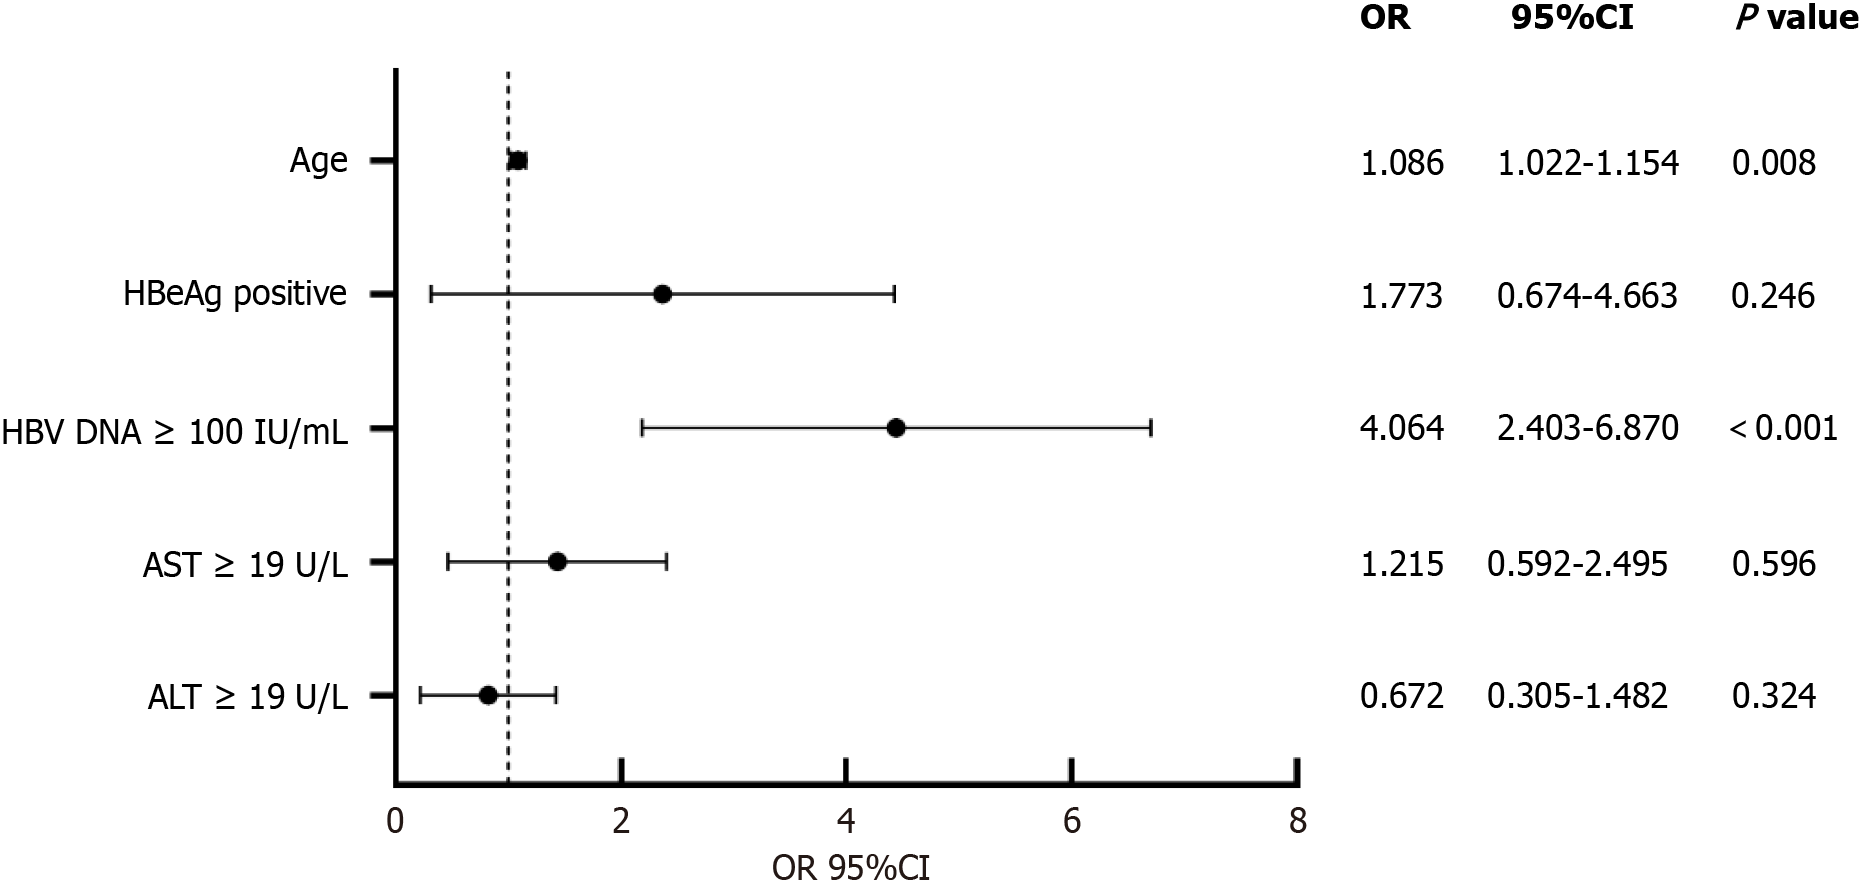
Figure 2 Multivariate logistic regression analysis of elevated hepatitis B virus DNA in the middle and late stages of pregnancy.
OR: Odds ratio; CI: Confidence interval; HBV: Hepatitis B virus; HBeAg: Hepatitis B virus e Antigen; AST: Aspartate Aminotransferase; ALT: Alanine Aminotransferase.
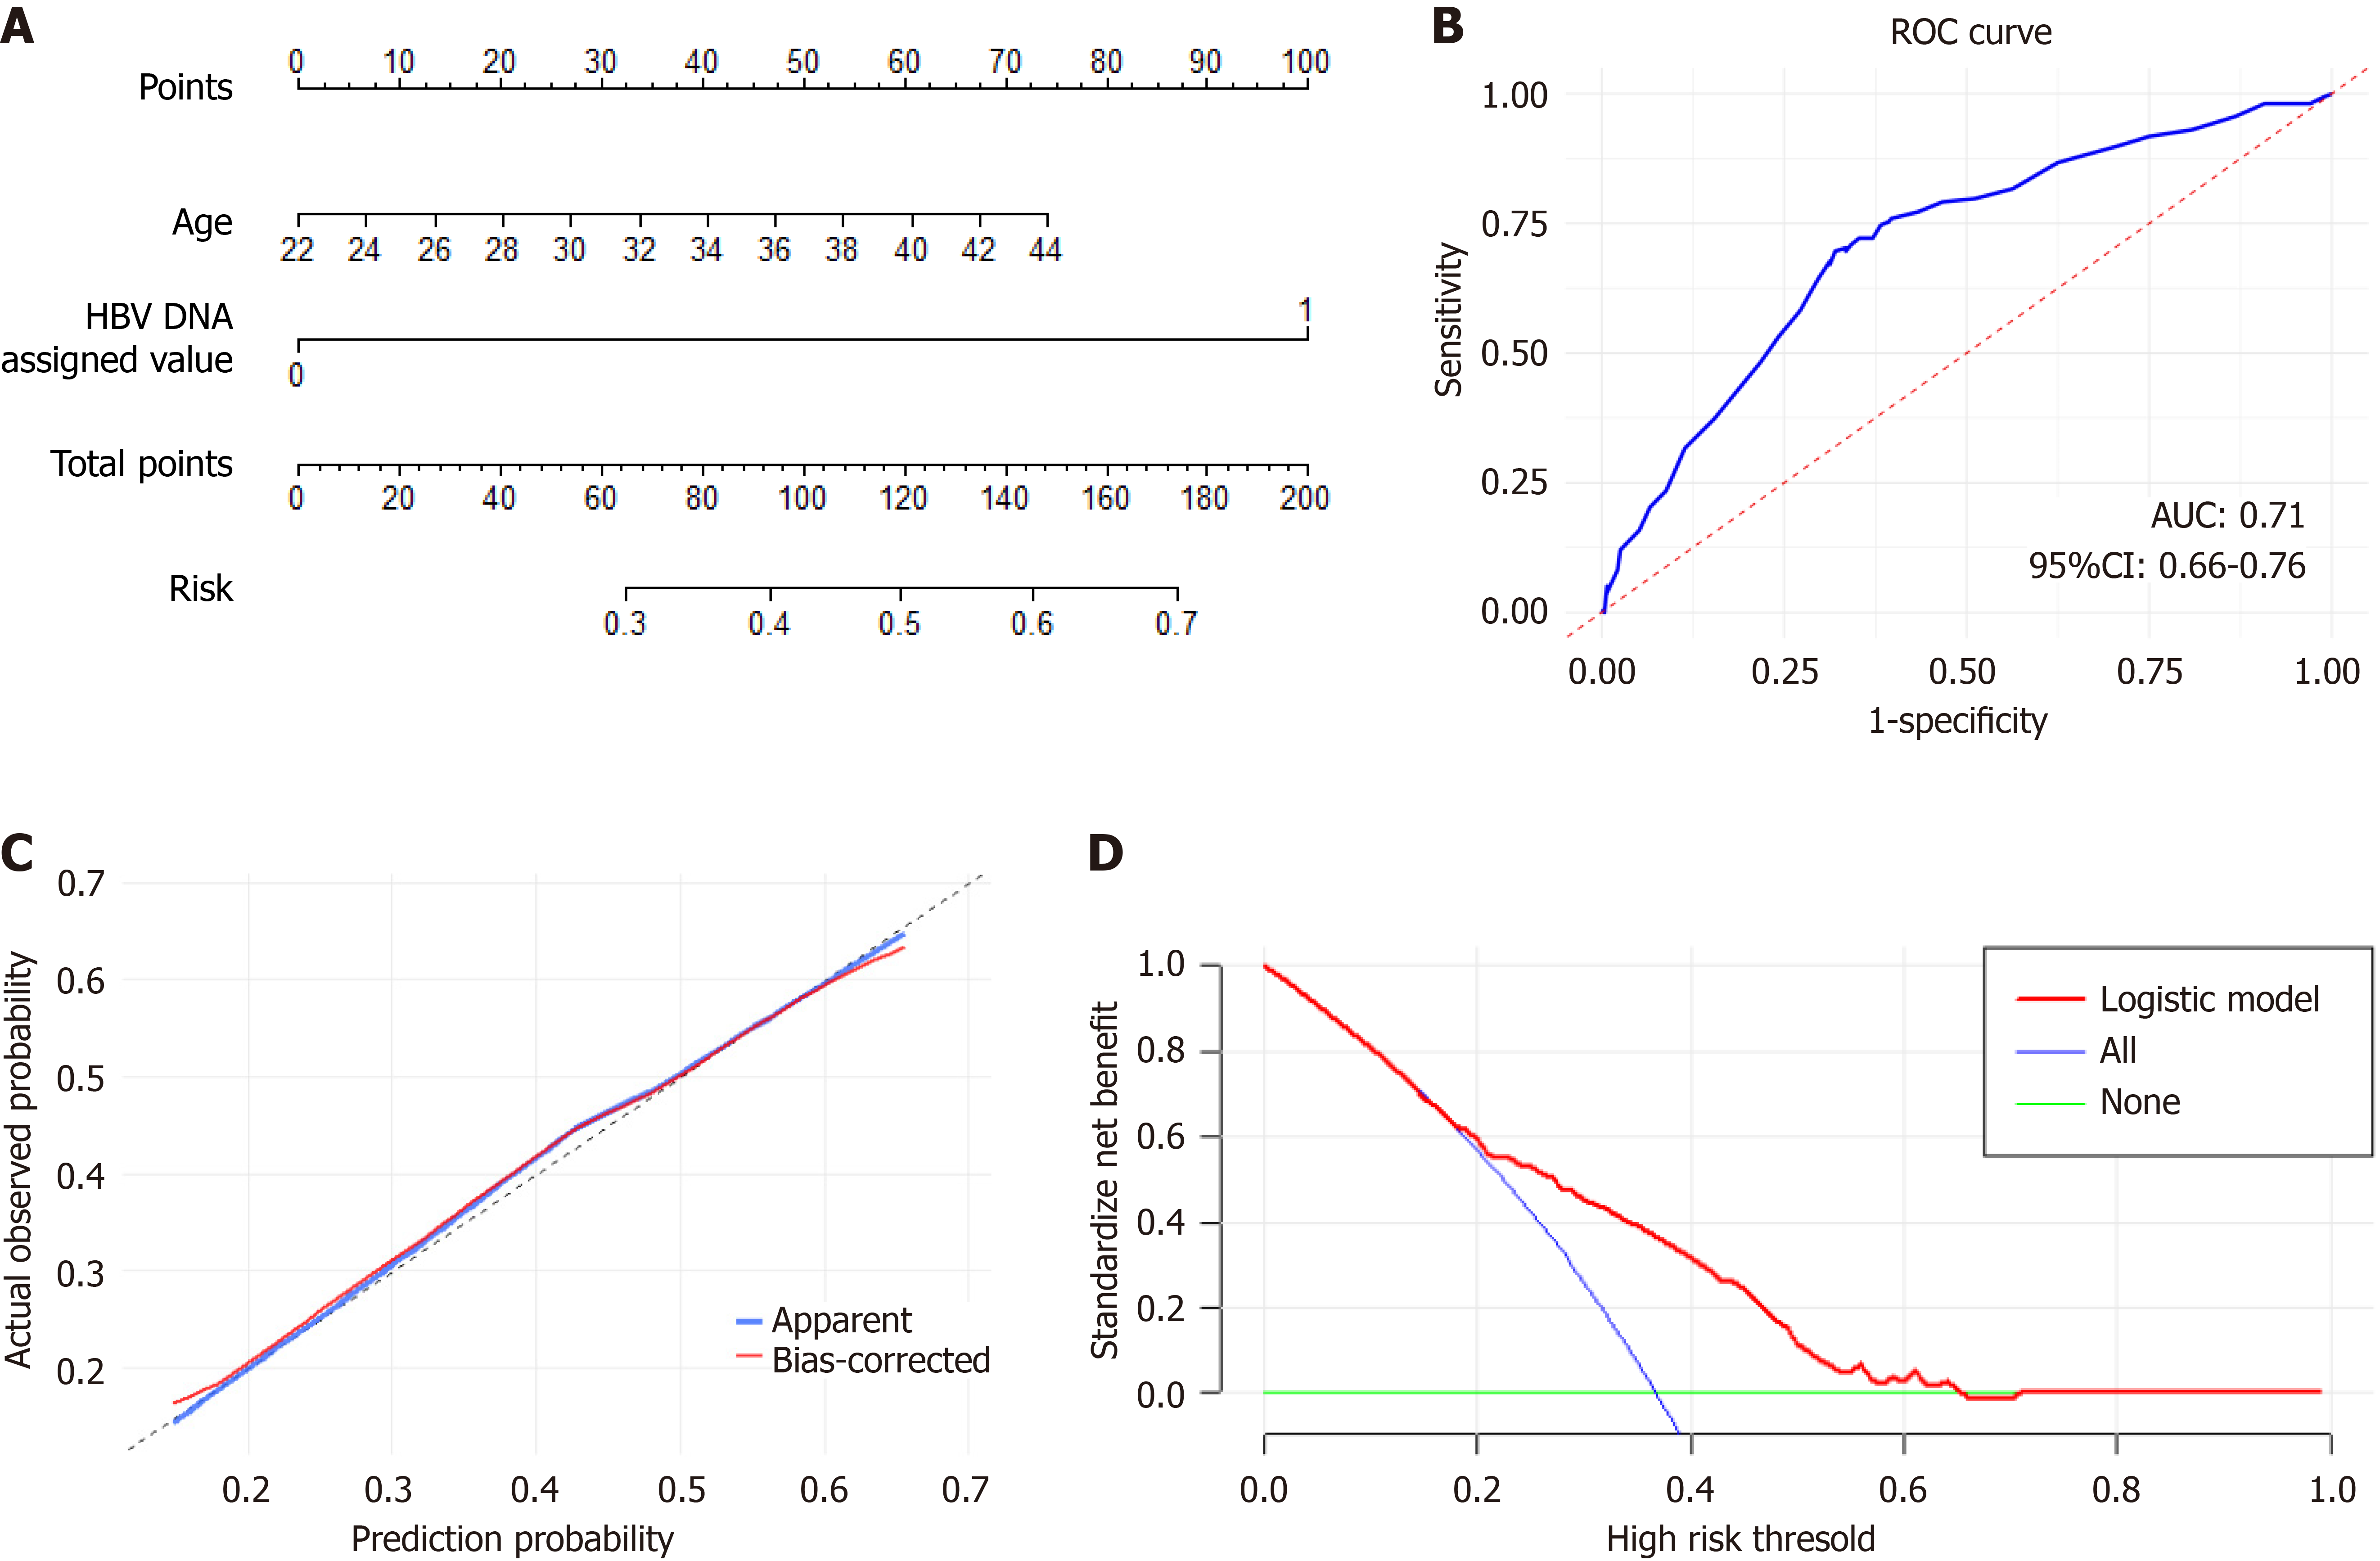
Figure 3 Construction and validation of the predictive nomogram.
A: Nomogram for predicting hepatitis B virus DNA elevation in mid-to-late pregnancy; B: Receiver operating characteristic curve of the predictive model; C: Calibration curve of the predictive model; D: Decision curve analysis for the predictive model. Net benefit was plotted against threshold probability, with the “None” curve denoting no intervention and the “All” curve denoting universal intervention. HBV: Hepatitis B virus; ROC: Receiver operating characteristic; AUC: Area under the curve; CI: Confidence interval.
- Citation: Chen Z, Chen H, Jie B, Peng T, Lin Y, Geng Y, Shen Y, Deng Y, Xie D, Yang L, Ouyang S. Risk factors and predictive model for hepatitis B virus deoxyribonucleic acid elevation in mid-to-late pregnancy with low viremia. World J Hepatol 2026; 18(10): 124577
- URL: https://www.wjgnet.com/1948-5182/full/v18/i10/124577.htm
- DOI: https://dx.doi.org/10.4254/wjh.124577