Copyright
©The Author(s) 2025.
World J Hepatol. Apr 27, 2025; 17(4): 92426
Published online Apr 27, 2025. doi: 10.4254/wjh.v17.i4.92426
Published online Apr 27, 2025. doi: 10.4254/wjh.v17.i4.92426
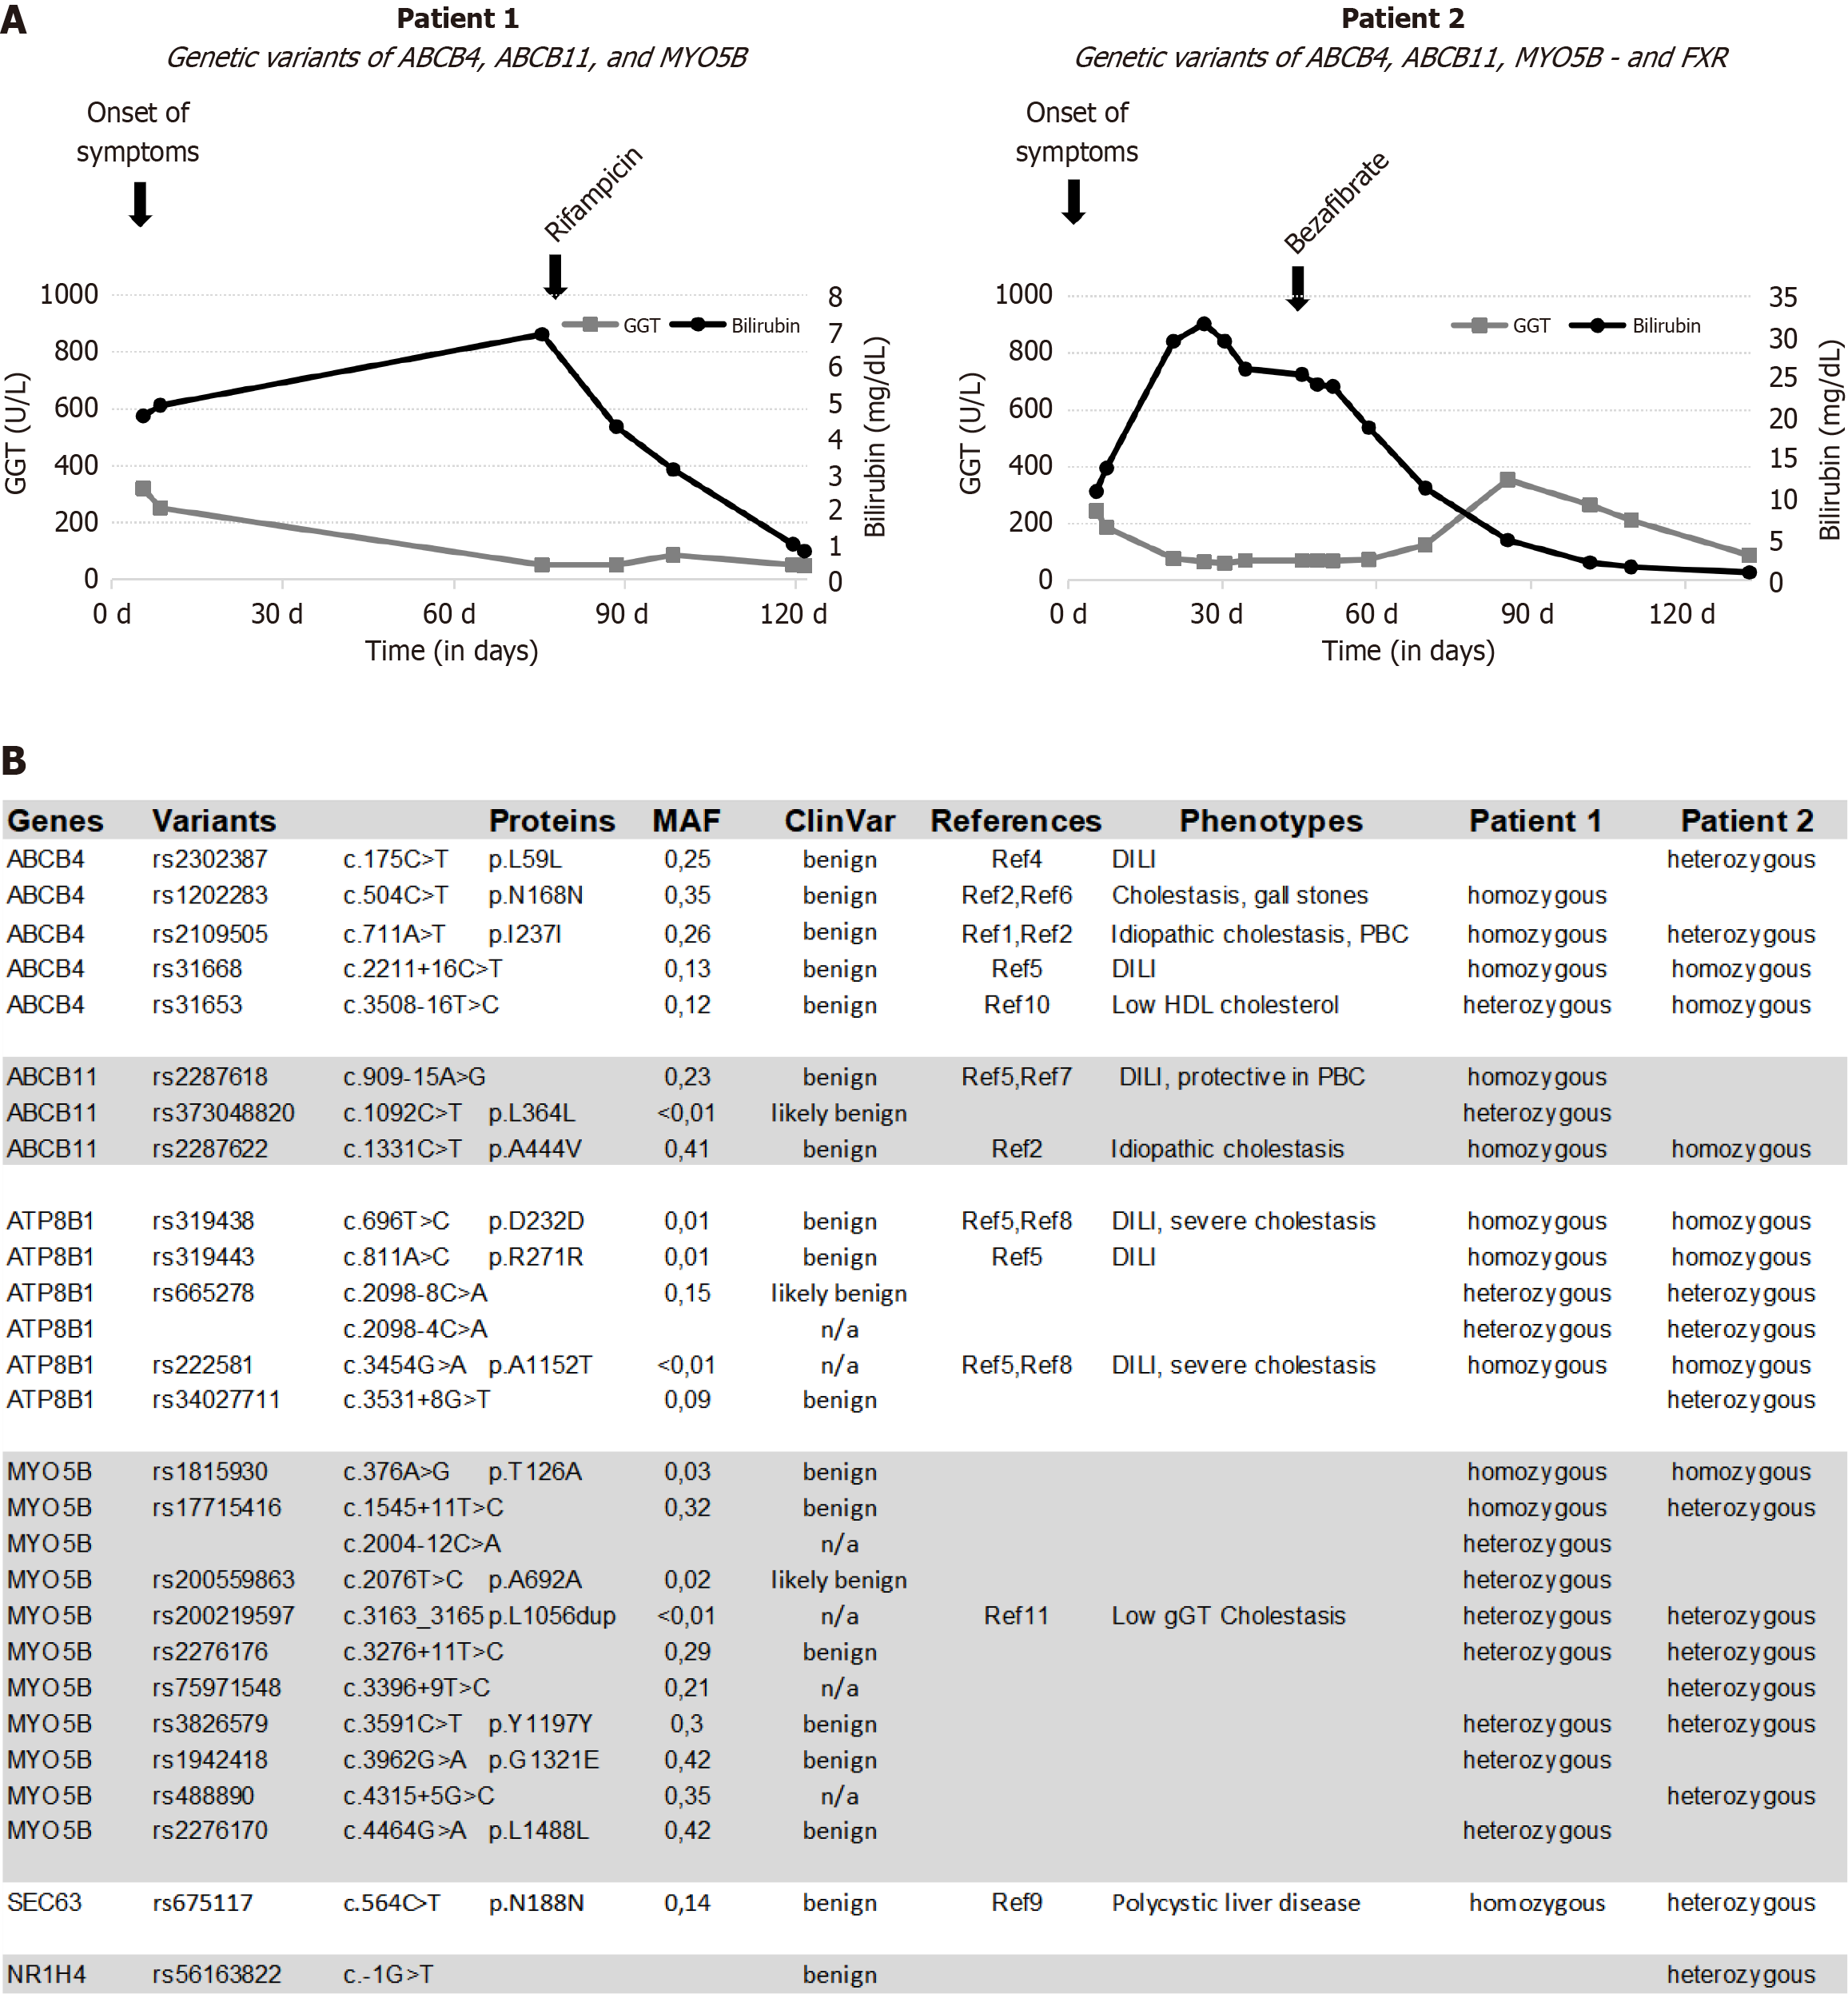
Figure 1 Longitudinal course of liver tests and genetic variants.
A: Clinical course of Patient 1 and Patient 2 showing bilirubin levels (black line) and gamma-glutamyltransferase (GGT) levels (gray line) over time (in days). B: Genetic variants determined by next-generation sequencing and genotyping. Variants are annotated with corresponding minor allele frequencies (MAFs), obtained from ensembl.org, and linked to previously published references (Supplementary Table 1). GGT, gamma-glutamyl transferase; MAF, minor allele frequency; ABCB4: ATP-binding cassette 4; ABCB11: ATP-binding cassette, sub-family B member 11; ATPB1: ATPase phospholipid transporting 8B1; MYO5B: Myosin VB; FXR, farnesoid X receptor; n/a: Not available.
Figure 2 Histology of liver biopsies.
Representative histological staining of liver biopsy samples from both patients. The following stainings were performed: BSEP: Bile salt export pump; CK7: Cytokeratin 7; HE: Hematoxylin and eosin; MAS: Masson’s trichrome; MDR3: Multidrug resistance protein 3. Long scale bar: 100 µm; Short scale bar in inlay: 40 µm (BSEP and MDR3 staining).
- Citation: Drexler S, Haedge F, Weber SN, Krawczyk M, Matter MS, Geppert CI, Weber A, Stieger B, Trautwein C, Kremer AE. Hepatitis E virus infection-triggered intrahepatic cholestasis: A case report. World J Hepatol 2025; 17(4): 92426
- URL: https://www.wjgnet.com/1948-5182/full/v17/i4/92426.htm
- DOI: https://dx.doi.org/10.4254/wjh.v17.i4.92426


