Copyright
©The Author(s) 2025.
World J Hepatol. Apr 27, 2025; 17(4): 105660
Published online Apr 27, 2025. doi: 10.4254/wjh.v17.i4.105660
Published online Apr 27, 2025. doi: 10.4254/wjh.v17.i4.105660
Figure 1 Serum interleukin-36 subfamily levels in liver cirrhosis patients and healthy controls, and their correlation with Child-Pugh scores.
A: Serum interleukin-36 (IL-36) subfamily cytokine levels of patients in the liver cirrhosis (LC) and healthy control groups; B: Serum IL-36 subfamily cytokine levels in the LC group with Child-Pugh Scores. aP < 0.05, bP < 0.01, cP < 0.001. LC: Liver cirrhosis; IL: Interleukin.
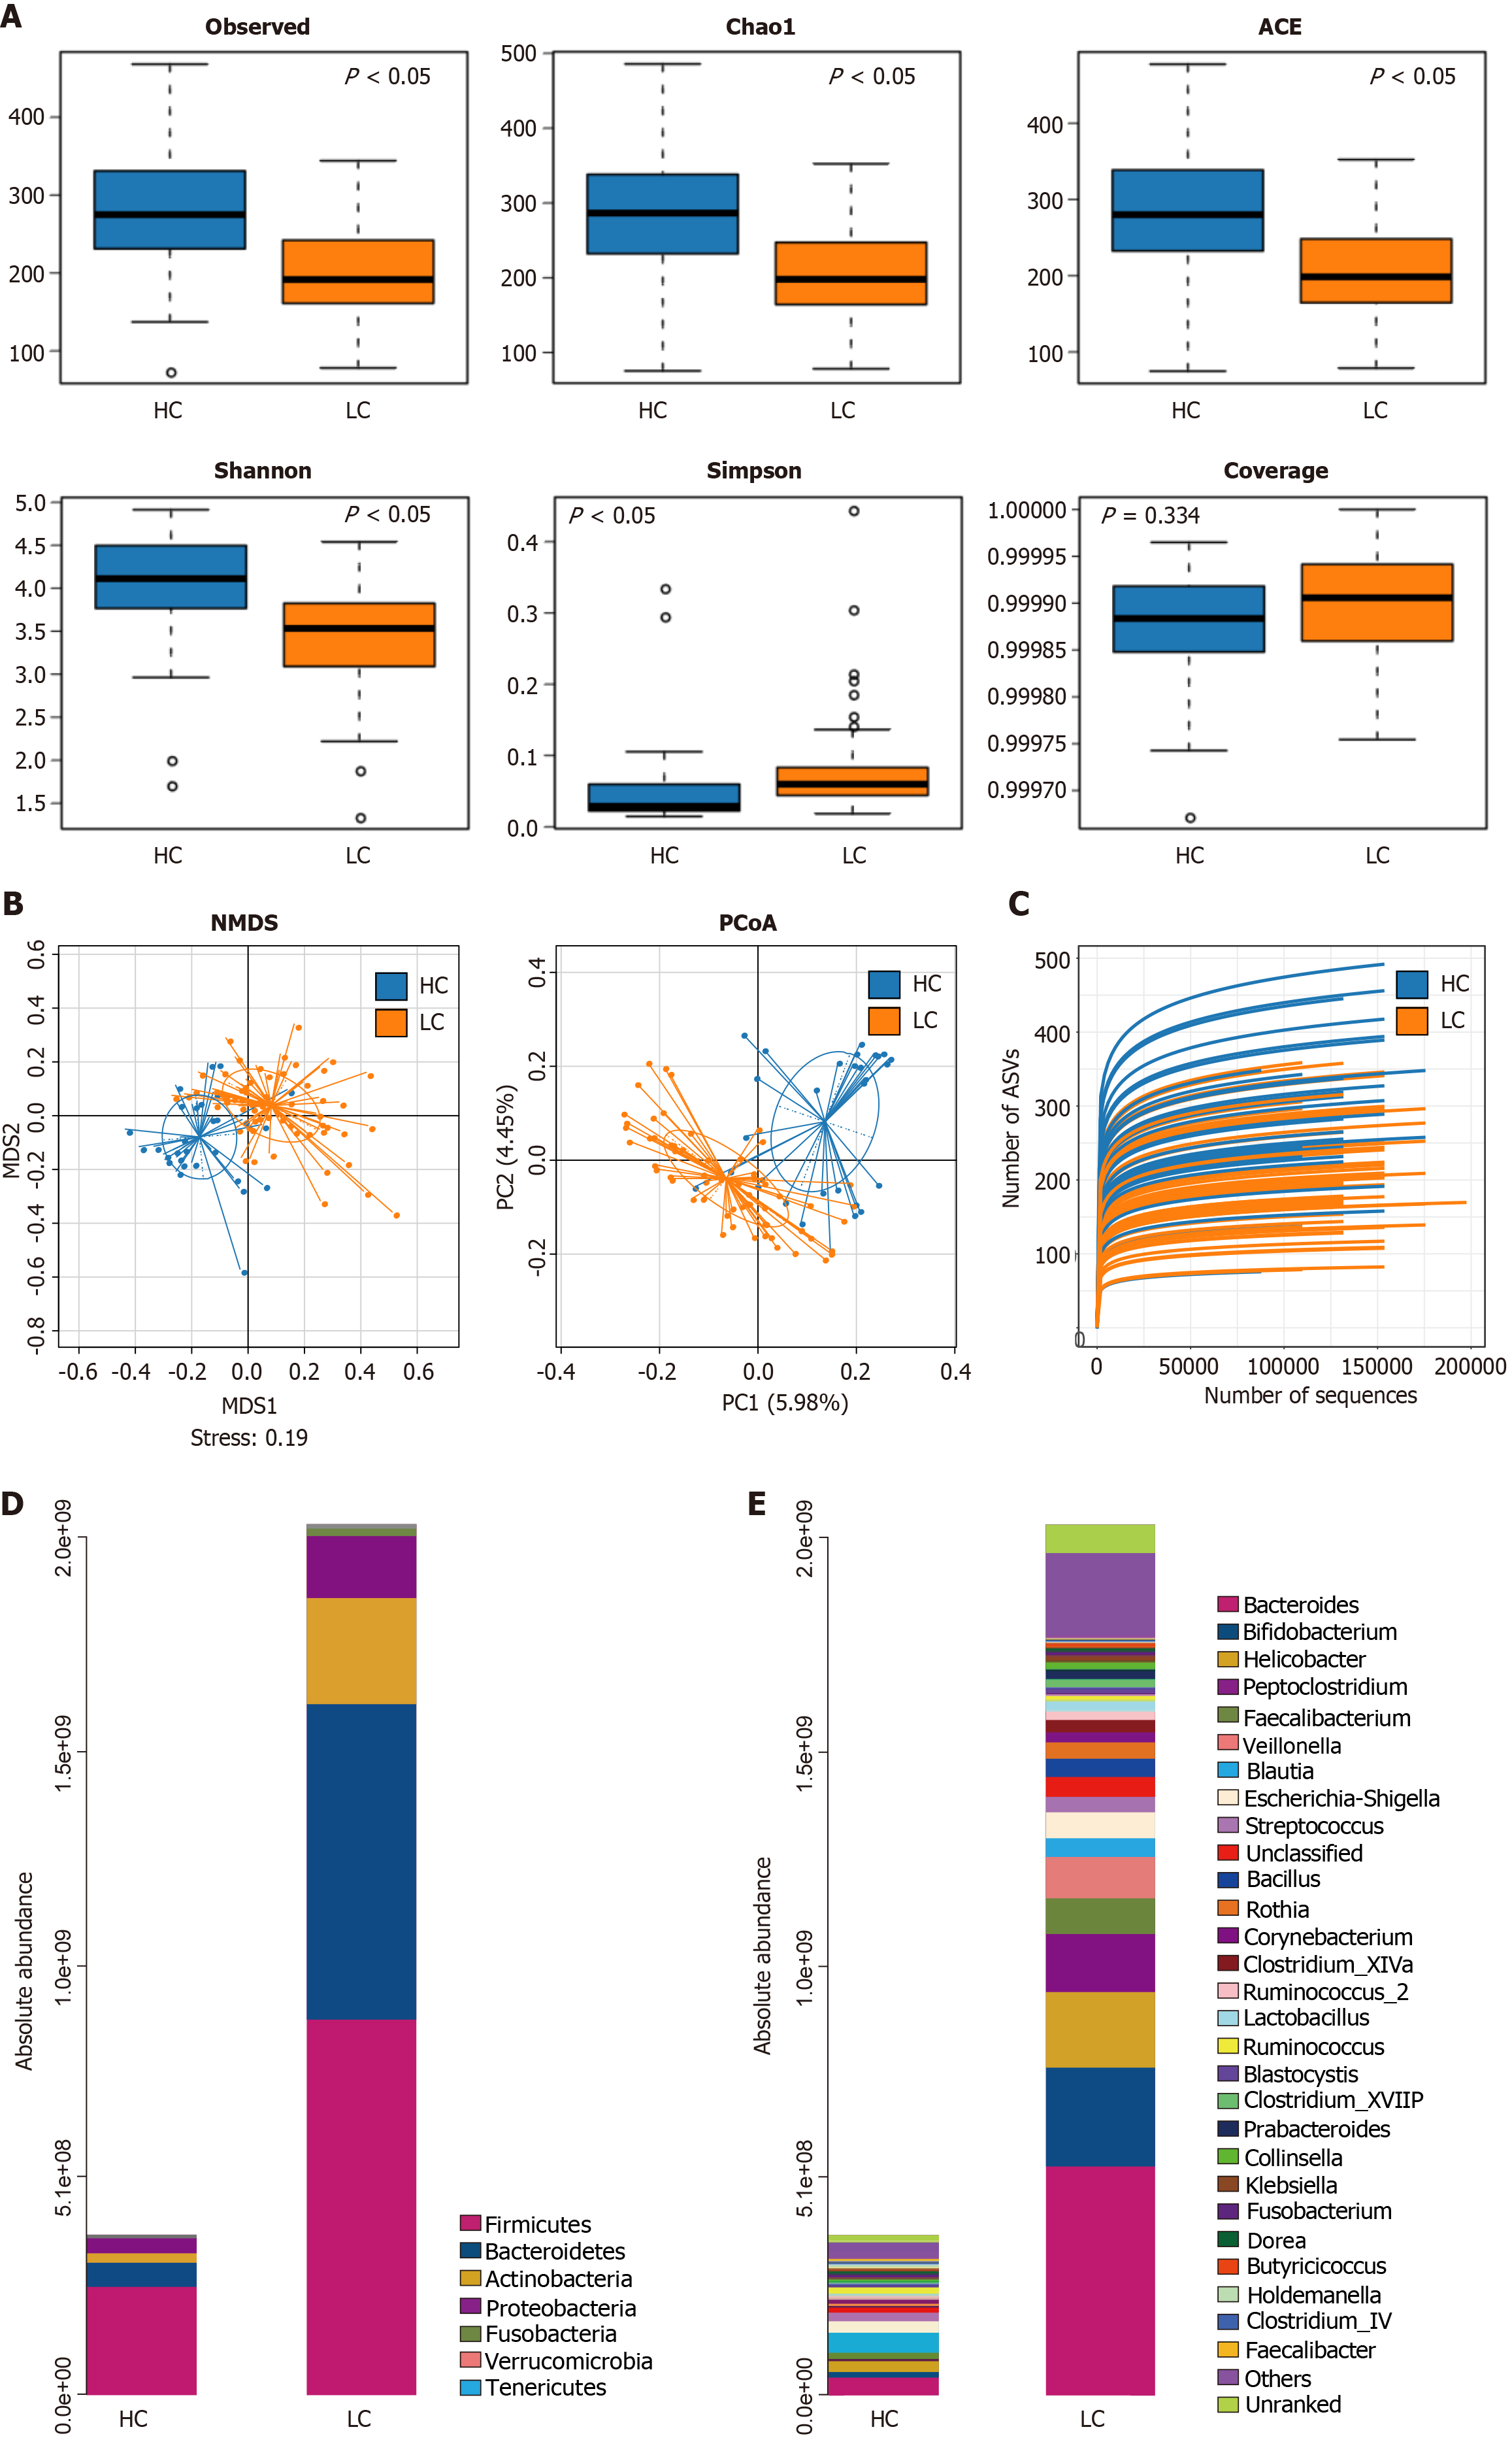
Figure 2 Analysis of the differential gut microbiota in liver cirrhosis patients and healthy controls.
A: Alpha diversity boxplot between the healthy control (HC) and liver cirrhosis (LC) groups. The blue and orange boxplots represent the HC and LC groups, respectively. Each boxplot displays five sample statistics, with the five lines from top to bottom representing the maximum, 75th percentile, median, 25th percentile, and minimum. Dots indicate outliers. A P-value of < 0.05 indicates a statistically significant difference between the two groups; B: Principal coordinates analysis (PCoA): The first two component scores of PCoA1 and PCoA2 are 5.98% and 4.45%, respectively. Non-metric multidimensional scaling (NMDS): An NMDS analysis is considered reliable when the STRESS value is < 0.2; C: Rarefaction Curves: The blue and orange solid lines represent the HC and LC groups, respectively. The rarefaction curves level off, indicating that the sampling in this study is sufficient and the sequencing depth adequately covers all species in the samples, reflecting most of the gut microbiota information; D: Analysis of the absolute quantification and compositional differences of gut microbiota at the phylum level between the HC and LC groups; E: Analysis of the absolute quantification and compositional differences of gut microbiota at the genus level between the HC and LC groups. x- and y-axes represent the groups and abundance values, respectively. Each color in the figure represents a species, with the corresponding species identified by the color legend on the right side of the bar chart. HC: Healthy controls; LC: Liver cirrhosis.
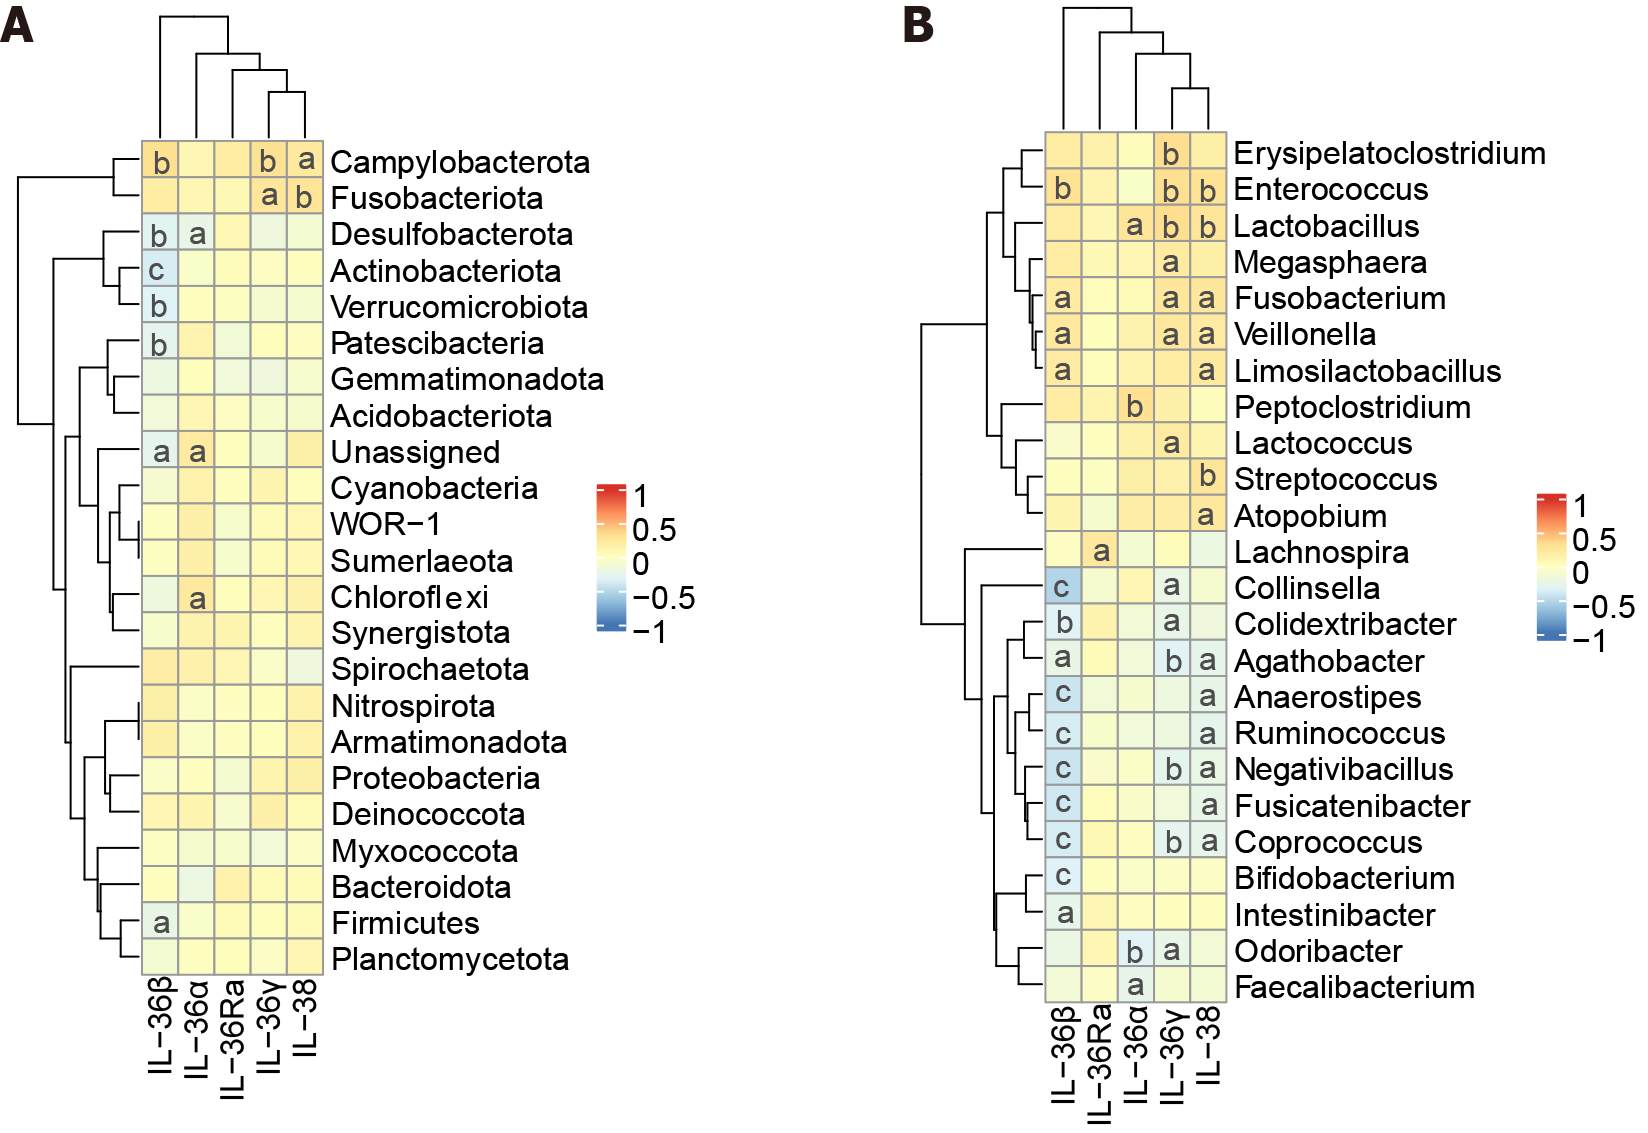
Figure 3 Heatmap of the correlation analysis between the interleukin-36 subfamily and gut microbiota.
A: Heatmap of the correlation analysis between the interleukin-36 (IL-36) subfamily and gut microbiota at the phylum level; B: Heatmap of the correlation analysis between the IL-36 subfamily and gut microbiota at the genus level. aP < 0.05, bP < 0.01, cP < 0.001. IL: Interleukin.
- Citation: Pan YZ, Chen WT, Jin HR, Liu Z, Gu YY, Wang XR, Wang J, Lin JJ, Zhou Y, Xu LM. Correlation between the interleukin-36 subfamily and gut microbiota in patients with liver cirrhosis: Implications for gut-liver axis imbalance. World J Hepatol 2025; 17(4): 105660
- URL: https://www.wjgnet.com/1948-5182/full/v17/i4/105660.htm
- DOI: https://dx.doi.org/10.4254/wjh.v17.i4.105660


